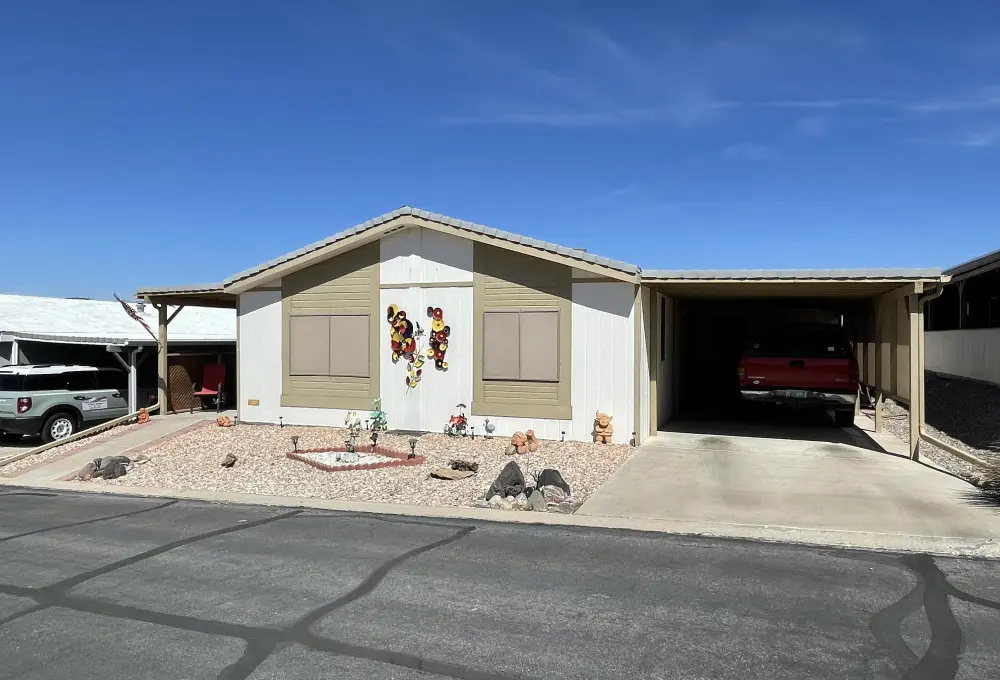
2960 Silver Creek Rd Lot 150 · Bullhead City, AZ
Flood risk 1/10 · Minimal
- FEMA flood zone
- X (unshaded)
- Chance of flooding over 30 yrs
- 0.0%
- Est. flood insurance / yr
- $507 – $1,088
Fire risk 4/10 · Minor
- Est. fire insurance / yr
- $610 – $1,132
Heat risk 9/10 · Severe
- Hot days now (above 111°F)
- 5 days/yr
- Hot days in 30 yrs
- 11 days/yr
Wind risk 1/10 · Minimal
- Chance of severe wind over 30 yrs
- —
Air-quality risk 1/10 · Minimal
- Unhealthy air days now
- 0 days/yr
- Unhealthy air days in 30 yrs
- 0 days/yr
Risk factors via First Street. Map © Google.
Why this score? — see what drove the B- grade
The composite is a weighted blend of 9 inputs, each scored 0–100. Each bar is that input's sub-score; the figure is the points it added to the 100-point composite (weight × sub-score).
- Cash flow +30.0/30.0
- 1% rule +10.0/10.0
- DSCR +10.0/10.0
- ARV discount +7.5/15.0
- Livability +3.2/5.0
- Rent growth +2.3/5.0
- Condition / age +2.2/5.0
- Schools +1.6/10.0
- Appreciation +0.0/10.0
$89,900
🖨 Deal sheet 📄 Offer letter ✓ Due diligence
Listing remarks MLS
This is a one of a kind 2 bedroom, 2 bath floor plan. You wont ever complain again about not having enough cabinet space in this home. Very unique with plenty of rooms for your guests, favorite hobbies or home office. Lots of space in this Laundry room for a small gym or 2nd office. To top this off, a large screened Arizona room was added to this beauty. This home includes a covered carport and a storage shed. Enjoy this 55+ community with pool and community center.
Key facts
- Built 1989
- Listed 86 days
Property features AI
Exterior
- Home design: Single-family property built in 1989; Approximately 1,500 square feet of living area
Interior
- Kitchen: Dishwasher; Microwave; Pantry; Refrigerator
- Flooring: Carpet
- Interior features: Island in the kitchen; Workshop space
Neighborhood map
What this means for you Summary
Snapshot
- This is a 2-bed/2.0-bath manufactured listed at $90k. Condition is rated fair.
Deal economics
- At list price, monthly cash flow is $595 ($7k/yr) — positive.
- The deal already cash-flows at list — no discount required.
- Meets the 1% rule at list price ($2k rent vs $90k).
- Recommended offer: $85k (6.0% below list) — sets the bar for market timing.
- Cap rate 14.2% vs local median 3.7% in Bullhead City — top-decile yield for the area; either an underpriced asset or a hidden risk that comps aren't pricing in. Stress-test before assuming the spread holds.
Location & tenants
- Location reads 64/100 on livability (#103 in AZ) — a middle-class / working-renter tenant base. Strengths: cost of living A+, housing A+; Watch: health & safety C-, employment D, schools F.
- Bullhead City School District (4378) (town): math 16% / reading 22% proficiency, ranked #189 of 249 in AZ (top 76%) — low school quality limits family demand, transient renter base, plan for 1-2y turnover; 68% free/reduced lunch — lower-income household profile, screen leases tightly.
- Market conditions: Rents soft (-0.9%/yr); 710 active listings in the ZIP; 6 comparable units currently listed for rent nearby; rentals leasing fast (median 14d on market — plan ~1-2 weeks tenant-placement turnaround); 2,543 units permitted in Mohave County in 2024 (33 in 5+ unit buildings).
- This rent runs 38% of the median local income ($48k/yr) — at the standard rent-burdened threshold; future hikes will face affordability resistance.
Forward outlook
- Local home prices are declining (-3.0%/yr); year-one equity from $622 of loan paydown is wiped out by about $3k of value loss. Plan a longer hold.
- Mohave County population projected to shrink 6% by 2050 — rents likely to lag national; underwrite the cash flow, not the appreciation.
- At projected returns (-3.0% appreciation + 0.0% rent growth), your $25k cash investment doubles in ~5 years — after that, you're playing with house money.
Negotiation context
- It's been on market 86 days — a 6% lower offer ($85k) is reasonable based on typical stale-listing flexibility.
- 2 sale attempts since 5y ago with the ask held roughly flat each time — persistent listings suggest the price (not the market) is what's stuck; bring a comps-based counter.
Risks & watch-outs
- Climate carrying-cost: extreme-heat days projected 5→11/yr by 2055 (HVAC capex compounding) — expect insurance premiums to compound above CPI over the hold.
Questions for the listing agent
- It's been on market 86 days. Have you received any prior offers? Is the seller open to a 6% concession, seller financing, or rate buy-down credit?
- Have any recent inspections been done? Can we get a copy of the seller's disclosures and any deferred-maintenance estimates?
- Why hasn't it sold? Are there any deal-killer items the seller is aware of (foundation, flood, title, zoning, code violations)?
- Is there a deadline driving the sale (1031 exchange, divorce, estate, relocation)? That informs how much negotiation room exists.
- Schools are F-rated, which usually means shorter tenancies and higher turnover. Who's the typical renter profile here, and what's been the actual vacancy rate?
- Crime grade is D in this area — have there been break-ins, vandalism, or insurance claims at this property in the last 3 years? What carrier currently insures it and at what premium?
- What's the average days-on-market for RENTAL listings here right now (not sales)? A rising rental-DOM trend means longer vacancies and softer asking-rent achievability than the comps imply.
- What's the recent tenant-quality profile in this submarket — average credit score on applications, eviction rate, late-payment / NSF rate, and stable-employment percentage? A property-management company in the area should have these aggregated.
- How much new for-sale + rental construction is in the pipeline within 1–3 miles? Heavy new supply typically softens prices + rents 12–24 months out; constrained supply supports both.
Investment metrics
- 1% rule
- 1.71% ✓
- Cap rate
- 14.23%
- Cash-on-cash
- 28.36%
- DSCR
- 2.26
- GRM
- 4.9
CMA / ARV
- ARV (on-the-fly)
- $201,000
- Comps found
- 6
Show comp detail 6 sales within ~0.75 mi
| Address | Dist | Beds/Ba | Sqft | Sold | Price | $/sf | Match |
|---|---|---|---|---|---|---|---|
| 2960 Silver Creek Rd #174 | 0.07mi | 3/2.0 (+1) | 1,344 (-10%) | 2mo | $115,000 | $86 | 73 |
| 2960 Silver Creek Rd Rd #192 | 0.00mi | 2/2.0 | 1,600 (+7%) | 20mo | $25,000 | $16 | 72 |
| 2960 Silver Creek Rd #1 | 0.00mi | 3/3.0 (+1) | 1,707 (+14%) | 21mo | $110,000 | $64 | 51 |
| 2701 Avenida Grande | 0.69mi | 3/2.0 (+1) | 1,456 (-3%) | 13mo | $278,500 | $191 | 47 |
| 2700 Calle De Mercado | 0.68mi | 3/2.0 (+1) | 1,344 (-10%) | 3mo | $205,000 | $153 | 43 |
| 2784 Paloma Senda | 0.50mi | 3/2.0 (+1) | 1,344 (-10%) | 18mo | $180,400 | $134 | 39 |
Match score weights: distance 35% · size 25% · config 20% · recency 20%. Top-matched comps best support the ARV.
Projected returns pro-forma
-3.0% appreciation · 0.0% rent growth · sell at horizon
- IRR
- 19.2%
- Equity multiple
- 1.75×
- Total profit
- $18,827
- Equity at exit
- $13,404
- IRR
- 25.3%
- Equity multiple
- 2.90×
- Total profit
- $47,836
- Equity at exit
- $7,773
Cash invested: $25,172 (down + closing). Projections, not guarantees.
Landlord ↔ Tenant lean methodology
- Overall (STATE)
- 87 Strongly Landlord-Friendly
- State Arizona
- 87 Strongly Landlord-Friendly · R+3
- County
- — inherits STATE
- City
- — inherits STATE
ZIP-level market 86442
- Home prices YoY
- -27.0%
- Rents YoY
- -0.9%
- Active inventory
- 710
- Price-to-rent
- 4.9×
Monthly cashflow live
- Estimated rent
- $1,539 high interval (Pro) →
- Mortgage (P&I)
- −$471
- Tax est. 1.5%
- −$112 /mo · $1,348/yr
- Insurance
- −$37
- HOA
- −$0
- Vacancy / Maint / Mgmt
- −$323
- Net cashflow
- $595
Break-even live
UW: 25.0% down · 7.5% · 30yr · 1.5% tax · 5.0% vac · 8.0% maint · 8.0% mgmt
Financing live
Cash to close
- Down payment
- $22,475
- Closing costs
- $2,697
- Reserves months
- —
- Total cash needed
- —
Loan-product check · same deal, 3 products live
Conventional
25% down · 7.5% · 30yr
- Down + closing
- —
- Monthly P&I
- —
- Monthly cashflow
- —
- DSCR
- —
- Eligible?
- —
Personal DTI + credit; lowest rate.
DSCR
20% down · 8.5% · 30yr
- Down + closing
- —
- Monthly P&I
- —
- Monthly cashflow
- —
- DSCR
- —
- Eligible?
- —
No personal income docs; deal must DSCR.
Hard money
10% down · 12.0% · 12mo
- Down + closing
- —
- Monthly P&I
- —
- Monthly cashflow
- —
- DSCR
- —
- Eligible?
- —
Short-term bridge; refi at stabilization.
Rent comps 6 comps
| Address | Beds | Baths | Sqft | Rent | $/sqft | DOM | Units | Dist |
|---|---|---|---|---|---|---|---|---|
| 2665 Calle De Mercado Unit 10 Bullhead City, AZ | 2.0 | 2.5 | 1198 | $1,295 | $1.08 | 13d | 1 | 0.76mi |
| 1717 El Cazador Bullhead City, AZ | 3.0 | 2.0 | 1354 | $1,600 | $1.18 | 13d | 1 | 1.01mi |
| 2634 Discovery Rd Bullhead City, AZ | 2.0 | 2.5 | 2180 | $1,750 | $0.80 | 13d | 1 | 1.37mi |
| 2030 Prospector Ct Bullhead City, AZ | 2.0–3.0 | 2.0 | 1118 | $1,259 | $1.13 | 13d | 13 | 1.43mi |
| 2690 Sanctuary Dr Bullhead City, AZ | 3.0 | 2.5 | 2180 | $2,500 | $1.15 | 21d | 1 | 1.47mi |
| 2440 Tapatio Dr Bullhead City, AZ | 3.0 | 2.0 | 1615 | $1,599 | $0.99 | 21d | 1 | 1.49mi |
Listing history 19 events
-
2026-06-18days on market $89,900 Active 86 DOM
-
2026-06-17days on market $89,900 Active 85 DOM
-
2026-06-16days on market $89,900 Active 84 DOM
-
2026-06-15days on market $89,900 Active 83 DOM
-
2026-06-14days on market $89,900 Active 81 DOM
-
2026-06-13days on market $89,900 Active 80 DOM
-
2026-06-10days on market $89,900 Active 78 DOM
-
2026-06-09days on market $89,900 Active 77 DOM
-
2026-06-08days on market $89,900 Active 76 DOM
-
2026-06-07days on market $89,900 Active 75 DOM
-
2026-06-05remarks 332-char remark
-
2026-06-05days on market $89,900 Active 72 DOM
-
2026-06-02days on market $89,900 Active 70 DOM
-
2026-06-01days on market $89,900 Active 69 DOM
-
2026-05-31days on market $89,900 Active 68 DOM
-
2026-05-30days on market $89,900 Active 67 DOM
-
2026-03-25$89,900 Active
-
2021-09-27soldstatus $85,000 470-char remark
Show marketing remark (470 chars)
This is a one of a kind 2 bedroom, 2 bath floor plan. You wont ever complain again about not having enough cabinet space in this home. Very unique with plenty of rooms for your guests, favorite hobbies or home office. Lots of space in this Laundry room for a small gym or 2nd office. To top this off, a large screened Arizona room was added to this beauty. This home includes a covered carport and a storage shed. Enjoy this 55+ community with pool and community center.
-
2021-08-23$90,000 470-char remark
Show marketing remark (470 chars)
This is a one of a kind 2 bedroom, 2 bath floor plan. You wont ever complain again about not having enough cabinet space in this home. Very unique with plenty of rooms for your guests, favorite hobbies or home office. Lots of space in this Laundry room for a small gym or 2nd office. To top this off, a large screened Arizona room was added to this beauty. This home includes a covered carport and a storage shed. Enjoy this 55+ community with pool and community center.
ⓘ Source: listings_history table (triggers on properties + properties_extension) + one-shot
backfill from property_details.listing_events for pre-trigger history.
Climate risk First Street
- Flood 1/10 Low FEMA zone X (unshaded) · 0% chance over 30 yrs
- Wildfire 4/10 Moderate
- Heat 9/10 Extreme 5 d/yr ≥111°F today · 11 d/yr by 30 yrs out
- Wind 1/10 Low
- Air quality 1/10 Low 0 unhealthy d/yr today · 0 by 30 yrs out
Nearby sold comps map
Loading sold comps map…
Walkable amenities ~0.75 mi
Loading nearby amenities…
Taxation est. · year 1
- Rental income
- $18,472
- − Mortgage interest
- −$5,036
- − Property taxes
- −$1,348
- − Insurance
- −$450
- − Repairs & maintenance
- −$1,478
- − Management
- −$1,478
- − Depreciation
- −$2,615
- Taxable income
- $6,067
- Est. tax owed @ 24.0%
- −$1,456
- After-tax cash flow
- $5,681/yr
For passive investors: Depreciation is non-cash, so a rental often shows a tax loss while cash-flowing — sheltering income. Rental losses are passive: they offset passive income freely, and up to $25,000/yr can offset ordinary (W-2) income if you actively participate and your MAGI is under $100k (phasing out to $0 by $150k); unused losses carry forward. On sale, claimed depreciation is recaptured at up to 25%, and gains may owe capital-gains tax (a 1031 exchange can defer both). Figures are a year-1 estimate at your 24.0% rate — not tax advice; consult a CPA.
Condition & rehab AI · 12 photos
This manufactured home requires moderate repairs and updates to its kitchen, bathroom, exterior, and interior. Upgrading these areas will significantly increase its resale and rental value.
Repairs flagged
- Moderate kitchen cabinets — dated and in need of replacement
- Moderate bathroom fixtures — dated and in need of replacement
- Moderate exterior paint — moderate wear and tear
- Moderate interior paint — moderate wear and tear
- Moderate flooring — dated and in need of replacement
Value-add opportunities
- Resale update kitchen cabinets and appliances — modernizing the kitchen will attract more buyers
- Resale update bathroom fixtures and cabinetry — modernizing the bathroom will attract more buyers
- Both paint exterior and interior — improving the curb appeal and interior will attract more buyers and renters
- Both replace flooring — modernizing the flooring will attract more buyers and renters
Renovation cost estimate screening
| Repair item | Severity | Est. cost |
|---|---|---|
| kitchen cabinets · dated and in need of replacement | Moderate | $3,000–15,000 |
| bathroom fixtures · dated and in need of replacement | Moderate | $3,000–15,000 |
| exterior paint · moderate wear and tear | Moderate | $3,000–15,000 |
| interior paint · moderate wear and tear | Moderate | $3,000–15,000 |
| flooring · dated and in need of replacement | Moderate | $3,000–15,000 |
| Total estimated repair cost · 5 items | $15,000–75,000 |
Value-add ROI direction
- Resale update kitchen cabinets and appliances — modernizing the kitchen will attract more buyers ↑
- Resale update bathroom fixtures and cabinetry — modernizing the bathroom will attract more buyers ↑
- Both paint exterior and interior — improving the curb appeal and interior will attract more buyers and renters ↑
- Both replace flooring — modernizing the flooring will attract more buyers and renters ↑
ⓘ Cost ranges are severity-bucket heuristics (US national rule-of-thumb). Get contractor quotes + a written scope before underwriting a rehab budget.
Schools (NCES district)
- District
- Bullhead City School District (4378)
- NCES district ID
- 0401500
- Math proficiency
- 16% ▼ -11.00%
- Reading proficiency
- 22% ▼ -6.00%
- Median HH income
- $37,109
- Composite
- 15.83/100
- National rank
- #9263
- State rank
- #189 of 249 in AZ
Livability — Bullhead City
- Score
- 64/100
- State rank
- #103
- US rank
- #14458
Category grades
Schools grade is shown separately in the Schools card above.
Census & demographics
- Census place
- Bullhead City, AZ
- County
- Mohave County · 181,906 people
- City population
- 43,354
- Metro
- Lake Havasu City-Kingman, AZ
- Population (ZIP)
- 34,735
- Household income
- $48,081
- Rent vs Own
- Severe rent burden
- 1040.0
Population outlook (Mohave County) Hauer SSP2
- Today (2025)
- 209,184 people
- By 2030
- 209,674 · +0.2%
- By 2040
- 205,897 · -1.6%
- By 2050
- 196,810 · -5.9%
- By 2075
- 169,454 · -19.0%
- By 2100
- 136,630 · -34.7%
Race, ethnicity, and origin ACS 2023
- Neighborhood character
- Predominantly White (68%)
- Race & ethnicity
- White 68% Hispanic / Latino 22% Two or more races 12% Black 2% Asian 2%
- Hispanic origin (detail)
- Mexican 19%
- Common ancestry
- Portuguese 3% Romanian 2% Lithuanian 2%
- Foreign-born
- 9% · Canada, South Korea
- Languages at home
- 87% English-only · Spanish 11%
Political lean MEDSL · Mohave
- 2024 margin
- Solid R (+55.8) · D 21.8% · R 77.6%
- 2008→2024 swing
- -22.9pp toward R · 2008: -32.9pp · 2024: -55.8pp
- All cycles
- 2024: R+55.8 2020: R+51.3 2016: R+51.5 2012: R+42.6 2008: R+32.9
Not yet ingested
- Civics
- —
Market trends
- HPI YoY
- ▼ -100.11%
- Current HPI
- 270.3297
- Rent YoY
- ▼ -0.90%
- Metro
- Lake Havasu City-Kingman, AZ
- State GDP YoY
- ▲ 4.54%
- F500 in state
- 20
Industry mix (Fortune 500 HQ in AZ)
| Industry | F500 HQs | Revenue |
|---|---|---|
| Technology | 2 | $13B |
|
||
| Mining / Metals | 1 | $23B |
|
||
| Environmental Services | 1 | $16B |
|
||
| Metals / Steel | 1 | $14B |
|
||
| Technology Distribution | 1 | $9B |
|
||
| Homebuilding | 1 | $8B |
|
||
Price history
-0.1% since first listed3 events — show timeline
- 2026-03-25 Listed $89,900 FSBO.com
- 2021-09-27 Sold (MLS) $85,000 WARDEX
- 2021-08-23 Listed $90,000 WARDEX
Cash-flow waterfall
monthlySold comps — $/sqft
last 12 mo · ≤1 miLoading sold comps…