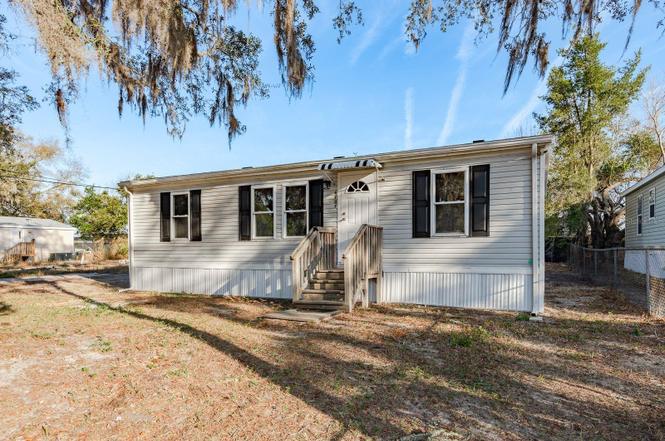
6707 Celeste Ln · New Port Richey, FL
Flood risk 1/10 · Minimal
- FEMA flood zone
- X (unshaded)
- Chance of flooding over 30 yrs
- 0.0%
- Est. flood insurance / yr
- $507 – $1,088
Fire risk 2/10 · Minimal
- Est. fire insurance / yr
- $947 – $1,759
Heat risk 10/10 · Severe
- Hot days now (above 108°F)
- 7 days/yr
- Hot days in 30 yrs
- 27 days/yr
Wind risk 10/10 · Severe
- Chance of severe wind over 30 yrs
- 99.0%
Air-quality risk 2/10 · Minimal
- Unhealthy air days now
- 1 days/yr
- Unhealthy air days in 30 yrs
- 3 days/yr
Risk factors via First Street. Map © Google.
Why this score? — see what drove the C- grade
The composite is a weighted blend of 9 inputs, each scored 0–100. Each bar is that input's sub-score; the figure is the points it added to the 100-point composite (weight × sub-score).
- Cash flow +22.0/30.0
- DSCR +7.0/10.0
- 1% rule +5.7/10.0
- ARV discount +4.9/15.0
- Schools +4.3/10.0
- Livability +4.1/5.0
- Condition / age +2.5/5.0
- Rent growth +1.8/5.0
- Appreciation +0.0/10.0
$150,000
🖨 Deal sheet (PDF) 📄 Offer letter ✓ Due diligence
Listing remarks MLS
"REDUCED" Mobile home lot ready for another mobile home. Presently vacant lot. Has county water and electric on site, ready for your mobile. In the Town of New Port Richey. Every resonable offer seriously considered. "REDUCED"
Key facts
- Barn door feature
- New dimensional roof
- Double pane windows
Tags
Property features AI
Finance
- Other: Zoning: MF2; Lot approximately 0.12 acres; Living area about 972 square feet; Unfurnished; No lease restrictions indicated
Exterior
- Utilities: Public sewer (connected); Public water listed as none; Electricity connected; Cable available; Broadband/high-speed internet available
- Home design: Manufactured double-wide home; Single-story; North-facing
- Construction: Vinyl siding; Shingle roof; Crawlspace foundation; Built on one level
- Exterior features: Rain gutters; Paved road access
Interior
- Kitchen: Dishwasher; Microwave; Range; Refrigerator; Stone counters; Eat-in kitchen
- Bedrooms: 3 bedrooms
- Bathrooms: 2 full bathrooms
- Heating & cooling: Central heating (electric); Central air conditioning
- Interior features: Ceiling fans; Eat-in kitchen; Open floorplan; Stone counters; Walk-in closet(s); Window treatments; Double pane windows
- Laundry & utility: Indoor laundry room; Tankless water heater
Neighborhood map
What this means for you Summary
Snapshot
- This is a 3-bed/2.0-bath manufactured listed at $150k.
Deal economics
- At list price, monthly cash flow is $239 ($3k/yr) — positive.
- The deal already cash-flows at list — no discount required.
- Meets the 1% rule at list price ($2k rent vs $150k).
- Recommended offer: $136k (9.0% below list) — sets the bar for market timing.
- Cap rate 8.2% vs local median 1.9% in New Port Richey — top-decile yield for the area; either an underpriced asset or a hidden risk that comps aren't pricing in. Stress-test before assuming the spread holds.
Location & tenants
- Location reads 82/100 on livability (#67 in FL, #1,139 nationally) — a professional / high-income tenant draw. Strengths: amenities A+, cost of living A+, housing A+; Watch: crime C-, commute D, employment F.
- Pasco (suburban): math 50% / reading 52% proficiency, ranked #32 of 73 in FL (top 44%) — acceptable for families but not a draw, mixed tenant base, ~2y average lease.
- Zoned schools: Calusa Elementary School (math 26% / reading 27%, grade F, #2,009 of 2,144 statewide, top 94%, 473 students, 85% FRL); Chasco Middle School (math 32% / reading 31%, grade F, #453 of 571 statewide, top 81%, 688 students, 84% FRL) — zoned schools average 85% FRL vs 48% district-wide (36 pts higher); higher-poverty schools than district average — tighter screening recommended.
- Zoned-school proficiency averages 29% at this address vs 51% district-wide (-22 pts) — the specific schools serving this property underperform the Pasco average; the district grade overstates school quality for this exact location.
- Market conditions: Rents soft (-2.9%/yr); 306 active listings in the ZIP; 35 comparable units currently listed for rent nearby; rentals at typical pace (median 26d on market — plan ~3-4 weeks tenant-placement turnaround); 6,765 units permitted in Pasco County in 2024 (1,250 in 5+ unit buildings).
- This rent runs 39% of the median local income ($50k/yr) — at the standard rent-burdened threshold; future hikes will face affordability resistance.
Forward outlook
- Local home prices are declining (-3.0%/yr); year-one equity from $1k of loan paydown is wiped out by about $4k of value loss. Plan a longer hold.
- Pasco County population projected at +29% by 2050 — long-run rental-demand tailwind backs the buy-and-hold thesis.
Negotiation context
- It's been on market 93 days — a 9% lower offer ($136k) is reasonable based on typical stale-listing flexibility.
- 4 sale attempts since 17y ago; this cycle's ask has dropped $50k (25%) from the opening price — seller is motivated, your offer sets the floor, not the list.
- Current owner paid $9k; list at $150k implies a 1567% gain — meaningful room to come down on a strong offer.
Risks & watch-outs
- Climate carrying-cost: severe wind risk, 99% chance of damaging wind over 30y; extreme-heat days projected 7→27/yr by 2055 (HVAC capex compounding) — expect insurance premiums to compound above CPI over the hold.
Questions for the listing agent
- It's been on market 93 days. Have you received any prior offers? Is the seller open to a 9% concession, seller financing, or rate buy-down credit?
- Why hasn't it sold? Are there any deal-killer items the seller is aware of (foundation, flood, title, zoning, code violations)?
- Is there a deadline driving the sale (1031 exchange, divorce, estate, relocation)? That informs how much negotiation room exists.
- What's the average days-on-market for RENTAL listings here right now (not sales)? A rising rental-DOM trend means longer vacancies and softer asking-rent achievability than the comps imply.
- What's the recent tenant-quality profile in this submarket — average credit score on applications, eviction rate, late-payment / NSF rate, and stable-employment percentage? A property-management company in the area should have these aggregated.
- How much new for-sale + rental construction is in the pipeline within 1–3 miles? Heavy new supply typically softens prices + rents 12–24 months out; constrained supply supports both.
Investment metrics
- 1% rule
- 1.07% ✓
- Cap rate
- 8.20%
- Cash-on-cash
- 6.83%
- DSCR
- 1.30
- GRM
- 7.8
CMA / ARV
- ARV (on-the-fly)
- $141,912
- Comps found
- 2
Show comp detail 2 sales within ~0.75 mi
| Address | Dist | Beds/Ba | Sqft | Sold | Price | $/sf | Match |
|---|---|---|---|---|---|---|---|
| 6608 Celeste Ln | 0.10mi | 2/2.0 (-1) | 888 (-9%) | 13mo | $95,000 | $107 | 65 |
| 6601 Kumquat Dr | 0.57mi | 2/2.0 (-1) | 925 (-5%) | 18mo | $135,000 | $146 | 45 |
Match score weights: distance 35% · size 25% · config 20% · recency 20%. Top-matched comps best support the ARV.
Projected returns pro-forma
-3.0% appreciation · 0.0% rent growth · sell at horizon
- IRR
- -9.2%
- Equity multiple
- 0.67×
- Total profit
- $-13,774
- Equity at exit
- $22,365
- IRR
- -4.4%
- Equity multiple
- 0.75×
- Total profit
- $-10,496
- Equity at exit
- $12,969
Cash invested: $42,000 (down + closing). Projections, not guarantees.
Landlord ↔ Tenant lean methodology
- Overall (STATE)
- 87 Strongly Landlord-Friendly
- State Florida
- 87 Strongly Landlord-Friendly · R+3
- County
- — inherits STATE
- City
- — inherits STATE
ZIP-level market 34653
- Home prices YoY
- -18.4%
- Rents YoY
- -2.9%
- Active inventory
- 306
- Price-to-rent
- 7.8×
Monthly cashflow live
- Estimated rent
- $1,604 high interval (Pro) →
- Mortgage (P&I)
- −$787
- Tax from tax record
- −$179 /mo · $2,154/yr
- Insurance
- −$62
- HOA
- −$0
- Vacancy / Maint / Mgmt
- −$337
- Net cashflow
- $239
Break-even live
Sensitivity live
| Price | -10% $324 | -5% $281 | +0% $239 | +5% $196 | +10% $154 |
|---|---|---|---|---|---|
| Rent | -10% $112 | -5% $176 | +0% $239 | +5% $302 | +10% $366 |
| Rate | -1.0pp $314 | -0.5pp $277 | base $239 | +0.5pp $200 | +1.0pp $160 |
UW: 25.0% down · 7.5% · 30yr · 1.5% tax · 5.0% vac · 8.0% maint · 8.0% mgmt
Financing live
Cash to close
- Down payment
- $37,500
- Closing costs
- $4,500
- Reserves months
- —
- Total cash needed
- —
Loan-product check · same deal, 3 products live
Conventional
25% down · 7.5% · 30yr
- Down + closing
- —
- Monthly P&I
- —
- Monthly cashflow
- —
- DSCR
- —
- Eligible?
- —
Personal DTI + credit; lowest rate.
DSCR
20% down · 8.5% · 30yr
- Down + closing
- —
- Monthly P&I
- —
- Monthly cashflow
- —
- DSCR
- —
- Eligible?
- —
No personal income docs; deal must DSCR.
Hard money
10% down · 12.0% · 12mo
- Down + closing
- —
- Monthly P&I
- —
- Monthly cashflow
- —
- DSCR
- —
- Eligible?
- —
Short-term bridge; refi at stabilization.
Rent comps 35 comps
| Address | Beds | Baths | Sqft | Rent | $/sqft | DOM | Units | Dist |
|---|---|---|---|---|---|---|---|---|
| 7140 Bellaire Ter New Port Richey, FL | 2.0 | 1.0 | 776 | $1,350 | $1.74 | 25d | 1 | 0.13mi |
| 7138 Bellaire Ter New Port Richey, FL | 2.0 | 1.0 | 776 | $1,350 | $1.74 | 25d | 1 | 0.13mi |
| 6548 Batea Ter New Port Richey, FL | 3.0 | 2.0 | 1120 | $1,800 | $1.61 | 25d | 1 | 0.24mi |
| 6338 Aberdeen Ave New Port Richey, FL | 3.0 | 2.0 | 1000 | $2,300 | $2.30 | 18d | 1 | 0.46mi |
| 6300 Limerick Ave New Port Richey, FL | 3.0 | 2.0 | 953 | $1,650 | $1.73 | 25d | 1 | 0.50mi |
| 6430 Lomand Ave New Port Richey, FL | 2.0 | 1.5 | 952 | $1,550 | $1.63 | 25d | 1 | 0.51mi |
| 6324 Lomand Ave New Port Richey, FL | 2.0 | 1.5 | 720 | $1,375 | $1.91 | 25d | 1 | 0.57mi |
| 6721 Congress St New Port Richey, FL | 2.0 | 1.0 | 830 | $1,250 | $1.51 | 25d | 1 | 0.57mi |
| 6635 Crossbow Ln New Port Richey, FL | 2.0 | 2.0 | 1082 | $1,695 | $1.57 | 19d | 1 | 0.58mi |
| 7212 Carlton Arms Dr New Port Richey, FL | 2.0 | 1.0–2.0 | 877 | $1,609 | $1.83 | 25d | 1 | 0.58mi |
| 6332 Pennsylvania Ave New Port Richey, FL | 2.0 | 1.0 | 920 | $1,250 | $1.36 | 25d | 1 | 0.82mi |
| 6332 Pennsylvania Ave New Port Richey, FL | 2.0 | 1.0 | 962 | $1,250 | $1.30 | 22d | 1 | 0.82mi |
| 6120 Indiana Ave New Port Richey, FL | 2.0 | 1.0 | 676 | $1,299 | $1.92 | 5d | 1 | 0.88mi |
| 7018 Washington St New Port Richey, FL | 2.0 | 1.0 | 700 | $1,200 | $1.71 | 0d | 1 | 0.93mi |
| 6921 Washington St Unit 3Apt 3 Port Richey, FL | 2.0 | 1.0 | 750 | $1,269 | $1.69 | 22d | 1 | 1.02mi |
| 7730 Washington St Port Richey, FL | 2.0 | 1.0 | 840 | $1,575 | $1.88 | 16d | 1 | 1.05mi |
| 7730 Washington St Port Richey, FL | 3.0 | 1.0 | 1040 | $1,575 | $1.51 | 25d | 1 | 1.05mi |
| 5800 Virginia Ave New Port Richey, FL | 2.0 | 1.0 | 900 | $1,495 | $1.66 | 22d | 1 | 1.08mi |
| 5800 Virginia Ave New Port Richey, FL | 2.0 | 1.0 | 900 | $1,550 | $1.72 | 14d | 1 | 1.08mi |
| 8356 Journet Blvd Port Richey, FL | 1.0–2.0 | 1.0 | 843 | $1,315 | $1.56 | 25d | 1 | 1.12mi |
| 7731 Chapel Ave Port Richey, FL | 2.0 | 1.0 | 828 | $1,250 | $1.51 | 25d | 1 | 1.14mi |
| 6332 Grand Blvd Port Richey, FL | 2.0 | 2.0 | 894 | $1,962 | $2.20 | 0d | 3 | 1.26mi |
| 5848 Siesta Ln Port Richey, FL | 2.0 | 1.0 | 800 | $1,250 | $1.56 | 14d | 1 | 1.27mi |
| 7124 Green St New Port Richey, FL | 2.0 | 1.0 | 1000 | $1,195 | $1.20 | 3d | 1 | 1.29mi |
| 8540 Robilina Rd Port Richey, FL | 1.0–2.0 | 1.0 | 722 | $1,432 | $1.98 | 4d | 14 | 1.30mi |
| 6931 Julia Ct New Port Richey, FL | 1.0–2.0 | 1.0 | 800 | $1,495 | $1.87 | 4d | 4 | 1.32mi |
| 5822 Congress St #104 New Port Richey, FL | 2.0 | 2.0 | 920 | $1,650 | $1.79 | 25d | 1 | 1.32mi |
| 7013 Green St New Port Richey, FL | 3.0 | 2.0 | 1104 | $1,500 | $1.36 | 3d | 1 | 1.34mi |
| 8228 Chasco Woods Blvd Port Richey, FL | 1.0–3.0 | 1.0–2.0 | 966 | $1,760 | $1.82 | 0d | 22 | 1.34mi |
| 5816 Congress St New Port Richey, FL | 2.0 | 2.0 | 920 | $1,400 | $1.52 | 25d | 1 | 1.34mi |
| 5335 Palmetto Rd New Port Richey, FL | 2.0 | 1.0 | 800 | $1,475 | $1.84 | 25d | 1 | 1.36mi |
| 5321 Avery Rd Unit 1 New Port Richey, FL | 2.0 | 1.0 | 720 | $1,150 | $1.60 | 4d | 1 | 1.37mi |
| 6029 Wyoming Ave New Port Richey, FL | 2.0 | 1.0 | 792 | $1,850 | $2.34 | 25d | 1 | 1.37mi |
| 5805 Delaware Ave New Port Richey, FL | 2.0 | 1.0 | 700 | $1,250 | $1.79 | 25d | 1 | 1.40mi |
| 6322 Alaska Ave New Port Richey, FL | 2.0 | 1.0 | 720 | $1,500 | $2.08 | 25d | 1 | 1.40mi |
Listing history 21 events
-
2026-06-17status $150,000 Pending 93 DOM
-
2026-06-16days on market $150,000 Active 93 DOM
-
2026-06-15days on market $150,000 Active 92 DOM
-
2026-06-13pricedays on market $150,000 Active 90 DOM
-
2026-06-09days on market $159,900 Active 86 DOM
-
2026-06-08days on market $159,900 Active 85 DOM
-
2026-06-07days on market $159,900 Active 84 DOM
-
2026-06-04days on market $159,900 Active 81 DOM
-
2026-06-03days on market $159,900 Active 80 DOM
-
2026-05-31days on market $159,900 Active 79 DOM
-
2026-05-01status Active
-
2026-04-21price $159,900
-
2026-03-23price $179,900
-
2026-03-10price $195,000
-
2026-02-26$200,000 Active
-
2024-11-06historical
-
2024-09-12price $109,000
-
2024-05-01$119,000 Active
-
2009-09-04soldstatus $9,000
-
2009-09-01soldstatus $9,000 246-char remark
Show marketing remark (246 chars)
"REDUCED" Mobile home lot ready for another mobile home. Presently vacant lot. Has county water and electric on site, ready for your mobile. In the Town of New Port Richey. Every resonable offer seriously considered. "REDUCED"
-
2009-01-05$12,700 246-char remark
Show marketing remark (246 chars)
"REDUCED" Mobile home lot ready for another mobile home. Presently vacant lot. Has county water and electric on site, ready for your mobile. In the Town of New Port Richey. Every resonable offer seriously considered. "REDUCED"
ⓘ Source: listings_history table (triggers on properties + properties_extension) + one-shot
backfill from property_details.listing_events for pre-trigger history.
Tax reassessment forecast FL · Resets to sale price
- Current annual tax
- $2,154 · $179/mo
- Projected year-2 tax
- $2,154 · $179/mo
- Expected delta
- $0/yr ($0/mo · 0.0%)
ⓘ Screening estimate from a state-policy table — verify with the county assessor before closing.
Climate risk First Street
- Flood 1/10 Low FEMA zone X (unshaded) · 0% chance over 30 yrs
- Wildfire 2/10 Low
- Heat 10/10 Extreme 7 d/yr ≥108°F today · 27 d/yr by 30 yrs out
- Wind 10/10 Extreme 99% chance of damaging wind over 30 yrs
- Air quality 2/10 Low 1 unhealthy d/yr today · 3 by 30 yrs out
Nearby sold comps map
Loading sold comps map…
Walkable amenities ~0.75 mi
Loading nearby amenities…
Taxation est. · year 1
- Rental income
- $19,253
- − Mortgage interest
- −$8,402
- − Property taxes
- −$2,154
- − Insurance
- −$750
- − Repairs & maintenance
- −$1,540
- − Management
- −$1,540
- − Depreciation
- −$4,364
- Taxable income
- $503
- Est. tax owed @ 24.0%
- −$121
- After-tax cash flow
- $2,746/yr
For passive investors: Depreciation is non-cash, so a rental often shows a tax loss while cash-flowing — sheltering income. Rental losses are passive: they offset passive income freely, and up to $25,000/yr can offset ordinary (W-2) income if you actively participate and your MAGI is under $100k (phasing out to $0 by $150k); unused losses carry forward. On sale, claimed depreciation is recaptured at up to 25%, and gains may owe capital-gains tax (a 1031 exchange can defer both). Figures are a year-1 estimate at your 24.0% rate — not tax advice; consult a CPA.
Schools (NCES district)
- District
- Pasco
- NCES district ID
- 1201530
- Math proficiency
- 50% ▼ -10.00%
- Reading proficiency
- 52% ▼ -5.00%
- Median HH income
- $45,039
- Composite
- 43.14/100
- National rank
- #3074
- State rank
- #32 of 73 in FL
Livability — New Port Richey
- Score
- 82/100
- State rank
- #67
- US rank
- #1139
Category grades
Schools grade is shown separately in the Schools card above.
Census & demographics
- Census place
- New Port Richey, FL
- County
- Pasco County · 524,098 people
- City population
- 137,708
- Metro
- Tampa-St. Petersburg-Clearwater, FL
- Population (ZIP)
- 35,945
- Household income
- $49,563
- Rent vs Own
- Severe rent burden
- 1439.0
Population outlook (Pasco County) Hauer SSP2
- Today (2025)
- 570,045 people
- By 2030
- 605,844 · +6.3%
- By 2040
- 674,806 · +18.4%
- By 2050
- 736,022 · +29.1%
- By 2075
- 862,900 · +51.4%
- By 2100
- 906,364 · +59.0%
Race, ethnicity, and origin ACS 2023
- Neighborhood character
- Predominantly White (74%)
- Race & ethnicity
- White 74% Hispanic / Latino 14% Two or more races 9% Black 6% Asian 2%
- Hispanic origin (detail)
- Mexican 3% Puerto Rican 4% Cuban 2%
- Common ancestry
- Romanian 3% Lithuanian 2% Slovak 2%
- Foreign-born
- 11% · Canada, Jamaica, China
- Languages at home
- 84% English-only · Spanish 9% Other Indo-European 2% Russian/Polish/Slavic 2%
Political lean MEDSL · Pasco
- 2024 margin
- Strong R (+25.2) · D 36.9% · R 62.1% · Other 1.0%
- 2008→2024 swing
- -21.6pp toward R · 2008: -3.6pp · 2024: -25.2pp
- All cycles
- 2024: R+25.2 2020: R+20.1 2016: R+21.6 2012: R+6.7 2008: R+3.6
Not yet ingested
- Civics
- —
Market trends
- HPI YoY
- ▼ -73.10%
- Current HPI
- 324.6519
- Rent YoY
- ▼ -2.92%
- Metro
- Tampa-St. Petersburg-Clearwater, FL
- State GDP YoY
- ▲ 3.28%
- F500 in state
- 36
Industry mix (Fortune 500 HQ in FL)
| Industry | F500 HQs | Revenue |
|---|---|---|
| Industrial Technology | 2 | $29B |
|
||
| Insurance | 2 | $17B |
|
||
| Retail | 1 | $60B |
|
||
| Technology Distribution | 1 | $58B |
|
||
| Homebuilding | 1 | $35B |
|
||
| Technology Manufacturing | 1 | $35B |
|
||
Price history
+1159.1% since first listed11 events — show timeline
- 2026-05-01 Relisted — Stellar MLS as Distributed by MLS Grid
- 2026-04-21 Price Changed $159,900 Stellar MLS as Distributed by MLS Grid
- 2026-03-23 Price Changed $179,900 Stellar MLS as Distributed by MLS Grid
- 2026-03-10 Price Changed $195,000 Stellar MLS as Distributed by MLS Grid
- 2026-02-26 Listed $200,000 Stellar MLS as Distributed by MLS Grid
- 2024-11-06 Listing Removed — Stellar MLS as Distributed by MLS Grid
- 2024-09-12 Price Changed $109,000 Stellar MLS as Distributed by MLS Grid
- 2024-05-01 Listed $119,000 Stellar MLS as Distributed by MLS Grid
- 2009-09-04 Sold (Public Records) $9,000 Public Records
- 2009-09-01 Sold (MLS) $9,000 Stellar MLS as Distributed by MLS Grid
- 2009-01-05 Listed $12,700 Stellar MLS as Distributed by MLS Grid
Property tax history
+25.8%/yrLatest (2025): $2,154 · +1.7% YoY. Source: county tax records.
Cash-flow waterfall
monthlySold comps — $/sqft
last 12 mo · ≤1 miLoading sold comps…