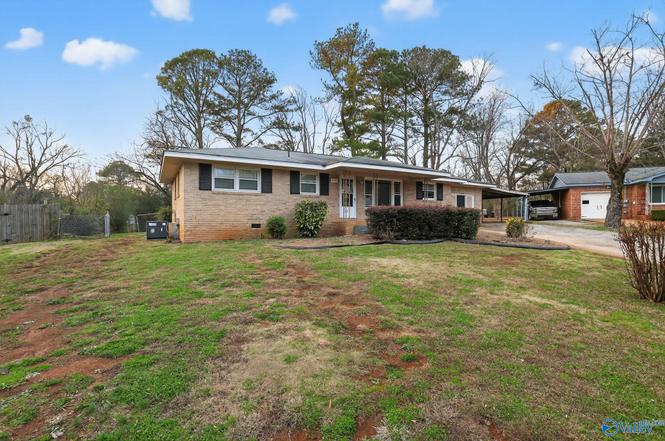
3110 S Nevel Cir NW · Huntsville, AL
Flood risk 1/10 · Minimal
- FEMA flood zone
- X (unshaded)
- Chance of flooding over 30 yrs
- 0.0%
- Est. flood insurance / yr
- $507 – $1,088
Fire risk 1/10 · Minimal
- Est. fire insurance / yr
- $916 – $1,700
Heat risk 5/10 · Moderate
- Hot days now (above 105°F)
- 7 days/yr
- Hot days in 30 yrs
- 19 days/yr
Wind risk 4/10 · Minor
- Chance of severe wind over 30 yrs
- 18.0%
Air-quality risk 2/10 · Minimal
- Unhealthy air days now
- 1 days/yr
- Unhealthy air days in 30 yrs
- 1 days/yr
Risk factors via First Street. Map © Google.
Why this score? — see what drove the C grade
The composite is a weighted blend of 9 inputs, each scored 0–100. Each bar is that input's sub-score; the figure is the points it added to the 100-point composite (weight × sub-score).
- Cash flow +20.5/30.0
- ARV discount +11.7/15.0
- DSCR +6.5/10.0
- 1% rule +4.5/10.0
- Livability +4.1/5.0
- Schools +2.9/10.0
- Rent growth +2.5/5.0
- Condition / age +2.5/5.0
- Appreciation +0.0/10.0
$164,900
🖨 Deal sheet 📄 Offer letter ✓ Due diligence
Listing remarks
Welcome to 3110 S Nevel Cir NW, a spacious 3-bedroom, 2-bath home with a generous and functional layout. This residence includes multiple living areas, a well-appointed kitchen, and comfortable bedroom spaces that suit a variety of needs. Situated on a large 0.39-acre lot, the property provides plenty of outdoor space for relaxing, gardening, or entertaining. The quiet cul-de-sac location adds an extra sense of privacy while still keeping you close to local amenities, parks, and major routes in Huntsville. This is a great opportunity to enjoy a well-kept home with ample indoor and outdoor living space.
Key facts
- Large lot
- Outdoor space
- 0.39 acre lot
Tags
Neighborhood map
What this means for you Summary
Snapshot
- This is a 3-bed/0.5-bath single-family listed at $165k.
Deal economics
- At list price, monthly cash flow is $216 ($3k/yr) — positive.
- The deal already cash-flows at list — no discount required.
- To meet the 1% rule (rent ≥ 1% of price), the offer needs to be $156k (5.2% below list).
- Recommended offer: $145k (12.0% below list) — sets the bar for market timing.
- Cap rate 7.9% vs local median 3.8% in Huntsville — top-decile yield for the area; either an underpriced asset or a hidden risk that comps aren't pricing in. Stress-test before assuming the spread holds.
Location & tenants
- Location reads 82/100 on livability (#3 in AL, #1,082 nationally) — a professional / high-income tenant draw. Strengths: commute A+, cost of living A+, housing A+; Watch: crime F.
- Huntsville City (urban): math 21% / reading 46% proficiency, ranked #48 of 129 in AL (top 37%) — families likely to look elsewhere, expect single-tenant / working-renter base with shorter leases.
- Zoned schools: Jemison High School (math 12% / reading 12%, grade F, #242 of 305 statewide, top 80%, 843 students, 64% FRL) — zoned schools average 64% FRL vs 46% district-wide (18 pts higher); higher-poverty schools than district average — tighter screening recommended.
- Zoned-school proficiency averages 12% at this address vs 34% district-wide (-22 pts) — the specific schools serving this property underperform the Huntsville City average; the district grade overstates school quality for this exact location.
- Market conditions: Rents soft (-0.1%/yr); 337 active listings in the ZIP; 40 comparable units currently listed for rent nearby; rentals lingering (median 44d on market — plan ~5-8 weeks vacancy on turnover, expect pricing pressure); 58% of comp listings sitting > 30 days — soft ceiling on asking rent; 4,709 units permitted in Madison County in 2024 (1,186 in 5+ unit buildings).
- This rent runs 37% of the median local income ($51k/yr) — at the standard rent-burdened threshold; future hikes will face affordability resistance.
Forward outlook
- Local home prices are declining (-3.0%/yr); year-one equity from $1k of loan paydown is wiped out by about $5k of value loss. Plan a longer hold.
- Madison County population projected at +18% by 2050 — long-run rental-demand tailwind backs the buy-and-hold thesis.
Negotiation context
- It's been on market 144 days — a 12% lower offer ($145k) is reasonable based on typical stale-listing flexibility.
- 2 sale attempts since 5y ago; this cycle's ask has dropped $20k (11%) from the opening price — seller is motivated, your offer sets the floor, not the list.
Risks & watch-outs
- Climate carrying-cost: extreme-heat days projected 7→19/yr by 2055 (HVAC capex compounding) — expect insurance premiums to compound above CPI over the hold.
Questions for the listing agent
- It's been on market 144 days. Have you received any prior offers? Is the seller open to a 12% concession, seller financing, or rate buy-down credit?
- Built in 1963 — when were the roof, HVAC, electrical panel, plumbing, and water heater last replaced?
- Why hasn't it sold? Are there any deal-killer items the seller is aware of (foundation, flood, title, zoning, code violations)?
- Is there a deadline driving the sale (1031 exchange, divorce, estate, relocation)? That informs how much negotiation room exists.
- Crime grade is F in this area — have there been break-ins, vandalism, or insurance claims at this property in the last 3 years? What carrier currently insures it and at what premium?
- What's the average days-on-market for RENTAL listings here right now (not sales)? A rising rental-DOM trend means longer vacancies and softer asking-rent achievability than the comps imply.
- What's the recent tenant-quality profile in this submarket — average credit score on applications, eviction rate, late-payment / NSF rate, and stable-employment percentage? A property-management company in the area should have these aggregated.
- How much new for-sale + rental construction is in the pipeline within 1–3 miles? Heavy new supply typically softens prices + rents 12–24 months out; constrained supply supports both.
Investment metrics
- 1% rule
- 0.95% ✗
- Cap rate
- 7.87%
- Cash-on-cash
- 5.62%
- DSCR
- 1.25
- GRM
- 8.8
CMA / ARV
- ARV (on-the-fly)
- $181,888
- Comps found
- 12
Show comp detail 12 sales within ~0.75 mi
| Address | Dist | Beds/Ba | Sqft | Sold | Price | $/sf | Match |
|---|---|---|---|---|---|---|---|
| 3809 Cary Rd | 0.41mi | 3/2.0 | 1,410 (-1%) | 5mo | $217,000 | $154 | 69 |
| 2410 Halmac Dr | 0.37mi | 3/1.5 | 1,300 (-8%) | 4mo | $170,000 | $131 | 61 |
| 4006 Mcewen Dr | 0.26mi | 3/1.5 | 1,250 (-12%) | 4mo | $100,000 | $80 | 61 |
| 3413 Avondale Dr NW | 0.33mi | 3/2.0 | 1,220 (-14%) | 4mo | $139,000 | $114 | 52 |
| 3615 Vogel Dr | 0.73mi | 3/2.0 | 1,384 (-3%) | 7mo | $215,000 | $155 | 50 |
| 3906 NW Broadmor Rd | 0.72mi | 4/2.0 (+1) | 1,423 (+0%) | 7mo | $223,775 | $157 | 49 |
| 3402 Greenhill Dr | 0.67mi | 4/1.0 (+1) | 1,350 (-5%) | 7mo | $104,000 | $77 | 48 |
| 3304 NW Watson Dr | 0.62mi | 3/1.5 | 1,291 (-9%) | 6mo | $190,700 | $148 | 46 |
| 2416 Redmont Rd NW | 0.37mi | 4/2.0 (+1) | 1,629 (+15%) | 2mo | $135,000 | $83 | 46 |
| 3701 Broadmor Rd NW | 0.58mi | 3/2.0 | 1,627 (+14%) | 1mo | $208,000 | $128 | 42 |
| 3900 Vogel Dr NW | 0.61mi | 3/1.5 | 1,628 (+15%) | 3mo | $191,500 | $118 | 41 |
| 3308 Barton St | 0.74mi | 3/2.0 | 1,589 (+12%) | 3mo | $135,000 | $85 | 37 |
Match score weights: distance 35% · size 25% · config 20% · recency 20%. Top-matched comps best support the ARV.
Projected returns pro-forma
-3.0% appreciation · 0.0% rent growth · sell at horizon
- IRR
- -10.8%
- Equity multiple
- 0.62×
- Total profit
- $-17,575
- Equity at exit
- $24,587
- IRR
- -5.9%
- Equity multiple
- 0.66×
- Total profit
- $-15,478
- Equity at exit
- $14,258
Cash invested: $46,172 (down + closing). Projections, not guarantees.
Landlord ↔ Tenant lean methodology
- Overall (STATE)
- 90 Strongly Landlord-Friendly
- State Alabama
- 90 Strongly Landlord-Friendly · R+15
- County
- — inherits STATE
- City
- — inherits STATE
ZIP-level market 35810
- Home prices YoY
- -23.5%
- Rents YoY
- -0.1%
- Active inventory
- 337
- Price-to-rent
- 8.8×
Monthly cashflow live
- Estimated rent
- $1,564 high interval (Pro) →
- Mortgage (P&I)
- −$865
- Tax from tax record
- −$86 /mo · $1,028/yr
- Insurance
- −$69
- HOA
- −$0
- Vacancy / Maint / Mgmt
- −$328
- Net cashflow
- $216
Break-even live
UW: 25.0% down · 7.5% · 30yr · 1.5% tax · 5.0% vac · 8.0% maint · 8.0% mgmt
Financing live
Cash to close
- Down payment
- $41,225
- Closing costs
- $4,947
- Reserves months
- —
- Total cash needed
- —
Loan-product check · same deal, 3 products live
Conventional
25% down · 7.5% · 30yr
- Down + closing
- —
- Monthly P&I
- —
- Monthly cashflow
- —
- DSCR
- —
- Eligible?
- —
Personal DTI + credit; lowest rate.
DSCR
20% down · 8.5% · 30yr
- Down + closing
- —
- Monthly P&I
- —
- Monthly cashflow
- —
- DSCR
- —
- Eligible?
- —
No personal income docs; deal must DSCR.
Hard money
10% down · 12.0% · 12mo
- Down + closing
- —
- Monthly P&I
- —
- Monthly cashflow
- —
- DSCR
- —
- Eligible?
- —
Short-term bridge; refi at stabilization.
Rent comps 40 comps
| Address | Beds | Baths | Sqft | Rent | $/sqft | DOM | Units | Dist |
|---|---|---|---|---|---|---|---|---|
| 3210 Caywood Dr NW Huntsville, AL | 3.0 | 1.0 | 1005 | $1,475 | $1.47 | 14d | 1 | 0.19mi |
| 3304 Caywood Dr NW Huntsville, AL | 3.0 | 1.5 | 1300 | $1,475 | $1.13 | 23d | 1 | 0.23mi |
| 3210 Tucker Dr NW Huntsville, AL | 3.0 | 1.0 | 1005 | $1,475 | $1.47 | 14d | 1 | 0.30mi |
| 3415 Mimosa Ln NW Huntsville, AL | 3.0 | 2.0 | 1320 | $1,590 | $1.20 | 44d | 1 | 0.31mi |
| 3100 Gayhart Dr NW Huntsville, AL | 3.0 | 1.0 | 1050 | $1,298 | $1.24 | 44d | 1 | 0.38mi |
| 2508 Piney Branch Rd NW Huntsville, AL | 3.0 | 1.5 | 1205 | $1,385 | $1.15 | 44d | 1 | 0.39mi |
| 3203 Dyas Dr NW Huntsville, AL | 3.0 | 2.0 | 1346 | $2,100 | $1.56 | 23d | 1 | 0.40mi |
| 2505 Piney Branch Rd NW Huntsville, AL | 3.0 | 1.5 | 1222 | $1,300 | $1.06 | 23d | 1 | 0.43mi |
| 3614 Wilbur Ave NW Huntsville, AL | 3.0 | 1.5 | 1196 | $1,420 | $1.19 | 23d | 1 | 0.46mi |
| 4700 Sparkman Dr NW Huntsville, AL | 3.0 | 1.5 | 1554 | $1,350 | $0.87 | 23d | 1 | 0.46mi |
| 3616 Hester Ln NW Huntsville, AL | 4.0 | 2.0 | 1650 | $1,350 | $0.82 | 44d | 1 | 0.48mi |
| 3423 Rosedale Dr NW Huntsville, AL | 3.0 | 1.0 | 1145 | $1,000 | $0.87 | 44d | 1 | 0.49mi |
| 3803 Mastin Lake Rd NW Huntsville, AL | 3.0 | 1.0 | 1103 | $1,295 | $1.17 | 44d | 1 | 0.49mi |
| 2215 Shady Lane Dr NW Huntsville, AL | 4.0 | 1.0 | 1450 | $1,500 | $1.03 | 44d | 1 | 0.58mi |
| 3306 Reynolds Dr NW Huntsville, AL | 3.0 | 2.0 | 1636 | $1,800 | $1.10 | 23d | 1 | 0.60mi |
| 3304 Buttrey Dr NW Huntsville, AL | 4.0 | 2.0 | 1656 | $1,681 | $1.02 | 23d | 1 | 0.67mi |
| 3309 Charleston Ave NW Huntsville, AL | 3.0 | 2.0 | 1425 | $1,375 | $0.96 | 21d | 1 | 0.68mi |
| 3505 Mastin Lake Rd NW Huntsville, AL | 3.0 | 2.0 | 1376 | $2,000 | $1.45 | 44d | 1 | 0.68mi |
| 3721 Broadmor Rd NW Huntsville, AL | 3.0 | 1.5 | 1423 | $1,450 | $1.02 | 44d | 1 | 0.70mi |
| 2201 Shady Lane Dr NW Huntsville, AL | 3.0 | 1.5 | 1472 | $3,000 | $2.04 | 44d | 1 | 0.71mi |
| 6008 Ellington Rd NW Huntsville, AL | 4.0 | 2.5 | 1845 | $1,595 | $0.86 | 44d | 1 | 0.72mi |
| 2613 Skyline Dr NW Huntsville, AL | 4.0 | 2.0 | 1572 | $1,695 | $1.08 | 23d | 1 | 0.75mi |
| 3303 Barton Ave NW Huntsville, AL | 3.0 | 2.0 | 1750 | $1,600 | $0.91 | 44d | 1 | 0.76mi |
| 4214 Fortson Ln NW Huntsville, AL | 3.0 | 2.0 | 1308 | $1,395 | $1.07 | 44d | 1 | 0.81mi |
| 3601 Fay St NW Huntsville, AL | 2.0 | 1.0 | 972 | $1,195 | $1.23 | 44d | 1 | 0.96mi |
| 4216 Chalet Cir NW Huntsville, AL | 3.0 | 2.0 | 1296 | $1,500 | $1.16 | 23d | 1 | 1.06mi |
| 2803 Hester Ln NW Huntsville, AL | 3.0 | 1.5 | 1224 | $1,400 | $1.14 | 23d | 1 | 1.07mi |
| 3406 Oakmont Ave NW Huntsville, AL | 3.0 | 2.0 | 1389 | $1,600 | $1.15 | 44d | 1 | 1.18mi |
| 2002 Laverne Dr NW Huntsville, AL | 3.0 | 1.5 | 1165 | $1,100 | $0.94 | 23d | 1 | 1.18mi |
| 2728 Clayton Dr NW Unit B Huntsville, AL | 2.0 | 1.0 | 900 | $795 | $0.88 | 44d | 1 | 1.24mi |
| 3708 Valleydale Rd NW Huntsville, AL | 3.0 | 1.5 | 1136 | $1,350 | $1.19 | 44d | 1 | 1.26mi |
| 3205 Lewisburg Dr NW Huntsville, AL | 3.0 | 2.0 | 1408 | $1,600 | $1.14 | 23d | 1 | 1.29mi |
| 2721 Clayton Dr NW Huntsville, AL | 3.0 | 1.0 | 1000 | $998 | $1.00 | 44d | 1 | 1.30mi |
| 4706 Whitehall Dr NW Huntsville, AL | 3.0 | 2.0 | 1469 | $1,550 | $1.06 | 21d | 1 | 1.32mi |
| 2711 Clayton Dr NW Huntsville, AL | 3.0 | 1.5 | 1030 | $1,400 | $1.36 | 44d | 1 | 1.37mi |
| 3706 Wilbanks Dr NW Huntsville, AL | 3.0 | 1.0 | 1000 | $1,300 | $1.30 | 44d | 1 | 1.38mi |
| 2706 Norton Ave NW Huntsville, AL | 3.0 | 2.0 | 1127 | $1,098 | $0.97 | 44d | 1 | 1.39mi |
| 2502 Hill St NW Huntsville, AL | 3.0 | 1.0 | 1288 | $1,200 | $0.93 | 44d | 1 | 1.39mi |
| 2708 Monticello Dr NW Huntsville, AL | 3.0 | 1.0 | 1025 | $1,300 | $1.27 | 23d | 1 | 1.45mi |
| 2708 Monticello Dr NW Huntsville, AL | 3.0 | 1.0 | 1025 | $1,350 | $1.32 | 44d | 1 | 1.45mi |
Listing history 15 events
-
2026-06-09status $164,900 Pending 144 DOM
-
2026-06-08days on market $164,900 Active 144 DOM
-
2026-06-07days on market $164,900 Active 143 DOM
-
2026-06-03days on market $164,900 Active 139 DOM
-
2026-06-02days on market $164,900 Active 138 DOM
-
2026-06-01status $164,900 Active 137 DOM
-
2026-04-28status Pending
-
2026-04-17price $164,900
-
2026-03-09price $169,900
-
2026-01-30price $174,900
-
2025-12-12$184,900 Active
-
2023-12-08soldstatus $2,040,000
-
2021-07-28soldstatus $135,000
-
2021-07-07$135,000 Active
-
2021-06-28soldstatus $110,000
ⓘ Source: listings_history table (triggers on properties + properties_extension) + one-shot
backfill from property_details.listing_events for pre-trigger history.
Tax reassessment forecast AL · Resets to sale price
- Current annual tax
- $1,028 · $86/mo
- Projected year-2 tax
- $1,028 · $86/mo
- Expected delta
- $0/yr ($0/mo · 0.0%)
ⓘ Screening estimate from a state-policy table — verify with the county assessor before closing.
Climate risk First Street
- Flood 1/10 Low FEMA zone X (unshaded) · 0% chance over 30 yrs
- Wildfire 1/10 Low
- Heat 5/10 Major 7 d/yr ≥105°F today · 19 d/yr by 30 yrs out
- Wind 4/10 Moderate 18% chance of damaging wind over 30 yrs
- Air quality 2/10 Low 1 unhealthy d/yr today · 1 by 30 yrs out
Nearby sold comps map
Loading sold comps map…
Walkable amenities ~0.75 mi
Loading nearby amenities…
Taxation est. · year 1
- Rental income
- $18,766
- − Mortgage interest
- −$9,237
- − Property taxes
- −$1,028
- − Insurance
- −$824
- − Repairs & maintenance
- −$1,501
- − Management
- −$1,501
- − Depreciation
- −$4,797
- Taxable loss
- −$123
- Est. tax savings @ 24.0%
- +$29
- After-tax cash flow
- $2,626/yr
For passive investors: Depreciation is non-cash, so a rental often shows a tax loss while cash-flowing — sheltering income. Rental losses are passive: they offset passive income freely, and up to $25,000/yr can offset ordinary (W-2) income if you actively participate and your MAGI is under $100k (phasing out to $0 by $150k); unused losses carry forward. On sale, claimed depreciation is recaptured at up to 25%, and gains may owe capital-gains tax (a 1031 exchange can defer both). Figures are a year-1 estimate at your 24.0% rate — not tax advice; consult a CPA.
Schools (NCES district)
- District
- Huntsville City
- NCES district ID
- 0101800
- Math proficiency
- 21% ▼ -23.00%
- Reading proficiency
- 46% ▬ 0.00%
- Median HH income
- $48,264
- Composite
- 28.84/100
- National rank
- #6647
- State rank
- #48 of 129 in AL
Livability — Huntsville
- Score
- 82/100
- State rank
- #3
- US rank
- #1082
Category grades
Schools grade is shown separately in the Schools card above.
Census & demographics
- Census place
- Huntsville, AL
- County
- Madison County · 380,832 people
- City population
- 220,435
- Metro
- Huntsville, AL
- Population (ZIP)
- 32,843
- Household income
- $51,233
- Rent vs Own
- Severe rent burden
- 1223.0
Population outlook (Madison County) Hauer SSP2
- Today (2025)
- 392,086 people
- By 2030
- 409,788 · +4.5%
- By 2040
- 440,557 · +12.4%
- By 2050
- 460,990 · +17.6%
- By 2075
- 502,872 · +28.3%
- By 2100
- 513,623 · +31.0%
Race, ethnicity, and origin ACS 2023
- Neighborhood character
- Predominantly Black (69%)
- Race & ethnicity
- Black 69% White 18% Hispanic / Latino 9% Two or more races 5%
- Hispanic origin (detail)
- Mexican 3% Puerto Rican 2% Dominican 2%
- Common ancestry
- Italian 2% Lithuanian 0%
- Foreign-born
- 6% · Canada
- Languages at home
- 92% English-only · Spanish 7%
Political lean MEDSL · Madison
- 2024 margin
- Lean R (+9.0) · D 44.7% · R 53.7% · Other 1.6%
- 2008→2024 swing
- +6.0pp toward D · 2008: -14.9pp · 2024: -9.0pp
- All cycles
- 2024: R+9.0 2020: R+8.0 2016: R+16.8 2012: R+18.7 2008: R+14.9
Not yet ingested
- Civics
- —
Market trends
- HPI YoY
- ▼ -61.00%
- Current HPI
- 198.9629
- Rent YoY
- ▬ -0.05%
- Metro
- Huntsville, AL
- State GDP YoY
- ▲ 2.94%
- F500 in state
- 4
Industry mix (Fortune 500 HQ in AL)
| Industry | F500 HQs | Revenue |
|---|---|---|
| Financial Services | 1 | $8B |
|
||
| Healthcare | 1 | $5B |
|
||
Price history
+49.9% since first listed9 events — show timeline
- 2026-04-28 Pending — VMLS
- 2026-04-17 Price Changed $164,900 VMLS
- 2026-03-09 Price Changed $169,900 VMLS
- 2026-01-30 Price Changed $174,900 VMLS
- 2025-12-12 Listed $184,900 VMLS
- 2023-12-08 Sold (Public Records) $2,040,000 Public Records
- 2021-07-28 Sold (Public Records) $135,000 Public Records
- 2021-07-07 Listed $135,000 VMLS
- 2021-06-28 Sold (Public Records) $110,000 Public Records
Property tax history
+16.2%/yrLatest (2024): $1,028 · +0.0% YoY. Source: county tax records.
Cash-flow waterfall
monthlySold comps — $/sqft
last 12 mo · ≤1 miLoading sold comps…