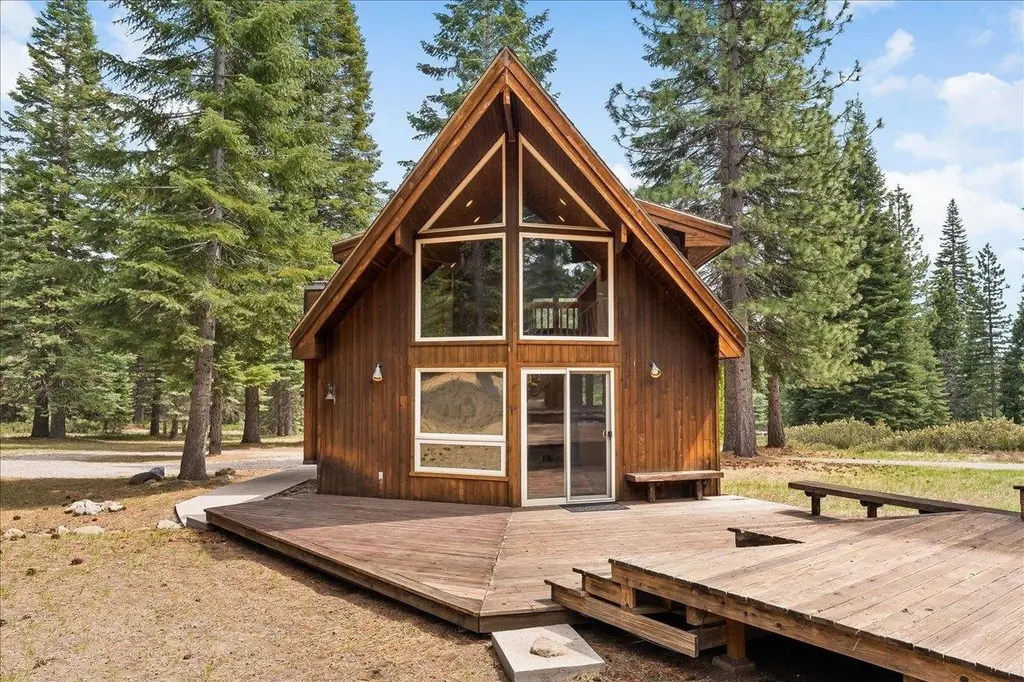
7819 Summit View Dr · McCloud, CA
Flood risk 1/10 · Minimal
- FEMA flood zone
- D
- Chance of flooding over 30 yrs
- 0.0%
- Est. flood insurance / yr
- $544 – $1,084
Fire risk 6/10 · Moderate
- Est. fire insurance / yr
- $659 – $1,223
Heat risk 3/10 · Minor
- Hot days now (above 91°F)
- 7 days/yr
- Hot days in 30 yrs
- 18 days/yr
Wind risk 1/10 · Minimal
- Chance of severe wind over 30 yrs
- —
Air-quality risk 10/10 · Severe
- Unhealthy air days now
- 30 days/yr
- Unhealthy air days in 30 yrs
- 31 days/yr
Risk factors via First Street. Map © Google.
Why this score? — see what drove the C grade
The composite is a weighted blend of 9 inputs, each scored 0–100. Each bar is that input's sub-score; the figure is the points it added to the 100-point composite (weight × sub-score).
- ARV discount +15.0/15.0
- Cash flow +14.5/30.0
- Appreciation +10.0/10.0
- DSCR +4.4/10.0
- Schools +3.6/10.0
- 1% rule +3.2/10.0
- Livability +3.0/5.0
- Rent growth +2.5/5.0
- Condition / age +2.5/5.0
$299,000
🖨 Deal sheet (PDF) 📄 Offer letter ✓ Due diligence
Listing remarks
$20,000 price improvement! Escape to this cozy off-grid 2 bed, 2 bath Lindal Cedar Homes cabin nestled in the serene Mt. Shasta Forest Subdivision. Set on a beautifully cleared and maintained 2.6-acre lot, this property offers peace, privacy, and mountain charm. The inviting cabin features soaring vaulted ceilings, a bright open floor plan, and tall gable windows that frame stunning views of the surrounding forest. Warm, rustic design elements blend with modern comforts. This property is set up perfectly with sustainability in mind featuring an energy system built around a solar array, with installation of a new inverter and Lithium Batteries in 2025 that combine with a high-quality and hi
Key facts
- Finished bonus room
- Expansive decks
- Solar array
Tags
Property features AI
Finance
- HOA & community: Located in the Mount Shasta Forest subdivision
Exterior
- Parking: 2-car garage
- Utilities: Private well water; Septic tank sewer; Propane service
- Home design: Single-family residence; Two-story
- Construction: Wood siding construction; Composition roof
- Exterior features: Deck; Lot roughly 224' x 477' (about 2.6 acres); Zoning: RRB
Interior
- Kitchen: Microwave; Electric range; Refrigerator
- Flooring: Carpet; Vinyl
- Interior features: Gas fireplace in the living room; Deck access from the home
Neighborhood map
What this means for you Summary
Snapshot
- This is a 2-bed/2.0-bath single-family listed at $299k.
Deal economics
- At list price, monthly cash flow is $67 ($806/yr) — positive.
- The deal already cash-flows at list — no discount required.
- To meet the 1% rule (rent ≥ 1% of price), the offer needs to be $247k (17.5% below list).
- Recommended offer: $247k (17.5% below list) — sets the bar for 1% rule.
Location & tenants
- Location reads 59/100 on livability (#636 in CA) — a working-class tenant base; expect higher turnover. Strengths: health & safety A+, housing B+; Watch: crime F, amenities F, commute F.
- Siskiyou Union High (rural): math 25% / reading 55% proficiency, ranked #763 of 1,400 in CA (top 54%) — families likely to look elsewhere, expect single-tenant / working-renter base with shorter leases; only 12% free/reduced lunch — higher-income household profile.
- Zoned schools: Mccloud Elementary (math 24% / reading 34%, grade F, #856 of 1,571 statewide, top 57%, 48 students, 79% FRL); Mccloud High (10 students, 50% FRL) — zoned schools average 65% FRL vs 12% district-wide (53 pts higher); higher-poverty schools than district average — tighter screening recommended.
- Market conditions: 135 active listings in the ZIP; 50 units permitted in Siskiyou County in 2024 (0 in 5+ unit buildings).
Forward outlook
- In year one you build about $32k of equity ($2k loan paydown + $30k appreciation (10.0% local appreciation)).
- Siskiyou County population projected at -26% by 2050 — secular population decline; favor cash flow + early exit over multi-decade hold.
- At projected returns (10.0% appreciation + 3.0% rent growth), your $84k cash investment doubles in ~3 years — after that, you're playing with house money.
- By year 2, paydown + projected appreciation supports a ~$51k cash-out refi (75% LTV) — recoverable capital for the next deal without selling this one.
Negotiation context
- It's been on market 60 days — a 3% lower offer ($290k) is reasonable based on typical stale-listing flexibility.
- Current owner paid $260k; 15% above their basis — modest negotiation headroom, anchor on the comps not their cost.
Risks & watch-outs
- Climate carrying-cost: major wildfire risk — expect insurance premiums to compound above CPI over the hold.
Questions for the listing agent
- It's been on market 60 days. Have you received any prior offers? Is the seller open to a 18% concession, seller financing, or rate buy-down credit?
- Is there a deadline driving the sale (1031 exchange, divorce, estate, relocation)? That informs how much negotiation room exists.
- Crime grade is F in this area — have there been break-ins, vandalism, or insurance claims at this property in the last 3 years? What carrier currently insures it and at what premium?
- What's the average days-on-market for RENTAL listings here right now (not sales)? A rising rental-DOM trend means longer vacancies and softer asking-rent achievability than the comps imply.
- What's the recent tenant-quality profile in this submarket — average credit score on applications, eviction rate, late-payment / NSF rate, and stable-employment percentage? A property-management company in the area should have these aggregated.
- How much new for-sale + rental construction is in the pipeline within 1–3 miles? Heavy new supply typically softens prices + rents 12–24 months out; constrained supply supports both.
Investment metrics
- 1% rule
- 0.82% ✗
- Cap rate
- 6.56%
- Cash-on-cash
- 0.96%
- DSCR
- 1.04
- GRM
- 10.1
CMA / ARV
- ARV (on-the-fly)
- $375,648
- Comps found
- 1
Show comp detail 1 sale within ~0.75 mi
| Address | Dist | Beds/Ba | Sqft | Sold | Price | $/sf | Match |
|---|---|---|---|---|---|---|---|
| 8075 Summit View Dr | 0.27mi | 2/1.0 | 1,087 (-0%) | 11mo | $374,000 | $344 | 74 |
Match score weights: distance 35% · size 25% · config 20% · recency 20%. Top-matched comps best support the ARV.
Projected returns pro-forma
10.0% appreciation · 3.0% rent growth · sell at horizon
- IRR
- 25.0%
- Equity multiple
- 3.00×
- Total profit
- $167,045
- Equity at exit
- $269,363
- IRR
- 22.0%
- Equity multiple
- 6.83×
- Total profit
- $488,404
- Equity at exit
- $580,891
Cash invested: $83,720 (down + closing). Projections, not guarantees.
Landlord ↔ Tenant lean methodology
- Overall (STATE)
- 18 Strongly Tenant-Friendly
- State California
- 18 Strongly Tenant-Friendly · D+13
- County
- — inherits STATE
- City
- — inherits STATE
ZIP-level market 96057
- Active inventory
- 135
- Price-to-rent
- 10.1×
Monthly cashflow live
- Estimated rent
- $2,466 medium interval (Pro) →
- Mortgage (P&I)
- −$1,568
- Tax from tax record
- −$188 /mo · $2,262/yr
- Insurance
- −$125
- HOA
- −$0
- Vacancy / Maint / Mgmt
- −$518
- Net cashflow
- $67
Break-even live
Sensitivity live
| Price | -10% $236 | -5% $152 | +0% $67 | +5% $-17 | +10% $-102 |
|---|---|---|---|---|---|
| Rent | -10% $-128 | -5% $-30 | +0% $67 | +5% $165 | +10% $262 |
| Rate | -1.0pp $218 | -0.5pp $143 | base $67 | +0.5pp $-10 | +1.0pp $-89 |
UW: 25.0% down · 7.5% · 30yr · 1.5% tax · 5.0% vac · 8.0% maint · 8.0% mgmt
Financing live
Cash to close
- Down payment
- $74,750
- Closing costs
- $8,970
- Reserves months
- —
- Total cash needed
- —
Loan-product check · same deal, 3 products live
Conventional
25% down · 7.5% · 30yr
- Down + closing
- —
- Monthly P&I
- —
- Monthly cashflow
- —
- DSCR
- —
- Eligible?
- —
Personal DTI + credit; lowest rate.
DSCR
20% down · 8.5% · 30yr
- Down + closing
- —
- Monthly P&I
- —
- Monthly cashflow
- —
- DSCR
- —
- Eligible?
- —
No personal income docs; deal must DSCR.
Hard money
10% down · 12.0% · 12mo
- Down + closing
- —
- Monthly P&I
- —
- Monthly cashflow
- —
- DSCR
- —
- Eligible?
- —
Short-term bridge; refi at stabilization.
Listing history 11 events
-
2026-06-07statusdays on market $299,000 Pending 60 DOM
-
2026-06-04days on market $299,000 Active 59 DOM
-
2026-06-02days on market $299,000 Active 58 DOM
-
2026-06-01days on market $299,000 Active 57 DOM
-
2026-05-31days on market $299,000 Active 56 DOM
-
2026-05-31days on market $299,000 Active 55 DOM
-
2026-05-16price $299,000
-
2026-04-05$319,000 Active
-
2025-08-24price $319,000
-
2025-06-06price $345,000
-
2005-06-28soldstatus $260,000
ⓘ Source: listings_history table (triggers on properties + properties_extension) + one-shot
backfill from property_details.listing_events for pre-trigger history.
Tax reassessment forecast CA · Resets to sale price
- Current annual tax
- $2,262 · $188/mo
- Projected year-2 tax
- $2,272 · $189/mo
- Expected delta
- +$11/yr (+$1/mo · 0.5%)
ⓘ Screening estimate from a state-policy table — verify with the county assessor before closing.
Climate risk First Street
- Flood 1/10 Low FEMA zone D · 0% chance over 30 yrs
- Wildfire 6/10 Major
- Heat 3/10 Moderate 7 d/yr ≥91°F today · 18 d/yr by 30 yrs out
- Wind 1/10 Low
- Air quality 10/10 Extreme 30 unhealthy d/yr today · 31 by 30 yrs out
Nearby sold comps map
Loading sold comps map…
Walkable amenities ~0.75 mi
Loading nearby amenities…
Taxation est. · year 1
- Rental income
- $29,593
- − Mortgage interest
- −$16,749
- − Property taxes
- −$2,262
- − Insurance
- −$1,495
- − Repairs & maintenance
- −$2,367
- − Management
- −$2,367
- − Depreciation
- −$8,698
- Taxable loss
- −$4,345
- Est. tax savings @ 24.0%
- +$1,043
- After-tax cash flow
- $1,849/yr
For passive investors: Depreciation is non-cash, so a rental often shows a tax loss while cash-flowing — sheltering income. Rental losses are passive: they offset passive income freely, and up to $25,000/yr can offset ordinary (W-2) income if you actively participate and your MAGI is under $100k (phasing out to $0 by $150k); unused losses carry forward. On sale, claimed depreciation is recaptured at up to 25%, and gains may owe capital-gains tax (a 1031 exchange can defer both). Figures are a year-1 estimate at your 24.0% rate — not tax advice; consult a CPA.
Schools (NCES district)
- District
- Siskiyou Union High
- NCES district ID
- 0636940
- Math proficiency
- 25% ▲ 5.00%
- Reading proficiency
- 55% ▲ 5.00%
- Median HH income
- $39,293
- Composite
- 35.84/100
- National rank
- #9605
- State rank
- #763 of 1400 in CA
Livability — McCloud
- Score
- 59/100
- State rank
- #636
- US rank
- #20040
Category grades
Schools grade is shown separately in the Schools card above.
Census & demographics
- Population (ZIP)
- 1,076
Population outlook (Siskiyou County) Hauer SSP2
- Today (2025)
- 39,337 people
- By 2030
- 36,930 · -6.1%
- By 2040
- 32,367 · -17.7%
- By 2050
- 29,030 · -26.2%
- By 2075
- 23,534 · -40.2%
- By 2100
- 19,312 · -50.9%
Race, ethnicity, and origin ACS 2023
- Neighborhood character
- Predominantly White (79%)
- Race & ethnicity
- White 79% Two or more races 13% Hispanic / Latino 6% Native American 3% Asian 1%
- Hispanic origin (detail)
- Mexican 5%
- Common ancestry
- Russian 6% Slovak 5% Lithuanian 3%
- Foreign-born
- 5% · Canada
- Languages at home
- 96% English-only · German/W. Germanic 1% Other Asian/Pacific 1% Spanish 1%
Political lean MEDSL · Siskiyou
- 2024 margin
- R (+19.2) · D 38.8% · R 58.0% · Other 3.2%
- 2008→2024 swing
- -8.8pp toward R · 2008: -10.4pp · 2024: -19.2pp
- All cycles
- 2024: R+19.2 2020: R+15.8 2016: R+20.7 2012: R+15.6 2008: R+10.4
Not yet ingested
- Civics
- —
Market trends
- HPI YoY
- ▲ 147.64%
- Current HPI
- 490.68
- Rent YoY
- —
- Metro
- —
- State GDP YoY
- ▲ 3.21%
- F500 in state
- 116
Industry mix (Fortune 500 HQ in CA)
| Industry | F500 HQs | Revenue |
|---|---|---|
| Technology | 27 | $1,492B |
|
||
| Financial Services | 3 | $174B |
|
||
| Retail | 3 | $44B |
|
||
| Insurance | 3 | $26B |
|
||
| Media / Entertainment | 2 | $115B |
|
||
| Pharmaceuticals / Biotech | 2 | $62B |
|
||
Price history
+15.0% since first listed5 events — show timeline
- 2026-05-16 Price Changed $299,000 SMLS
- 2026-04-05 Listed $319,000 SMLS
- 2025-08-24 Price Changed $319,000 SMLS
- 2025-06-06 Price Changed $345,000 SMLS
- 2005-06-28 Sold (Public Records) $260,000 Public Records
Property tax history
+1.0%/yrLatest (2025): $2,262 · -3.0% YoY. Source: county tax records.
Cash-flow waterfall
monthlySold comps — $/sqft
last 12 mo · ≤1 miLoading sold comps…