2265 Overlook Rd · Augusta-Richmond County consolidated government (balance), GA
Flood risk 1/10 · Minimal
- FEMA flood zone
- X (unshaded)
- Chance of flooding over 30 yrs
- 0.0%
- Est. flood insurance / yr
- $507 – $1,088
Fire risk 1/10 · Minimal
- Est. fire insurance / yr
- $963 – $1,789
Heat risk 8/10 · Major
- Hot days now (above 107°F)
- 7 days/yr
- Hot days in 30 yrs
- 17 days/yr
Wind risk 6/10 · Moderate
- Chance of severe wind over 30 yrs
- 68.0%
Air-quality risk 3/10 · Minor
- Unhealthy air days now
- 3 days/yr
- Unhealthy air days in 30 yrs
- 3 days/yr
Risk factors via First Street. Map © Google.
Why this score? — see what drove the C+ grade
The composite is a weighted blend of 9 inputs, each scored 0–100. Each bar is that input's sub-score; the figure is the points it added to the 100-point composite (weight × sub-score).
- Cash flow +25.0/30.0
- ARV discount +15.0/15.0
- DSCR +8.2/10.0
- 1% rule +5.6/10.0
- Livability +2.5/5.0
- Condition / age +2.5/5.0
- Rent growth +2.4/5.0
- Schools +1.3/10.0
- Appreciation +0.0/10.0
$125,000
🖨 Deal sheet (PDF) 📄 Offer letter ✓ Due diligence
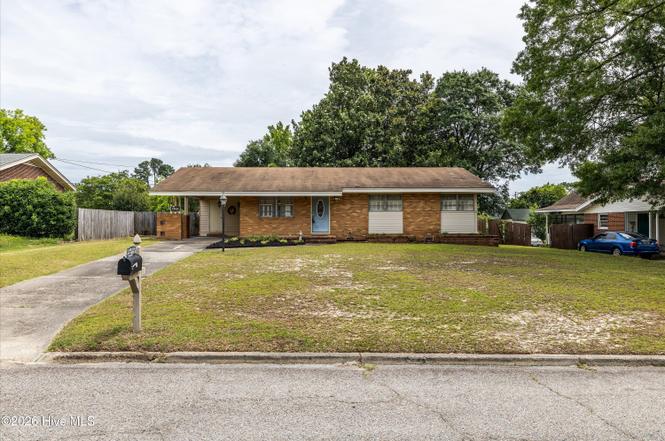
Listing remarks
Affordably priced with a pool!! Come take a look at this all-brick, one-story home just off Richmond Hill Road on the quiet streets of Richmond Park. This 3 bedroom, 1.5-bathroom home is priced well below market value to allow for buyer personalization. The home currently includes a rocking chair front porch, a covered carport, hardwood floors, a covered rear patio and a pool!! Enjoy the rest of the summer by staying cool in your fully fenced back yard. This is a unique opportunity for a value buy in today's market. Call to schedule your showing today!
Key facts
- Covered carport
- Covered rear patio
- Pool
Tags
Property features AI
Finance
- Other: Zoning: R3
Exterior
- Parking: Concrete parking
- Utilities: Utilities: Other
- Home design: Single-family residence; One story; Entry level: 1
- Construction: Brick construction; Composition roof; Crawl space foundation; Built (year not provided)
- Exterior features: Covered patio; Patio; Wood fencing; Has a view; City street and state road frontage
Interior
- Bathrooms: 1 full bathroom; 1 half bathroom
- Heating & cooling: Central air; Ceiling fans; Has heating (type: other)
- Interior features: Ceiling fans
- Laundry & utility: Gas water heater
Neighborhood map
What this means for you Summary
Snapshot
- This is a 3-bed/1.5-bath single-family listed at $125k.
Deal economics
- At list price, monthly cash flow is $273 ($3k/yr) — positive.
- The deal already cash-flows at list — no discount required.
- Meets the 1% rule at list price ($1k rent vs $125k).
- Cap rate 8.9% vs local median 5.3% in Augusta-Richmond County consolidated government (balance) — top-decile yield for the area; either an underpriced asset or a hidden risk that comps aren't pricing in. Stress-test before assuming the spread holds.
Location & tenants
- Location reads: area grade C — affects rentability + tenant quality, not the cash-flow math above.
- Richmond County (urban): math 12% / reading 20% proficiency, ranked #154 of 174 in GA (top 88%) — low school quality limits family demand, transient renter base, plan for 1-2y turnover; 72% free/reduced lunch — lower-income household profile, screen leases tightly.
- Zoned schools: Wheeless Road Elementary School (math 8% / reading 8%, grade F, #1,125 of 1,228 statewide, top 93%, 557 students, 98% FRL); Murphey Middle School (math 0% / reading 6%, grade F, #469 of 470 statewide, top 100%, 635 students, 98% FRL); Josey High School (math 2% / reading 5%, grade F, #413 of 424 statewide, top 99%, 779 students, 98% FRL) — zoned schools average 98% FRL vs 72% district-wide (26 pts higher); higher-poverty schools than district average — tighter screening recommended.
- Market conditions: Rents soft (-0.2%/yr); 369 active listings in the ZIP; 27 comparable units currently listed for rent nearby; rentals lingering (median 45d on market — plan ~5-8 weeks vacancy on turnover, expect pricing pressure); 56% of comp listings sitting > 30 days — soft ceiling on asking rent; 561 units permitted in Richmond County in 2024 (0 in 5+ unit buildings).
- This rent runs 35% of the median local income ($46k/yr) — at the standard rent-burdened threshold; future hikes will face affordability resistance.
Forward outlook
- Local home prices are declining (-3.0%/yr); year-one equity from $864 of loan paydown is wiped out by about $4k of value loss. Plan a longer hold.
- Richmond County population projected to shrink 5% by 2050 — rents likely to lag national; underwrite the cash flow, not the appreciation.
Negotiation context
- Only 4 days on market — expect competitive offers; lowballing is unlikely to land.
Risks & watch-outs
- Climate carrying-cost: major wind risk, 68% chance of damaging wind over 30y; extreme-heat days projected 7→17/yr by 2055 (HVAC capex compounding) — expect insurance premiums to compound above CPI over the hold.
Questions for the listing agent
- Built in 1960 — when were the roof, HVAC, electrical panel, plumbing, and water heater last replaced?
- Is there a deadline driving the sale (1031 exchange, divorce, estate, relocation)? That informs how much negotiation room exists.
- What's the average days-on-market for RENTAL listings here right now (not sales)? A rising rental-DOM trend means longer vacancies and softer asking-rent achievability than the comps imply.
- What's the recent tenant-quality profile in this submarket — average credit score on applications, eviction rate, late-payment / NSF rate, and stable-employment percentage? A property-management company in the area should have these aggregated.
- How much new for-sale + rental construction is in the pipeline within 1–3 miles? Heavy new supply typically softens prices + rents 12–24 months out; constrained supply supports both.
Investment metrics
- 1% rule
- 1.06% ✓
- Cap rate
- 8.91%
- Cash-on-cash
- 9.36%
- DSCR
- 1.42
- GRM
- 7.9
CMA / ARV
- ARV (on-the-fly)
- $151,800
- Comps found
- 12
Show comp detail 12 sales within ~0.75 mi
| Address | Dist | Beds/Ba | Sqft | Sold | Price | $/sf | Match |
|---|---|---|---|---|---|---|---|
| 2702 Richmond Hill Rd | 0.23mi | 3/1.5 | 1,403 (+2%) | 1mo | $151,000 | $108 | 86 |
| 2564 Richmond Hill Rd | 0.21mi | 3/2.0 | 1,462 (+6%) | 1mo | $79,900 | $55 | 78 |
| 2204 Sandra Ct | 0.24mi | 4/2.0 (+1) | 1,325 (-4%) | 2mo | $150,000 | $113 | 73 |
| 2261 Overlook Rd | 0.03mi | 3/2.0 | 1,576 (+14%) | 6mo | $140,000 | $89 | 68 |
| 2380 Franklin St | 0.58mi | 3/2.0 | 1,341 (-3%) | 8mo | $170,000 | $127 | 59 |
| 2140 Richards Rd | 0.42mi | 3/2.0 | 1,260 (-9%) | 6mo | $158,000 | $125 | 58 |
| 2815 Anne St | 0.51mi | 3/1.0 | 1,273 (-8%) | 4mo | $114,900 | $90 | 58 |
| 2222 Killebrew Ave | 0.66mi | 2/2.0 (-1) | 1,382 (+0%) | 7mo | $37,000 | $27 | 56 |
| 2306 Overlook Rd | 0.21mi | 4/2.0 (+1) | 1,550 (+12%) | 9mo | $189,000 | $122 | 55 |
| 2529 Norton Boulevard Blvd | 0.57mi | 3/2.0 | 1,200 (-13%) | 2mo | $175,000 | $146 | 48 |
| 2209 Bandler Rd | 0.37mi | 2/1.0 (-1) | 1,184 (-14%) | 6mo | $130,000 | $110 | 47 |
| 2933 Deans Bridge Rd Rd | 0.75mi | 3/1.0 | 1,582 (+15%) | 9mo | $165,000 | $104 | 32 |
Match score weights: distance 35% · size 25% · config 20% · recency 20%. Top-matched comps best support the ARV.
Projected returns pro-forma
-3.0% appreciation · 0.0% rent growth · sell at horizon
- IRR
- -5.4%
- Equity multiple
- 0.81×
- Total profit
- $-6,795
- Equity at exit
- $18,638
- IRR
- 0.6%
- Equity multiple
- 1.04×
- Total profit
- $1,300
- Equity at exit
- $10,808
Cash invested: $35,000 (down + closing). Projections, not guarantees.
Landlord ↔ Tenant lean methodology
- Overall (STATE)
- 90 Strongly Landlord-Friendly
- State Georgia
- 90 Strongly Landlord-Friendly · R+3
- County
- — inherits STATE
- City
- — inherits STATE
ZIP-level market 30906
- Home prices YoY
- -21.6%
- Rents YoY
- -0.2%
- Active inventory
- 369
- Price-to-rent
- 7.9×
Monthly cashflow live
- Estimated rent
- $1,327 high interval (Pro) →
- Mortgage (P&I)
- −$656
- Tax from tax record
- −$67 /mo · $810/yr
- Insurance
- −$52
- HOA
- −$0
- Vacancy / Maint / Mgmt
- −$279
- Net cashflow
- $273
Break-even live
Sensitivity live
| Price | -10% $344 | -5% $308 | +0% $273 | +5% $238 | +10% $202 |
|---|---|---|---|---|---|
| Rent | -10% $168 | -5% $221 | +0% $273 | +5% $325 | +10% $378 |
| Rate | -1.0pp $336 | -0.5pp $305 | base $273 | +0.5pp $241 | +1.0pp $208 |
UW: 25.0% down · 7.5% · 30yr · 1.5% tax · 5.0% vac · 8.0% maint · 8.0% mgmt
Financing live
Cash to close
- Down payment
- $31,250
- Closing costs
- $3,750
- Reserves months
- —
- Total cash needed
- —
Loan-product check · same deal, 3 products live
Conventional
25% down · 7.5% · 30yr
- Down + closing
- —
- Monthly P&I
- —
- Monthly cashflow
- —
- DSCR
- —
- Eligible?
- —
Personal DTI + credit; lowest rate.
DSCR
20% down · 8.5% · 30yr
- Down + closing
- —
- Monthly P&I
- —
- Monthly cashflow
- —
- DSCR
- —
- Eligible?
- —
No personal income docs; deal must DSCR.
Hard money
10% down · 12.0% · 12mo
- Down + closing
- —
- Monthly P&I
- —
- Monthly cashflow
- —
- DSCR
- —
- Eligible?
- —
Short-term bridge; refi at stabilization.
Rent comps 27 comps
| Address | Beds | Baths | Sqft | Rent | $/sqft | DOM | Units | Dist |
|---|---|---|---|---|---|---|---|---|
| 2204 Sandra Ct Augusta, GA | 4.0 | 2.0 | 1325 | $1,585 | $1.20 | 25d | 1 | 0.21mi |
| 2605 Shalimar Dr Augusta, GA | 4.0 | 2.0 | 1444 | $1,500 | $1.04 | 22d | 1 | 0.23mi |
| 2119 Lumpkin Rd Augusta, GA | 2.0 | 1.0–1.5 | 974 | $912 | $0.94 | 22d | 6 | 0.59mi |
| 2910 Richmond Hill Rd Augusta, GA | 2.0 | 1.0 | 1000 | $900 | $0.90 | 45d | 3 | 0.67mi |
| 2851 Rocky Creek Rd Augusta, GA | 2.0 | 1.0 | 1171 | $1,100 | $0.94 | 45d | 1 | 0.73mi |
| 2851 Rocky Creek Rd Augusta, GA | 2.0 | 1.0 | 1171 | $1,100 | $0.94 | 25d | 1 | 0.73mi |
| 2816 Thomas Ln Augusta, GA | 2.0 | 2.0 | 960 | $950 | $0.99 | 15d | 1 | 0.73mi |
| 2820 Thomas Ln Augusta, GA | 2.0 | 2.0 | 960 | $950 | $0.99 | 45d | 1 | 0.73mi |
| 2824 Thomas Ln Augusta, GA | 2.0 | 2.0 | 960 | $950 | $0.99 | 45d | 1 | 0.73mi |
| 2826 Thomas Ln Augusta, GA | 2.0 | 1.0 | 1456 | $1,095 | $0.75 | 45d | 1 | 0.74mi |
| 2826 Thomas Ln Augusta, GA | 2.0 | 1.0 | 1456 | $1,095 | $0.75 | 25d | 1 | 0.74mi |
| 2810 Thomas Ln Augusta, GA | 2.0 | 2.0 | 1030 | $975 | $0.95 | 45d | 6 | 0.74mi |
| 2205 Southgate Dr Augusta, GA | 1.0–2.0 | 1.0–1.5 | 770 | $1,099 | $1.43 | 15d | 7 | 0.75mi |
| 2663 Thomas Ln Augusta, GA | 2.0–3.0 | 2.0–2.5 | 1250 | $1,446 | $1.16 | 25d | 3 | 0.77mi |
| 2818 Gordy Rd Augusta, GA | 2.0 | 1.0 | 888 | $825 | $0.93 | 45d | 1 | 0.80mi |
| 2484 Coleman Ave Augusta, GA | 4.0 | 1.0 | 1662 | $1,000 | $0.60 | 45d | 1 | 0.95mi |
| 3018 Acorn Rd Augusta, GA | 2.0 | 1.0 | 962 | $1,115 | $1.16 | 25d | 1 | 0.95mi |
| 2544 Dover St Unit 2544 Augusta, GA | 3.0 | 1.0 | 888 | $900 | $1.01 | 45d | 1 | 0.96mi |
| 2020 Garr Dr Augusta, GA | 3.0 | 1.0 | 1100 | $1,200 | $1.09 | 15d | 1 | 1.05mi |
| 2021 Fernwood Cir Augusta, GA | 4.0 | 2.0 | 1593 | $1,525 | $0.96 | 45d | 1 | 1.08mi |
| 3012 Pinewood Dr Augusta, GA | 3.0 | 2.0 | 1465 | $1,100 | $0.75 | 45d | 1 | 1.16mi |
| 1822 Catalina Dr Augusta, GA | 3.0 | 1.0 | 888 | $1,350 | $1.52 | 25d | 1 | 1.33mi |
| 1822 Catalina Dr Augusta, GA | 3.0 | 1.0 | 888 | $1,350 | $1.52 | 45d | 1 | 1.33mi |
| 2401 Norfolk St Augusta, GA | 2.0 | 1.0 | 991 | $949 | $0.96 | 45d | 1 | 1.38mi |
| 3211 Kevin Dr Augusta, GA | 3.0 | 1.5 | 1005 | $1,275 | $1.27 | 45d | 1 | 1.47mi |
| 3211 Kevin Dr Augusta, GA | 3.0 | 1.5 | 1005 | $1,275 | $1.27 | 25d | 1 | 1.47mi |
| 2932 Abelia Dr Augusta, GA | 3.0 | 1.0 | 888 | $1,100 | $1.24 | 45d | 1 | 1.47mi |
Listing history 3 events
-
2026-06-21days on market $125,000 Active 4 DOM
-
2026-06-17remarks 558-char remark
-
2026-06-17$125,000 Active 1 DOM
ⓘ Source: listings_history table (triggers on properties + properties_extension) + one-shot
backfill from property_details.listing_events for pre-trigger history.
Tax reassessment forecast GA · Resets to sale price
- Current annual tax
- $810 · $67/mo
- Projected year-2 tax
- $1,150 · $96/mo
- Expected delta
- +$340/yr (+$28/mo · 42.0%)
ⓘ Screening estimate from a state-policy table — verify with the county assessor before closing.
Climate risk First Street
- Flood 1/10 Low FEMA zone X (unshaded) · 0% chance over 30 yrs
- Wildfire 1/10 Low
- Heat 8/10 Severe 7 d/yr ≥107°F today · 17 d/yr by 30 yrs out
- Wind 6/10 Major 68% chance of damaging wind over 30 yrs
- Air quality 3/10 Moderate 3 unhealthy d/yr today · 3 by 30 yrs out
Nearby sold comps map
Loading sold comps map…
Walkable amenities ~0.75 mi
Loading nearby amenities…
Taxation est. · year 1
- Rental income
- $15,919
- − Mortgage interest
- −$7,002
- − Property taxes
- −$810
- − Insurance
- −$625
- − Repairs & maintenance
- −$1,274
- − Management
- −$1,274
- − Depreciation
- −$3,636
- Taxable income
- $1,299
- Est. tax owed @ 24.0%
- −$312
- After-tax cash flow
- $2,963/yr
For passive investors: Depreciation is non-cash, so a rental often shows a tax loss while cash-flowing — sheltering income. Rental losses are passive: they offset passive income freely, and up to $25,000/yr can offset ordinary (W-2) income if you actively participate and your MAGI is under $100k (phasing out to $0 by $150k); unused losses carry forward. On sale, claimed depreciation is recaptured at up to 25%, and gains may owe capital-gains tax (a 1031 exchange can defer both). Figures are a year-1 estimate at your 24.0% rate — not tax advice; consult a CPA.
Schools (NCES district)
- District
- Richmond County
- NCES district ID
- 1304380
- Math proficiency
- 12% ▼ -9.00%
- Reading proficiency
- 20% ▼ -6.00%
- Median HH income
- $38,069
- Composite
- 13.43/100
- National rank
- #9524
- State rank
- #154 of 174 in GA
Livability — Augusta-Richmond County consolidated government (balance)
No livability data for this city. (Only ~50 U.S. cities are tracked.)
Census & demographics
- Census place
- Augusta-Richmond County consolidated government (balance), GA
- County
- Richmond County · 190,917 people
- City population
- 154,035
- Metro
- Augusta-Richmond County, GA-SC
- Population (ZIP)
- 60,423
- Household income
- $45,999
- Rent vs Own
- Severe rent burden
- 3363.0
Population outlook (Richmond County) Hauer SSP2
- Today (2025)
- 200,753 people
- By 2030
- 200,232 · -0.3%
- By 2040
- 196,813 · -2.0%
- By 2050
- 190,347 · -5.2%
- By 2075
- 172,496 · -14.1%
- By 2100
- 146,284 · -27.1%
Race, ethnicity, and origin ACS 2023
- Neighborhood character
- Majority Black (64%)
- Race & ethnicity
- Black 64% White 27% Two or more races 5% Hispanic / Latino 5%
- Common ancestry
- Lithuanian 1%
- Foreign-born
- 2% · Canada
- Languages at home
- 95% English-only · Spanish 3% German/W. Germanic 1%
Political lean MEDSL · Richmond
- 2024 margin
- Solid D (+36.1) · D 67.8% · R 31.7%
- 2008→2024 swing
- +4.3pp toward D · 2008: 31.8pp · 2024: 36.1pp
- All cycles
- 2024: D+36.1 2020: D+37.2 2016: D+32.4 2012: D+33.8 2008: D+31.8
Not yet ingested
- Civics
- —
Market trends
- HPI YoY
- ▼ -58.99%
- Current HPI
- 213.5733
- Rent YoY
- ▼ -0.25%
- Metro
- Augusta-Richmond County, GA-SC
- State GDP YoY
- ▲ 2.66%
- F500 in state
- 28
Industry mix (Fortune 500 HQ in GA)
| Industry | F500 HQs | Revenue |
|---|---|---|
| Paper / Packaging | 2 | $29B |
|
||
| Retail | 1 | $160B |
|
||
| Transportation / Logistics | 1 | $91B |
|
||
| Airlines | 1 | $62B |
|
||
| Consumer Goods | 1 | $47B |
|
||
| Utilities | 1 | $25B |
|
||
Price history
1 event — show timeline
- 2026-06-17 Listed $125,000 Hive MLS
Property tax history
+2.0%/yrLatest (2025): $810 · +6.5% YoY. Source: county tax records.
Cash-flow waterfall
monthlySold comps — $/sqft
last 12 mo · ≤1 miLoading sold comps…