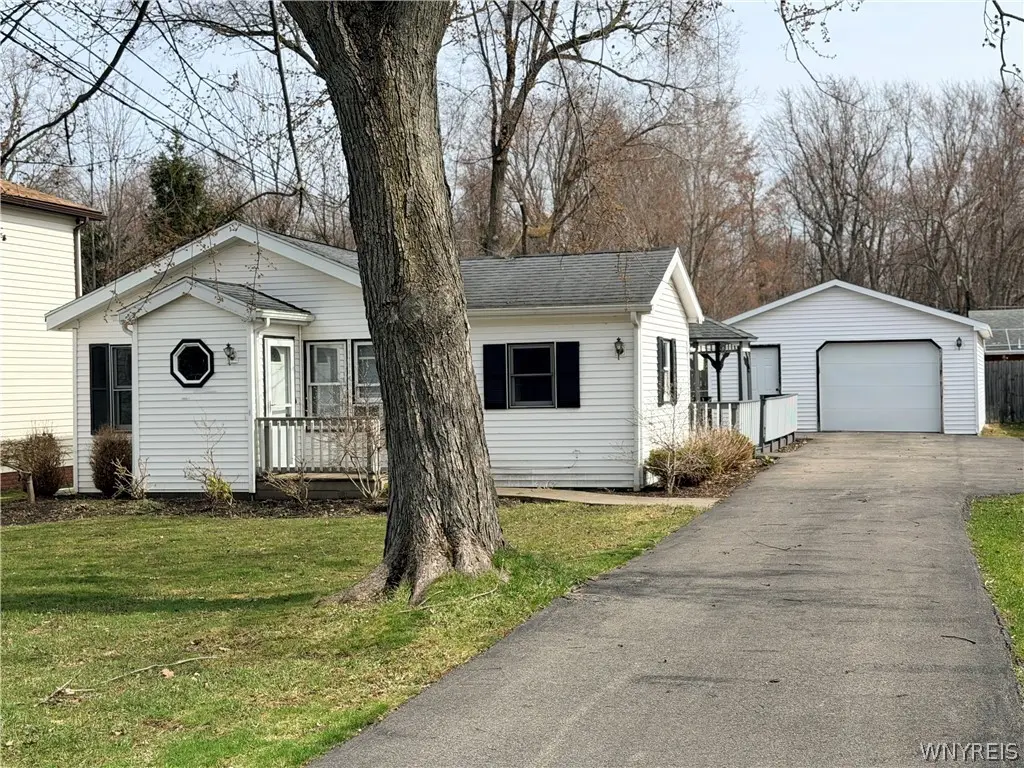
5893 Lakeview Ter · Wanakah, NY
Flood risk 3/10 · Minor
- FEMA flood zone
- X (unshaded)
- Chance of flooding over 30 yrs
- 0.2%
- Est. flood insurance / yr
- $473 – $860
Fire risk 2/10 · Minimal
- Est. fire insurance / yr
- $691 – $1,283
Heat risk 2/10 · Minimal
- Hot days now (above 93°F)
- 7 days/yr
- Hot days in 30 yrs
- 16 days/yr
Wind risk 1/10 · Minimal
- Chance of severe wind over 30 yrs
- —
Air-quality risk 2/10 · Minimal
- Unhealthy air days now
- 1 days/yr
- Unhealthy air days in 30 yrs
- 2 days/yr
Risk factors via First Street. Map © Google.
Why this score? — see what drove the C grade
The composite is a weighted blend of 9 inputs, each scored 0–100. Each bar is that input's sub-score; the figure is the points it added to the 100-point composite (weight × sub-score).
- Cash flow +19.8/30.0
- ARV discount +15.0/15.0
- DSCR +6.3/10.0
- 1% rule +5.6/10.0
- Schools +4.7/10.0
- Livability +3.5/5.0
- Rent growth +2.5/5.0
- Condition / age +2.5/5.0
- Appreciation +0.0/10.0
$174,900
🖨 Deal sheet (PDF) 📄 Offer letter ✓ Due diligence
Listing remarks MLS
Free home warranty included. Located near the lake! Open floor plan. Freshly painted throughout. Kitchen features updated oak cabinets, ceramic backsplash, lovely side addition to kitchen area is "sun filled" provided by sliding patio doors that go onto large deck. Attractive laminate flooring in living room. Yard is fenced in, electric pet fencing too! Vinyl - slided!
Key facts
- Private backyard
- Large two car garage
- Scenic views
Tags
Neighborhood map
What this means for you Summary
Snapshot
- This is a 3-bed/1.0-bath single-family listed at $175k.
Deal economics
- At list price, monthly cash flow is $209 ($3k/yr) — positive.
- The deal already cash-flows at list — no discount required.
- Meets the 1% rule at list price ($2k rent vs $175k).
- Cap rate 7.7% vs local median 3.1% in Wanakah — top-decile yield for the area; either an underpriced asset or a hidden risk that comps aren't pricing in. Stress-test before assuming the spread holds.
Location & tenants
- Location reads 69/100 on livability (#508 in NY) — a middle-class / working-renter tenant base. Strengths: employment A+, housing A+, crime B+; Watch: amenities F, commute F, health & safety F.
- Frontier Central School District (suburban): math 54% / reading 55% proficiency, ranked #301 of 590 in NY (top 51%) — acceptable for families but not a draw, mixed tenant base, ~2y average lease; only 20% free/reduced lunch — higher-income household profile.
- Zoned schools: Pinehurst Elementary School (math 58% / reading 56%, grade C+, #842 of 2,108 statewide, top 43%, 583 students, 14% FRL); Frontier Middle School (math 38% / reading 53%, grade D+, #337 of 729 statewide, top 47%, 1,071 students, 34% FRL); Frontier Senior High School (math 97% / reading 95%, grade A+, #68 of 1,100 statewide, top 6%, 1,352 students, 31% FRL).
- Market conditions: 49 active listings in the ZIP; 1 comparable units currently listed for rent nearby; 1,244 units permitted in Erie County in 2024 (563 in 5+ unit buildings).
Forward outlook
- Local home prices are declining (-3.0%/yr); year-one equity from $1k of loan paydown is wiped out by about $5k of value loss. Plan a longer hold.
Negotiation context
- Only 6 days on market — expect competitive offers; lowballing is unlikely to land.
- 2 sale attempts since 15y ago with the ask held roughly flat each time — persistent listings suggest the price (not the market) is what's stuck; bring a comps-based counter.
- Current owner paid $87k; list at $175k implies a 101% gain — meaningful room to come down on a strong offer.
Risks & watch-outs
- Watch-outs: built in 1957 — expect roof / HVAC / electrical / plumbing capex.
Questions for the listing agent
- Built in 1957 — when were the roof, HVAC, electrical panel, plumbing, and water heater last replaced?
- Is there a deadline driving the sale (1031 exchange, divorce, estate, relocation)? That informs how much negotiation room exists.
- What's the average days-on-market for RENTAL listings here right now (not sales)? A rising rental-DOM trend means longer vacancies and softer asking-rent achievability than the comps imply.
- What's the recent tenant-quality profile in this submarket — average credit score on applications, eviction rate, late-payment / NSF rate, and stable-employment percentage? A property-management company in the area should have these aggregated.
- How much new for-sale + rental construction is in the pipeline within 1–3 miles? Heavy new supply typically softens prices + rents 12–24 months out; constrained supply supports both.
Investment metrics
- 1% rule
- 1.06% ✓
- Cap rate
- 7.73%
- Cash-on-cash
- 5.13%
- DSCR
- 1.23
- GRM
- 7.9
CMA / ARV
- ARV (on-the-fly)
- $212,520
- Comps found
- 11
Show comp detail 11 sales within ~0.75 mi
| Address | Dist | Beds/Ba | Sqft | Sold | Price | $/sf | Match |
|---|---|---|---|---|---|---|---|
| 5893 Lakeview Ter | 0.00mi | 3/1.0 | 1,012 (0%) | 1mo | $195,000 | $193 | 99 |
| 5829 Lakeview Ter | 0.13mi | 2/1.0 (-1) | 1,050 (+4%) | 4mo | $180,000 | $171 | 80 |
| 5928 Elmhurst Rd | 0.18mi | 3/1.0 | 960 (-5%) | 12mo | $242,000 | $252 | 73 |
| 5944 Lakeview | 0.11mi | 3/1.0 | 1,152 (+14%) | 1mo | $200,000 | $174 | 71 |
| 5742 Lakeview Ter | 0.28mi | 3/1.0 | 1,106 (+9%) | 6mo | $227,000 | $205 | 66 |
| 6099 Dover Rd | 0.46mi | 3/1.0 | 960 (-5%) | 10mo | $271,500 | $283 | 62 |
| 5919 Dover Rd | 0.12mi | 2/1.0 (-1) | 1,096 (+8%) | 18mo | $230,000 | $210 | 61 |
| 5815 Elmhurst Rd | 0.20mi | 3/1.0 | 1,080 (+7%) | 23mo | $125,000 | $116 | 60 |
| 6078 Versailles Rd | 0.51mi | 3/1.0 | 1,100 (+9%) | 12mo | $240,000 | $218 | 52 |
| 2158 Ganymede Ln | 0.57mi | 3/2.0 | 1,040 (+3%) | 22mo | $226,500 | $218 | 46 |
| 5835 West Ln | 0.37mi | 2/2.0 (-1) | 1,129 (+12%) | 15mo | $249,900 | $221 | 42 |
Match score weights: distance 35% · size 25% · config 20% · recency 20%. Top-matched comps best support the ARV.
Projected returns pro-forma
-3.0% appreciation · 3.0% rent growth · sell at horizon
- IRR
- -8.3%
- Equity multiple
- 0.69×
- Total profit
- $-14,944
- Equity at exit
- $26,078
- IRR
- 1.3%
- Equity multiple
- 1.09×
- Total profit
- $4,389
- Equity at exit
- $15,122
Cash invested: $48,972 (down + closing). Projections, not guarantees.
Landlord ↔ Tenant lean methodology
- Overall (STATE)
- 15 Strongly Tenant-Friendly
- State New York
- 15 Strongly Tenant-Friendly · D+10
- County
- — inherits STATE
- City
- — inherits STATE
ZIP-level market 14085
- Home prices YoY
- -18.0%
- Active inventory
- 49
- Price-to-rent
- 7.9×
Monthly cashflow live
- Estimated rent
- $1,850 medium interval (Pro) →
- Mortgage (P&I)
- −$917
- Tax from tax record
- −$262 /mo · $3,143/yr
- Insurance
- −$73
- HOA
- −$0
- Vacancy / Maint / Mgmt
- −$388
- Net cashflow
- $209
Break-even live
Sensitivity live
| Price | -10% $308 | -5% $259 | +0% $209 | +5% $160 | +10% $110 |
|---|---|---|---|---|---|
| Rent | -10% $63 | -5% $136 | +0% $209 | +5% $283 | +10% $356 |
| Rate | -1.0pp $298 | -0.5pp $254 | base $209 | +0.5pp $164 | +1.0pp $118 |
UW: 25.0% down · 7.5% · 30yr · 1.5% tax · 5.0% vac · 8.0% maint · 8.0% mgmt
Financing live
Cash to close
- Down payment
- $43,725
- Closing costs
- $5,247
- Reserves months
- —
- Total cash needed
- —
Loan-product check · same deal, 3 products live
Conventional
25% down · 7.5% · 30yr
- Down + closing
- —
- Monthly P&I
- —
- Monthly cashflow
- —
- DSCR
- —
- Eligible?
- —
Personal DTI + credit; lowest rate.
DSCR
20% down · 8.5% · 30yr
- Down + closing
- —
- Monthly P&I
- —
- Monthly cashflow
- —
- DSCR
- —
- Eligible?
- —
No personal income docs; deal must DSCR.
Hard money
10% down · 12.0% · 12mo
- Down + closing
- —
- Monthly P&I
- —
- Monthly cashflow
- —
- DSCR
- —
- Eligible?
- —
Short-term bridge; refi at stabilization.
Rent comps 1 comps
| Address | Beds | Baths | Sqft | Rent | $/sqft | DOM | Units | Dist |
|---|---|---|---|---|---|---|---|---|
| 5836 East Ln Lake View, NY | 3.0 | 2.0 | 1300 | $1,850 | $1.42 | 45d | 1 | 0.37mi |
Listing history 5 events
-
2026-03-25status Pending
-
2026-03-19$174,900 Active
-
2011-11-23soldstatus $86,900 381-char remark
Show marketing remark (381 chars)
Free home warranty included. Located near the lake! Open floor plan. Freshly painted throughout. Kitchen features updated oak cabinets, ceramic backsplash, lovely side addition to kitchen area is "sun filled" provided by sliding patio doors that go onto large deck. Attractive laminate flooring in living room. Yard is fenced in, electric pet fencing too! Vinyl - slided!
-
2011-11-23soldstatus $86,900
Show marketing remark (381 chars)
Free home warranty included. Located near the lake! Open floor plan. Freshly painted throughout. Kitchen features updated oak cabinets, ceramic backsplash, lovely side addition to kitchen area is "sun filled" provided by sliding patio doors that go onto large deck. Attractive laminate flooring in living room. Yard is fenced in, electric pet fencing too! Vinyl - slided!
-
2011-03-22$89,900 381-char remark
Show marketing remark (381 chars)
Free home warranty included. Located near the lake! Open floor plan. Freshly painted throughout. Kitchen features updated oak cabinets, ceramic backsplash, lovely side addition to kitchen area is "sun filled" provided by sliding patio doors that go onto large deck. Attractive laminate flooring in living room. Yard is fenced in, electric pet fencing too! Vinyl - slided!
ⓘ Source: listings_history table (triggers on properties + properties_extension) + one-shot
backfill from property_details.listing_events for pre-trigger history.
Tax reassessment forecast NY · Partial reset (capped growth)
- Current annual tax
- $3,143 · $262/mo
- Projected year-2 tax
- $3,143 · $262/mo
- Expected delta
- $0/yr ($0/mo · 0.0%)
ⓘ Screening estimate from a state-policy table — verify with the county assessor before closing.
Climate risk First Street
- Flood 3/10 Moderate FEMA zone X (unshaded) · 20% chance over 30 yrs
- Wildfire 2/10 Low
- Heat 2/10 Low 7 d/yr ≥93°F today · 16 d/yr by 30 yrs out
- Wind 1/10 Low
- Air quality 2/10 Low 1 unhealthy d/yr today · 2 by 30 yrs out
Nearby sold comps map
Loading sold comps map…
Walkable amenities ~0.75 mi
Loading nearby amenities…
Taxation est. · year 1
- Rental income
- $22,200
- − Mortgage interest
- −$9,797
- − Property taxes
- −$3,143
- − Insurance
- −$874
- − Repairs & maintenance
- −$1,776
- − Management
- −$1,776
- − Depreciation
- −$5,088
- Taxable loss
- −$255
- Est. tax savings @ 24.0%
- +$61
- After-tax cash flow
- $2,575/yr
For passive investors: Depreciation is non-cash, so a rental often shows a tax loss while cash-flowing — sheltering income. Rental losses are passive: they offset passive income freely, and up to $25,000/yr can offset ordinary (W-2) income if you actively participate and your MAGI is under $100k (phasing out to $0 by $150k); unused losses carry forward. On sale, claimed depreciation is recaptured at up to 25%, and gains may owe capital-gains tax (a 1031 exchange can defer both). Figures are a year-1 estimate at your 24.0% rate — not tax advice; consult a CPA.
Schools (NCES district)
- District
- Frontier Central School District
- NCES district ID
- 3611670
- Math proficiency
- 54% ▼ -16.00%
- Reading proficiency
- 55% ▼ -10.00%
- Median HH income
- $58,807
- Composite
- 47.36/100
- National rank
- #2291
- State rank
- #301 of 590 in NY
Livability — Wanakah
- Score
- 69/100
- State rank
- #508
- US rank
- #8972
Category grades
Schools grade is shown separately in the Schools card above.
Census & demographics
- Population (ZIP)
- 8,439
Population outlook (Erie County) Hauer SSP2
- Today (2025)
- 933,037 people
- By 2030
- 935,181 · +0.2%
- By 2040
- 928,531 · -0.5%
- By 2050
- 905,725 · -2.9%
- By 2075
- 834,037 · -10.6%
- By 2100
- 708,033 · -24.1%
Race, ethnicity, and origin ACS 2023
- Neighborhood character
- Predominantly White (93%)
- Race & ethnicity
- White 93% Two or more races 5% Hispanic / Latino 2%
- Common ancestry
- Romanian 28% Slovak 2% Italian 2%
- Foreign-born
- 2% · Canada, China
- Languages at home
- 98% English-only · Spanish 1%
Political lean MEDSL · Erie
- 2024 margin
- Lean D (+9.7) · D 54.8% · R 45.2%
- 2008→2024 swing
- -7.9pp toward R · 2008: 17.5pp · 2024: 9.7pp
- All cycles
- 2024: D+9.7 2020: D+14.7 2016: D+4.8 2012: D+15.6 2008: D+17.5
Not yet ingested
- Civics
- —
Market trends
- HPI YoY
- ▼ -72.78%
- Current HPI
- 331.7429
- Rent YoY
- —
- Metro
- —
- State GDP YoY
- ▲ 2.60%
- F500 in state
- 92
Industry mix (Fortune 500 HQ in NY)
| Industry | F500 HQs | Revenue |
|---|---|---|
| Financial Services | 10 | $950B |
|
||
| Consumer Goods | 9 | $162B |
|
||
| Insurance | 4 | $225B |
|
||
| Telecommunications | 2 | $144B |
|
||
| Pharmaceuticals | 2 | $112B |
|
||
| Media / Entertainment | 2 | $69B |
|
||
Price history
+94.5% since first listed5 events — show timeline
- 2026-03-25 Pending — WNYREIS
- 2026-03-19 Listed $174,900 WNYREIS
- 2011-11-23 Sold (Public Records) $86,900 Public Records
- 2011-11-23 Sold (MLS) $86,900 WNYREIS
- 2011-03-22 Listed $89,900 WNYREIS
Property tax history
+6.2%/yrLatest (2025): $3,143 · +0.5% YoY. Source: county tax records.
Cash-flow waterfall
monthlySold comps — $/sqft
last 12 mo · ≤1 miLoading sold comps…