 Multi-family
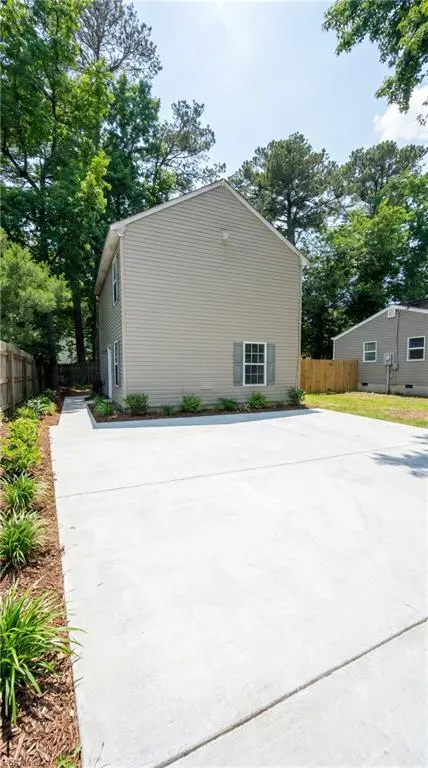
739 S Rosemont Rd · Virginia Beach, VA
Flood risk 1/10 · Minimal
- FEMA flood zone
- X (unshaded)
- Chance of flooding over 30 yrs
- 0.0%
- Est. flood insurance / yr
- $507 – $1,088
Fire risk 1/10 · Minimal
- Est. fire insurance / yr
- $666 – $1,236
Heat risk 9/10 · Severe
- Hot days now (above 105°F)
- 7 days/yr
- Hot days in 30 yrs
- 16 days/yr
Wind risk 8/10 · Major
- Chance of severe wind over 30 yrs
- 98.0%
Air-quality risk 3/10 · Minor
- Unhealthy air days now
- 2 days/yr
- Unhealthy air days in 30 yrs
- 4 days/yr
Risk factors via First Street. Map © Google.
Why this score? — see what drove the C grade
The composite is a weighted blend of 9 inputs, each scored 0–100. Each bar is that input's sub-score; the figure is the points it added to the 100-point composite (weight × sub-score).
- Cash flow +22.5/30.0
- ARV discount +7.5/15.0
- DSCR +7.2/10.0
- Schools +6.4/10.0
- 1% rule +5.3/10.0
- Livability +4.2/5.0
- Rent growth +3.7/5.0
- Condition / age +2.5/5.0
- Appreciation +0.0/10.0
$375,000
🖨 Deal sheet (PDF) 📄 Offer letter ✓ Due diligence
Multi-family units
County records classify this as Multi-Family (2-4 Unit). Listing-text estimate: 1 unit. estimate disagrees with records
Listing remarks
Welcome to 739 and 741 S Rosemont! Built in 1999, it has newer plumbing and electrical than most duplexes in the area, located in central Virginia Beach. Both units are 2 bedroom and 1.5 bathrooms. Identical layout side x side. •Roof- is in good shape •HVAC- been maintained and replaced •Water heater replaced in 741 •Front and back doors were replaced recently at each unit. Both units are tenant occupied by great and easy going long time tenants, always pay on time! Both are currently on Month to Month leases and prepared to leave but would prefer to stay. Rent Roll available upon request. Sold As Is.
Key facts
- Roof in good shape
- Newer plumbing
- Newer electrical
Tags
Property features AI
Finance
- Financial info: Unit 1 rent listed at $1,095 (month-to-month lease); Unit 2 rent listed at $1,150 (month-to-month lease)
Exterior
- Parking: Assigned/reserved parking; Driveway parking
- Utilities: Separate meters for all units; City/County water; City/County sewer; Electric power
- Home design: Duplex (side-by-side); Simple ownership; Slab foundation
- Construction: Vinyl exterior; Asphalt shingle roof; Slab foundation
- Exterior features: Vinyl siding; Asphalt shingle roof
Interior
- Kitchen: Dishwasher; Garbage disposal; Electric range; Refrigerator
- Bedrooms: Each unit has 2 bedrooms
- Flooring: Carpet; Ceramic tile
- Bathrooms: Each unit has 1.5 bathrooms
- Heating & cooling: Electric forced hot air heating; Central air conditioning
- Interior features: Ceiling fan in units
- Laundry & utility: Washer hookup in each unit; Dryer hookup in each unit; Electric water heater
Neighborhood map
What this means for you Summary
Snapshot
- This is a 4-bed/3.0-bath multifamily listed at $375k.
Deal economics
- At list price, monthly cash flow is $630 ($8k/yr) — positive.
- The deal already cash-flows at list — no discount required.
- Meets the 1% rule at list price ($4k rent vs $375k).
- Cap rate 8.3% vs local median 3.5% in Virginia Beach — top-decile yield for the area; either an underpriced asset or a hidden risk that comps aren't pricing in. Stress-test before assuming the spread holds.
Location & tenants
- Location reads 83/100 on livability (#38 in VA, #880 nationally) — a professional / high-income tenant draw. Strengths: amenities A+, employment A+, housing A+; Watch: cost of living C-, commute F.
- Va Beach City Public School District (urban): math 69% / reading 78% proficiency, ranked #10 of 131 in VA (top 8%) — strong family-tenant draw, lease renewals of 3-5y typical.
- Zoned schools: Windsor Oaks Elementary (math 62% / reading 77%, grade A-, #313 of 1,108 statewide, top 32%, 509 students, 75% FRL); Green Run High (math 64% / reading 69%, grade B, #195 of 319 statewide, top 62%, 1,517 students, 69% FRL) — zoned schools average 72% FRL vs 28% district-wide (44 pts higher); higher-poverty schools than district average — tighter screening recommended.
- Market conditions: Rents rising fast (+4.9%/yr); 232 active listings in the ZIP; 16 comparable units currently listed for rent nearby; rentals at typical pace (median 23d on market — plan ~3-4 weeks tenant-placement turnaround); solid renter incomes; 666 units permitted in Virginia Beach city in 2024 (347 in 5+ unit buildings).
- At $3,852/mo this rent would consume 58% of the median local household income ($79k/yr) (locally 2293% of renters already pay >50% of income on rent) — very limited rent-growth headroom before tenants either downsize or default.
Forward outlook
- Local home prices are declining (-3.0%/yr); year-one equity from $3k of loan paydown is wiped out by about $11k of value loss. Plan a longer hold.
- Virginia Beach County population projected at +6% by 2050 — modest demand growth; plan on rents tracking national, not racing it.
Negotiation context
- Only 6 days on market — expect competitive offers; lowballing is unlikely to land.
Risks & watch-outs
- Climate carrying-cost: severe wind risk, 98% chance of damaging wind over 30y; extreme-heat days projected 7→16/yr by 2055 (HVAC capex compounding) — expect insurance premiums to compound above CPI over the hold.
Questions for the listing agent
- Is there a deadline driving the sale (1031 exchange, divorce, estate, relocation)? That informs how much negotiation room exists.
- Schools are A-rated — typically a magnet for longer-tenancy family renters. What's the average tenant stay here, and is there a school-zone premium baked into asking?
- What's the average days-on-market for RENTAL listings here right now (not sales)? A rising rental-DOM trend means longer vacancies and softer asking-rent achievability than the comps imply.
- What's the recent tenant-quality profile in this submarket — average credit score on applications, eviction rate, late-payment / NSF rate, and stable-employment percentage? A property-management company in the area should have these aggregated.
- How much new apartment / multifamily construction is in the pipeline within 1–3 miles? Heavy new supply (>2% of stock underway) typically softens rents 12–24 months out; light construction supports rent growth.
Investment metrics
- 1% rule
- 1.03% ✓
- Cap rate
- 8.31%
- Cash-on-cash
- 7.20%
- DSCR
- 1.32
- GRM
- 8.1
CMA / ARV
No comps found within radius.
Projected returns pro-forma
-3.0% appreciation · 4.92% rent growth · sell at horizon
- IRR
- -3.3%
- Equity multiple
- 0.88×
- Total profit
- $-13,118
- Equity at exit
- $55,914
- IRR
- 8.4%
- Equity multiple
- 1.69×
- Total profit
- $72,389
- Equity at exit
- $32,423
Cash invested: $105,000 (down + closing). Projections, not guarantees.
Landlord ↔ Tenant lean methodology
- Overall (STATE)
- 55 Moderately Landlord-Leaning
- State Virginia
- 55 Moderately Landlord-Leaning · D+2
- County
- — inherits STATE
- City
- — inherits STATE
ZIP-level market 23452
- Rents YoY
- 4.9%
- Active inventory
- 232
- Price-to-rent
- 16.2×
Monthly cashflow live
- Estimated rent
- $3,852 high interval (Pro) →
- Mortgage (P&I)
- −$1,967
- Tax from tax record
- −$290 /mo · $3,485/yr
- Insurance
- −$156
- HOA
- −$0
- Vacancy / Maint / Mgmt
- −$809
- Net cashflow
- $630
Break-even live
Sensitivity live
| Price | -10% $842 | -5% $736 | +0% $630 | +5% $524 | +10% $418 |
|---|---|---|---|---|---|
| Rent | -10% $326 | -5% $478 | +0% $630 | +5% $782 | +10% $934 |
| Rate | -1.0pp $819 | -0.5pp $725 | base $630 | +0.5pp $533 | +1.0pp $434 |
2-unit breakdown (identical units grouped — click to expand)
| Units | Beds | Baths | Est. rent |
|---|---|---|---|
| 2× units | 2 | 1.5 | $3,852 |
| #1 | 2 | 1.5 | $1,926 |
| #2 | 2 | 1.5 | $1,926 |
| Total (2 units) | $3,852 | ||
UW: 25.0% down · 7.5% · 30yr · 1.5% tax · 5.0% vac · 8.0% maint · 8.0% mgmt
Financing live
Cash to close
- Down payment
- $93,750
- Closing costs
- $11,250
- Reserves months
- —
- Total cash needed
- —
Loan-product check · same deal, 3 products live
Conventional
25% down · 7.5% · 30yr
- Down + closing
- —
- Monthly P&I
- —
- Monthly cashflow
- —
- DSCR
- —
- Eligible?
- —
Personal DTI + credit; lowest rate.
DSCR
20% down · 8.5% · 30yr
- Down + closing
- —
- Monthly P&I
- —
- Monthly cashflow
- —
- DSCR
- —
- Eligible?
- —
No personal income docs; deal must DSCR.
Hard money
10% down · 12.0% · 12mo
- Down + closing
- —
- Monthly P&I
- —
- Monthly cashflow
- —
- DSCR
- —
- Eligible?
- —
Short-term bridge; refi at stabilization.
Rent comps 16 comps
| Address | Beds | Baths | Sqft | Rent | $/sqft | DOM | Units | Dist |
|---|---|---|---|---|---|---|---|---|
| 701 Arthur Ave Virginia Beach, VA | 4.0 | 1.5 | 1404 | $2,500 | $1.78 | 18d | 1 | 0.14mi |
| 3564 Faraday Ln Virginia Beach, VA | 4.0 | 2.5 | 1700 | $2,600 | $1.53 | 25d | 1 | 0.28mi |
| 3841 Forrester Ln Virginia Beach, VA | 3.0 | 2.0 | 1522 | $2,300 | $1.51 | 25d | 1 | 0.48mi |
| 3632 Silina Dr Virginia Beach, VA | 4.0 | 2.5 | 1666 | $2,495 | $1.50 | 8d | 1 | 0.89mi |
| 4016 Richard Lee Ct Virginia Beach, VA | 3.0 | 1.5 | 1470 | $2,100 | $1.43 | 3d | 1 | 0.93mi |
| 3788 Cainhoy Ln Virginia Beach, VA | 4.0 | 2.5 | 2400 | $2,950 | $1.23 | 8d | 1 | 0.99mi |
| 3504 Shawn Ct Virginia Beach, VA | 4.0 | 2.5 | 1669 | $2,650 | $1.59 | 25d | 1 | 1.04mi |
| 833 Tamarack Ct Virginia Beach, VA | 3.0 | 2.0 | 1650 | $2,100 | $1.27 | 17d | 1 | 1.09mi |
| 408 Lineberry Rd Virginia Beach, VA | 4.0 | 2.0 | 1561 | $2,700 | $1.73 | 25d | 1 | 1.09mi |
| 3904 Vanderhorst Dr Virginia Beach, VA | 3.0 | 2.5 | 2283 | $3,100 | $1.36 | 4d | 1 | 1.10mi |
| 643 Orangewood Dr Virginia Beach, VA | 3.0 | 2.0 | 1571 | $2,495 | $1.59 | 25d | 1 | 1.17mi |
| 932 Gossman Dr Virginia Beach, VA | 3.0 | 1.5 | 1430 | $2,300 | $1.61 | 22d | 1 | 1.20mi |
| 3517 Plum Cres Virginia Beach, VA | 3.0 | 2.0 | 1450 | $2,200 | $1.52 | 13d | 1 | 1.22mi |
| 212 Paladin Dr Virginia Beach, VA | 3.0 | 2.0 | 1456 | $2,800 | $1.92 | 25d | 1 | 1.30mi |
| 3521 Sierra Arch Virginia Beach, VA | 3.0 | 1.5 | 1420 | $1,650 | $1.16 | 25d | 1 | 1.33mi |
| 3828 Brentwood Cres Virginia Beach, VA | 4.0 | 2.5 | 1900 | $2,450 | $1.29 | 12d | 1 | 1.45mi |
Listing history 1 events
-
2026-05-22$375,000 Active
ⓘ Source: listings_history table (triggers on properties + properties_extension) + one-shot
backfill from property_details.listing_events for pre-trigger history.
Tax reassessment forecast VA · Resets to sale price
- Current annual tax
- $3,485 · $290/mo
- Projected year-2 tax
- $3,485 · $290/mo
- Expected delta
- $0/yr ($0/mo · 0.0%)
ⓘ Screening estimate from a state-policy table — verify with the county assessor before closing.
Climate risk First Street
- Flood 1/10 Low FEMA zone X (unshaded) · 0% chance over 30 yrs
- Wildfire 1/10 Low
- Heat 9/10 Extreme 7 d/yr ≥105°F today · 16 d/yr by 30 yrs out
- Wind 8/10 Severe 98% chance of damaging wind over 30 yrs
- Air quality 3/10 Moderate 2 unhealthy d/yr today · 4 by 30 yrs out
Nearby sold comps map
Loading sold comps map…
Walkable amenities ~0.75 mi
Loading nearby amenities…
Taxation est. · year 1
- Rental income
- $46,224
- − Mortgage interest
- −$21,006
- − Property taxes
- −$3,485
- − Insurance
- −$1,875
- − Repairs & maintenance
- −$3,698
- − Management
- −$3,698
- − Depreciation
- −$10,909
- Taxable income
- $1,553
- Est. tax owed @ 24.0%
- −$373
- After-tax cash flow
- $7,186/yr
For passive investors: Depreciation is non-cash, so a rental often shows a tax loss while cash-flowing — sheltering income. Rental losses are passive: they offset passive income freely, and up to $25,000/yr can offset ordinary (W-2) income if you actively participate and your MAGI is under $100k (phasing out to $0 by $150k); unused losses carry forward. On sale, claimed depreciation is recaptured at up to 25%, and gains may owe capital-gains tax (a 1031 exchange can defer both). Figures are a year-1 estimate at your 24.0% rate — not tax advice; consult a CPA.
Schools (NCES district)
- District
- Va Beach City Public School District
- NCES district ID
- 5103840
- Math proficiency
- 69% ▼ -19.00%
- Reading proficiency
- 78% ▼ -7.00%
- Median HH income
- $66,452
- Composite
- 63.81/100
- National rank
- #594
- State rank
- #10 of 131 in VA
Livability — Virginia Beach
- Score
- 83/100
- State rank
- #38
- US rank
- #880
Category grades
Schools grade is shown separately in the Schools card above.
Census & demographics
- Census place
- Virginia Beach, VA
- County
- Virginia Beach City · 448,227 people
- City population
- 448,227
- Metro
- Virginia Beach-Norfolk-Newport News, VA-NC
- Population (ZIP)
- 58,455
- Household income
- $79,085
- Rent vs Own
- Severe rent burden
- 2293.0
Population outlook (Virginia Beach County) Hauer SSP2
- Today (2025)
- 480,401 people
- By 2030
- 491,221 · +2.3%
- By 2040
- 504,882 · +5.1%
- By 2050
- 508,847 · +5.9%
- By 2075
- 504,831 · +5.1%
- By 2100
- 465,867 · -3.0%
Race, ethnicity, and origin ACS 2023
- Neighborhood character
- Diverse neighborhood (Simpson 0.59)
- Race & ethnicity
- White 60% Black 20% Two or more races 10% Hispanic / Latino 9% Asian 5%
- Hispanic origin (detail)
- Mexican 2% Puerto Rican 3%
- Common ancestry
- Romanian 2% Italian 2% Lithuanian 2%
- Foreign-born
- 8% · Canada, Jamaica
- Languages at home
- 88% English-only · Spanish 6% Tagalog/Filipino 2% Other Asian/Pacific 1%
Political lean MEDSL · Virginia Beach
- 2024 margin
- Toss-up / Even · D 50.7% · R 48.0% · Other 1.3%
- 2008→2024 swing
- +3.4pp toward D · 2008: -0.7pp · 2024: 2.6pp
- All cycles
- 2024: D+2.6 2020: D+5.4 2016: R+4.5 2012: R+2.5 2008: R+0.7
Not yet ingested
- Civics
- —
Market trends
- HPI YoY
- ▼ -363.80%
- Current HPI
- 328.5435
- Rent YoY
- ▲ 4.92%
- Metro
- Virginia Beach-Norfolk-Newport News, VA-NC
- State GDP YoY
- ▲ 2.40%
- F500 in state
- 50
Industry mix (Fortune 500 HQ in VA)
| Industry | F500 HQs | Revenue |
|---|---|---|
| Aerospace / Defense | 4 | $236B |
|
||
| Technology / Defense | 3 | $32B |
|
||
| Financial Services | 2 | $176B |
|
||
| Utilities | 2 | $27B |
|
||
| Insurance | 2 | $25B |
|
||
| Technology | 2 | $15B |
|
||
Price history
1 event — show timeline
- 2026-05-22 Listed $375,000 REINMLS
Property tax history
+7.7%/yrLatest (2025): $3,485 · +29.1% YoY. Source: county tax records.
Cash-flow waterfall
monthlySold comps — $/sqft
last 12 mo · ≤1 miLoading sold comps…