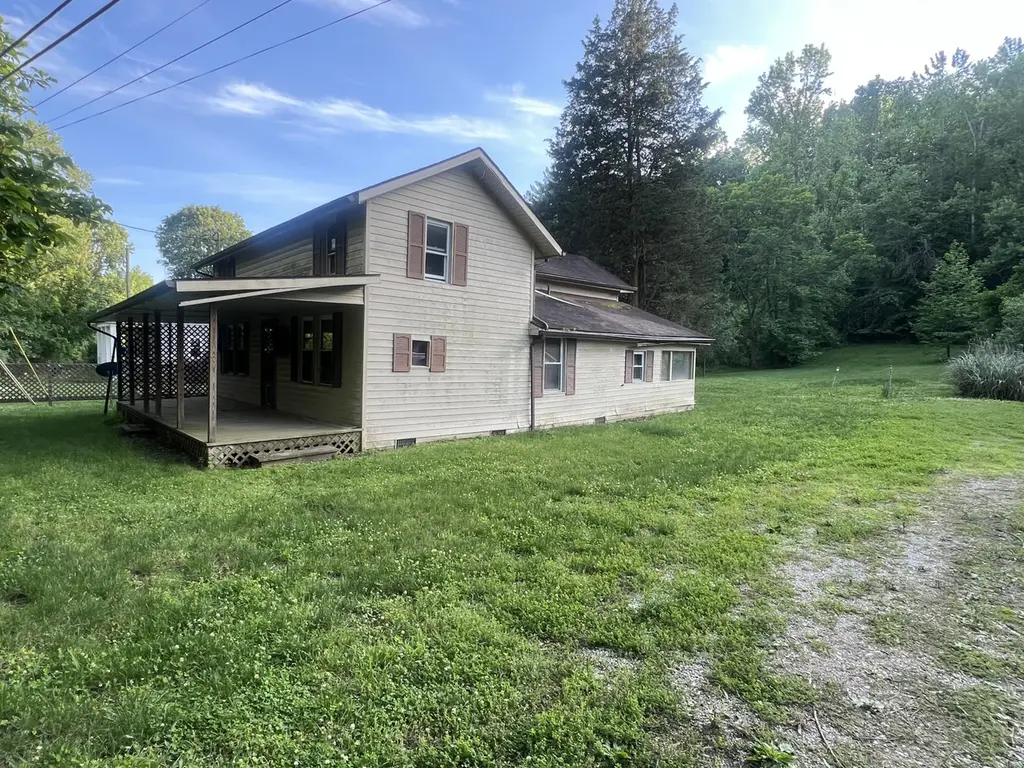
443 N Wilson Ave · Morehead, KY
Flood risk 9/10 · Severe
- FEMA flood zone
- X (unshaded)
- Chance of flooding over 30 yrs
- 0.99%
- Est. flood insurance / yr
- $507 – $1,088
Fire risk 5/10 · Moderate
- Est. fire insurance / yr
- $839 – $1,559
Heat risk 4/10 · Minor
- Hot days now (above 101°F)
- 7 days/yr
- Hot days in 30 yrs
- 19 days/yr
Wind risk 2/10 · Minimal
- Chance of severe wind over 30 yrs
- 3.0%
Air-quality risk 1/10 · Minimal
- Unhealthy air days now
- 0 days/yr
- Unhealthy air days in 30 yrs
- 0 days/yr
Risk factors via First Street. Map © Google.
Why this score? — see what drove the B+ grade
The composite is a weighted blend of 9 inputs, each scored 0–100. Each bar is that input's sub-score; the figure is the points it added to the 100-point composite (weight × sub-score).
- Cash flow +30.0/30.0
- ARV discount +15.0/15.0
- DSCR +10.0/10.0
- 1% rule +9.1/10.0
- Livability +3.1/5.0
- Schools +2.8/10.0
- Rent growth +2.5/5.0
- Condition / age +2.5/5.0
- Appreciation +0.0/10.0
$125,000
🖨 Deal sheet (PDF) 📄 Offer letter ✓ Due diligence
Listing remarks
This is located downtown Morehead close to St Claire and Morehead State University. It is a fixer upper with 2.478 surveyed acres a very large lot for the downtown Morehead.
Key facts
- Downtown morehead
- Large lot
- 2.478 surveyed acres
Tags
Property features AI
Finance
- Other: Lot size about 2.62 acres (public records)
Exterior
- Parking: Driveway
- Utilities: Public sewer; Electricity available; Sewer connected; Water available
- Home design: House; One and one-half stories
- Construction: Aluminum siding; Composition roof; Pillar/post/pier foundation; Built area approximately 1,560 (building area total)
- Exterior features: Shed(s) on the property; Few trees on the lot; Public water available; Not waterfront; No notable view
Interior
- Bedrooms: 2 total rooms (includes bedrooms and other rooms)
- Flooring: Carpet flooring
- Bathrooms: 1 full bathroom
- Interior features: Crawl space basement; No fireplace
Neighborhood map
What this means for you Summary
Snapshot
- This is a 4-bed/1.0-bath single-family listed at $125k.
Deal economics
- At list price, monthly cash flow is $546 ($7k/yr) — positive.
- The deal already cash-flows at list — no discount required.
- Meets the 1% rule at list price ($2k rent vs $125k).
- Recommended offer: $123k (1.5% below list) — sets the bar for market timing.
- Cap rate 12.2% vs local median 4.7% in Morehead — top-decile yield for the area; either an underpriced asset or a hidden risk that comps aren't pricing in. Stress-test before assuming the spread holds.
Location & tenants
- Location reads 62/100 on livability (#345 in KY) — a middle-class / working-renter tenant base. Strengths: cost of living A+, crime A; Watch: health & safety C-, housing D, amenities F.
- Rowan County (rural): math 28% / reading 41% proficiency, ranked #74 of 165 in KY (top 45%) — families likely to look elsewhere, expect single-tenant / working-renter base with shorter leases.
- Zoned schools: Mcbrayer Elementary School (math 30% / reading 47%, grade F, #234 of 676 statewide, top 36%, 562 students, 54% FRL); Rowan County Middle School (math 31% / reading 46%, grade F, #68 of 217 statewide, top 32%, 716 students, 62% FRL); Rowan County Senior High School (math 29% / reading 31%, grade F, #122 of 254 statewide, top 49%, 1,017 students, 60% FRL).
- Market conditions: 147 active listings in the ZIP; 1 comparable units currently listed for rent nearby; 15 units permitted in Rowan County in 2024 (0 in 5+ unit buildings).
- This rent runs 41% of the median local income ($52k/yr) — at the standard rent-burdened threshold; future hikes will face affordability resistance.
Forward outlook
- Local home prices are declining (-3.0%/yr); year-one equity from $864 of loan paydown is wiped out by about $4k of value loss. Plan a longer hold.
- Rowan County population projected at +35% by 2050 — long-run rental-demand tailwind backs the buy-and-hold thesis.
- At projected returns (-3.0% appreciation + 3.0% rent growth), your $35k cash investment doubles in ~7 years — after that, you're playing with house money.
Negotiation context
- It's been on market 15 days — a 2% lower offer ($123k) is reasonable based on typical stale-listing flexibility.
Risks & watch-outs
- Watch-outs: flood insurance adds $66/mo; built in 1900 — expect roof / HVAC / electrical / plumbing capex.
- Climate carrying-cost: severe flood risk; moderate wildfire risk — expect insurance premiums to compound above CPI over the hold.
Questions for the listing agent
- Built in 1900 — when were the roof, HVAC, electrical panel, plumbing, and water heater last replaced?
- What's the actual annual flood-insurance premium (NFIP or private), and is the property in a SFHA with mandatory coverage?
- Is there a deadline driving the sale (1031 exchange, divorce, estate, relocation)? That informs how much negotiation room exists.
- Schools are D-rated, which usually means shorter tenancies and higher turnover. Who's the typical renter profile here, and what's been the actual vacancy rate?
- What's the average days-on-market for RENTAL listings here right now (not sales)? A rising rental-DOM trend means longer vacancies and softer asking-rent achievability than the comps imply.
- What's the recent tenant-quality profile in this submarket — average credit score on applications, eviction rate, late-payment / NSF rate, and stable-employment percentage? A property-management company in the area should have these aggregated.
- How much new for-sale + rental construction is in the pipeline within 1–3 miles? Heavy new supply typically softens prices + rents 12–24 months out; constrained supply supports both.
Investment metrics
- 1% rule
- 1.41% ✓
- Cap rate
- 12.17%
- Cash-on-cash
- 21.00%
- DSCR
- 1.93
- GRM
- 5.9
CMA / ARV
- ARV (on-the-fly)
- $210,600
- Comps found
- 3
Show comp detail 3 sales within ~0.75 mi
| Address | Dist | Beds/Ba | Sqft | Sold | Price | $/sf | Match |
|---|---|---|---|---|---|---|---|
| 841 North Wilson Ave | 0.48mi | 3/1.5 (-1) | 1,444 (-7%) | 12mo | $209,000 | $145 | 48 |
| 1007 Knapp Ave | 0.58mi | 3/2.0 (-1) | 1,736 (+11%) | 6mo | $195,000 | $112 | 40 |
| 614 Hill Ct | 0.71mi | 3/2.0 (-1) | 1,482 (-5%) | 15mo | $200,000 | $135 | 37 |
Match score weights: distance 35% · size 25% · config 20% · recency 20%. Top-matched comps best support the ARV.
Projected returns pro-forma
-3.0% appreciation · 3.0% rent growth · sell at horizon
- IRR
- 10.5%
- Equity multiple
- 1.42×
- Total profit
- $14,547
- Equity at exit
- $18,638
- IRR
- 19.6%
- Equity multiple
- 2.64×
- Total profit
- $57,527
- Equity at exit
- $10,808
Cash invested: $35,000 (down + closing). Projections, not guarantees.
Landlord ↔ Tenant lean methodology
- Overall (STATE)
- 83 Strongly Landlord-Friendly
- State Kentucky
- 83 Strongly Landlord-Friendly · R+16
- County
- — inherits STATE
- City
- — inherits STATE
ZIP-level market 40351
- Home prices YoY
- -22.6%
- Active inventory
- 147
- Price-to-rent
- 5.9×
Monthly cashflow live
- Estimated rent
- $1,765 medium interval (Pro) →
- Mortgage (P&I)
- −$656
- Tax from tax record
- −$74 /mo · $890/yr
- Insurance
- −$52
- Flood insurance flood zone
- −$66 /mo · $798/yr
- HOA
- −$0
- Vacancy / Maint / Mgmt
- −$371
- Net cashflow
- $546
Break-even live
Sensitivity live
| Price | -10% $617 | -5% $582 | +0% $546 | +5% $511 | +10% $475 |
|---|---|---|---|---|---|
| Rent | -10% $407 | -5% $476 | +0% $546 | +5% $616 | +10% $686 |
| Rate | -1.0pp $609 | -0.5pp $578 | base $546 | +0.5pp $514 | +1.0pp $481 |
UW: 25.0% down · 7.5% · 30yr · 1.5% tax · 5.0% vac · 8.0% maint · 8.0% mgmt
Financing live
Cash to close
- Down payment
- $31,250
- Closing costs
- $3,750
- Reserves months
- —
- Total cash needed
- —
Loan-product check · same deal, 3 products live
Conventional
25% down · 7.5% · 30yr
- Down + closing
- —
- Monthly P&I
- —
- Monthly cashflow
- —
- DSCR
- —
- Eligible?
- —
Personal DTI + credit; lowest rate.
DSCR
20% down · 8.5% · 30yr
- Down + closing
- —
- Monthly P&I
- —
- Monthly cashflow
- —
- DSCR
- —
- Eligible?
- —
No personal income docs; deal must DSCR.
Hard money
10% down · 12.0% · 12mo
- Down + closing
- —
- Monthly P&I
- —
- Monthly cashflow
- —
- DSCR
- —
- Eligible?
- —
Short-term bridge; refi at stabilization.
Rent comps 1 comps
| Address | Beds | Baths | Sqft | Rent | $/sqft | DOM | Units | Dist |
|---|---|---|---|---|---|---|---|---|
| 328 Lyons Ave Morehead, KY | 4.0 | 2.0 | 1996 | $1,850 | $0.93 | 4d | 1 | 0.14mi |
Listing history 12 events
-
2026-06-18days on market $125,000 Active 15 DOM
-
2026-06-17days on market $125,000 Active 14 DOM
-
2026-06-16days on market $125,000 Active 13 DOM
-
2026-06-15days on market $125,000 Active 12 DOM
-
2026-06-14days on market $125,000 Active 10 DOM
-
2026-06-13days on market $125,000 Active 9 DOM
-
2026-06-10days on market $125,000 Active 7 DOM
-
2026-06-09days on market $125,000 Active 6 DOM
-
2026-06-08days on market $125,000 Active 5 DOM
-
2026-06-07days on market $125,000 Active 4 DOM
-
2026-06-03remarks 173-char remark
-
2026-06-03$125,000 Active 1 DOM
ⓘ Source: listings_history table (triggers on properties + properties_extension) + one-shot
backfill from property_details.listing_events for pre-trigger history.
Tax reassessment forecast KY · Resets to sale price
- Current annual tax
- $890 · $74/mo
- Projected year-2 tax
- $1,075 · $90/mo
- Expected delta
- +$185/yr (+$15/mo · 20.8%)
ⓘ Screening estimate from a state-policy table — verify with the county assessor before closing.
Climate risk First Street
- Flood 9/10 Extreme FEMA zone X (unshaded) · 99% chance over 30 yrs
- Wildfire 5/10 Major
- Heat 4/10 Moderate 7 d/yr ≥101°F today · 19 d/yr by 30 yrs out
- Wind 2/10 Low 3% chance of damaging wind over 30 yrs
- Air quality 1/10 Low 0 unhealthy d/yr today · 0 by 30 yrs out
Nearby sold comps map
Loading sold comps map…
Walkable amenities ~0.75 mi
Loading nearby amenities…
Taxation est. · year 1
- Rental income
- $21,180
- − Mortgage interest
- −$7,002
- − Property taxes
- −$890
- − Insurance
- −$1,422
- − Repairs & maintenance
- −$1,694
- − Management
- −$1,694
- − Depreciation
- −$3,636
- Taxable income
- $4,841
- Est. tax owed @ 24.0%
- −$1,162
- After-tax cash flow
- $5,392/yr
For passive investors: Depreciation is non-cash, so a rental often shows a tax loss while cash-flowing — sheltering income. Rental losses are passive: they offset passive income freely, and up to $25,000/yr can offset ordinary (W-2) income if you actively participate and your MAGI is under $100k (phasing out to $0 by $150k); unused losses carry forward. On sale, claimed depreciation is recaptured at up to 25%, and gains may owe capital-gains tax (a 1031 exchange can defer both). Figures are a year-1 estimate at your 24.0% rate — not tax advice; consult a CPA.
Schools (NCES district)
- District
- Rowan County
- NCES district ID
- 2105100
- Math proficiency
- 28% ▼ -19.00%
- Reading proficiency
- 41% ▼ -12.00%
- Median HH income
- $35,139
- Composite
- 28.47/100
- National rank
- #6742
- State rank
- #74 of 165 in KY
Livability — Morehead
- Score
- 62/100
- State rank
- #345
- US rank
- #16479
Category grades
Schools grade is shown separately in the Schools card above.
Census & demographics
- Census place
- Morehead, KY
- County
- Rowan County · 22,322 people
- City population
- 22,322
- Metro
- nan
- Population (ZIP)
- 22,322
- Household income
- $51,835
- Rent vs Own
- Severe rent burden
- 589.0
Population outlook (Rowan County) Hauer SSP2
- Today (2025)
- 27,518 people
- By 2030
- 29,242 · +6.3%
- By 2040
- 32,949 · +19.7%
- By 2050
- 37,128 · +34.9%
- By 2075
- 49,130 · +78.5%
- By 2100
- 59,014 · +114.5%
Race, ethnicity, and origin ACS 2023
- Neighborhood character
- Predominantly White (94%)
- Race & ethnicity
- White 94% Hispanic / Latino 2% Two or more races 2% Black 1%
- Common ancestry
- Slovak 2% Serbian 1% Lithuanian 1%
- Foreign-born
- 2% · Canada
- Languages at home
- 98% English-only · Spanish 2%
Political lean MEDSL · Rowan
- 2024 margin
- Strong R (+27.8) · D 35.3% · R 63.0% · Other 1.7%
- 2008→2024 swing
- -29.8pp toward R · 2008: 2.0pp · 2024: -27.8pp
- All cycles
- 2024: R+27.8 2020: R+21.0 2016: R+21.3 2012: R+7.8 2008: D+2.0
Not yet ingested
- Civics
- —
Market trends
- HPI YoY
- ▼ -59.28%
- Current HPI
- 203.0786
- Rent YoY
- —
- Metro
- nan
- State GDP YoY
- ▲ 1.81%
- F500 in state
- 4
Industry mix (Fortune 500 HQ in KY)
| Industry | F500 HQs | Revenue |
|---|---|---|
| Healthcare | 1 | $118B |
|
||
| Food / Beverage | 1 | $7B |
|
||
Price history
1 event — show timeline
- 2026-06-01 Listed $125,000 ImagineMLS
Cash-flow waterfall
monthlySold comps — $/sqft
last 12 mo · ≤1 miLoading sold comps…