1616 Pennsylvania Ave #257 · Vineland, NJ
Flood risk No data
- FEMA flood zone
- —
- Chance of flooding over 30 yrs
- —
- Est. flood insurance / yr
- —
Fire risk No data
- Est. fire insurance / yr
- —
Heat risk No data
- Hot days now (above threshold)
- —
- Hot days in 30 yrs
- —
Wind risk No data
- Chance of severe wind over 30 yrs
- —
Air-quality risk No data
- Unhealthy air days now
- —
- Unhealthy air days in 30 yrs
- —
Risk factors via First Street. Map © Google.
Why this score? — see what drove the C+ grade
The composite is a weighted blend of 9 inputs, each scored 0–100. Each bar is that input's sub-score; the figure is the points it added to the 100-point composite (weight × sub-score).
- Cash flow +30.0/30.0
- DSCR +10.0/10.0
- 1% rule +8.6/10.0
- ARV discount +6.1/15.0
- Livability +3.3/5.0
- Rent growth +2.5/5.0
- Condition / age +2.5/5.0
- Schools +1.9/10.0
- Appreciation +0.0/10.0
$170,000
🖨 Deal sheet 📄 Offer letter ✓ Due diligence
Listing remarks
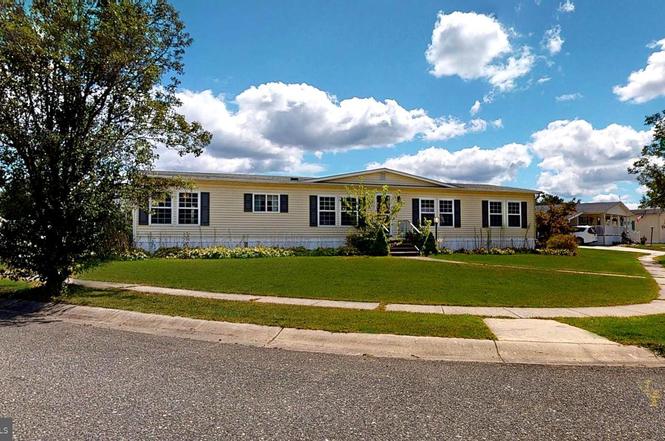
Sale and Agreements are subject to the application approval / process by Berryman's Branch. A fantastic opportunity to own a spacious home without the inflated price point. Welcome to a large corner property with plenty of space. You will find peace of mind with a Newer Roof replaced about 3 and a Half Years Ago, New Breaker Panel installed just a little over a year, And a New HVAC System replaced just last summer. You will also find additional living space open to the Dining area and large Kitchen separate from the main formal living space. A Large private Main Suite with a walk-in shower & larger closet. The additional 2 Bedrooms are on the opposite side of the home with an extra Fu
Key facts
- 2 parking spots
- Community pool
- Built 1998
Property features AI
Finance
- Other: Not in a federal flood zone; Ownership: Land lease; Property condition: Very good
- HOA & community: Land lease amount: $939 monthly; Pets allowed with no pet restrictions; Community pool
Exterior
- Parking: Driveway parking (2 spaces); Total of 2 garage/parking spaces
- Utilities: Public water; Public sewer; Natural gas available; Hot water: natural gas; Cable TV
- Home design: Manufactured / modular double-wide home; Level entry; Estimated year built
- Construction: Asphalt roof; Manufactured construction; Above-grade structures
- Exterior features: Porch (enclosed); Shed; Lawn sprinkler; Sidewalks; Street lights; Corner lot with front, rear and side yards; Community in-ground fenced pool
Interior
- Kitchen: Electric oven/range; Stainless steel appliances; Dishwasher; Garbage disposal; Microwave
- Bedrooms: 3 bedrooms on the main level
- Flooring: Laminate; Partially carpeted; Vinyl
- Bathrooms: 2 full bathrooms on the main level
- Heating & cooling: Central heating (natural gas); Central air conditioning (natural gas)
- Interior features: Family room off the kitchen; Ceiling fan(s); Breakfast area; Pantry; Drywall walls and ceilings
- Laundry & utility: Laundry on the main floor
Neighborhood map
What this means for you Summary
Snapshot
- This is a 3-bed/2.0-bath single-family listed at $170k.
Deal economics
- At list price, monthly cash flow is $657 ($8k/yr) — positive.
- The deal already cash-flows at list — no discount required.
- Meets the 1% rule at list price ($2k rent vs $170k).
- Recommended offer: $150k (12.0% below list) — sets the bar for market timing.
- Cap rate 10.9% vs local median 4.5% in Vineland — top-decile yield for the area; either an underpriced asset or a hidden risk that comps aren't pricing in. Stress-test before assuming the spread holds.
Location & tenants
- Location reads 66/100 on livability (#363 in NJ) — a middle-class / working-renter tenant base. Strengths: housing A+, health & safety A+; Watch: employment D+, schools D, crime F.
- Vineland Public School District (urban): math 9% / reading 34% proficiency, ranked #418 of 472 in NJ (top 89%) — low school quality limits family demand, transient renter base, plan for 1-2y turnover.
- Market conditions: 87 active listings in the ZIP; 216 units permitted in Cumberland County in 2024 (73 in 5+ unit buildings).
Forward outlook
- Local home prices are declining (-3.0%/yr); year-one equity from $1k of loan paydown is wiped out by about $5k of value loss. Plan a longer hold.
- Cumberland County population projected to shrink 7% by 2050 — rents likely to lag national; underwrite the cash flow, not the appreciation.
- At projected returns (-3.0% appreciation + 3.0% rent growth), your $48k cash investment doubles in ~8 years — after that, you're playing with house money.
Negotiation context
- It's been on market 274 days — a 12% lower offer ($150k) is reasonable based on typical stale-listing flexibility.
Questions for the listing agent
- It's been on market 274 days. Have you received any prior offers? Is the seller open to a 12% concession, seller financing, or rate buy-down credit?
- Why hasn't it sold? Are there any deal-killer items the seller is aware of (foundation, flood, title, zoning, code violations)?
- Is there a deadline driving the sale (1031 exchange, divorce, estate, relocation)? That informs how much negotiation room exists.
- Schools are D-rated, which usually means shorter tenancies and higher turnover. Who's the typical renter profile here, and what's been the actual vacancy rate?
- Crime grade is F in this area — have there been break-ins, vandalism, or insurance claims at this property in the last 3 years? What carrier currently insures it and at what premium?
- What's the average days-on-market for RENTAL listings here right now (not sales)? A rising rental-DOM trend means longer vacancies and softer asking-rent achievability than the comps imply.
- What's the recent tenant-quality profile in this submarket — average credit score on applications, eviction rate, late-payment / NSF rate, and stable-employment percentage? A property-management company in the area should have these aggregated.
- How much new for-sale + rental construction is in the pipeline within 1–3 miles? Heavy new supply typically softens prices + rents 12–24 months out; constrained supply supports both.
Investment metrics
- 1% rule
- 1.36% ✓
- Cap rate
- 10.93%
- Cash-on-cash
- 16.57%
- DSCR
- 1.74
- GRM
- 6.1
CMA / ARV
- ARV (on-the-fly)
- $164,864
- Comps found
- 12
Show comp detail 12 sales within ~0.75 mi
| Address | Dist | Beds/Ba | Sqft | Sold | Price | $/sf | Match |
|---|---|---|---|---|---|---|---|
| 1616 Pennsylvania Ave Unit 137 BLUEBERRY | 0.02mi | 3/2.0 | 1,800 (+0%) | 5mo | $160,000 | $89 | 94 |
| 1616 Pennsylvania Ave #218 | 0.01mi | 3/2.0 | 1,850 (+3%) | 3mo | $184,900 | $100 | 92 |
| 1616 Pennsylvania Ave #208 | 0.13mi | 3/2.0 | 1,850 (+3%) | 3mo | $170,000 | $92 | 86 |
| 1616 Pennsylvania Ave #174 | 0.19mi | 3/2.0 | 1,736 (-3%) | 1mo | $163,000 | $94 | 85 |
| 1616 Pennsylvania #256 | 0.18mi | 3/2.0 | 1,800 (+0%) | 13mo | $170,000 | $94 | 80 |
| 1616 Pennsylvania Ave #224 | 0.04mi | 3/2.0 | 1,904 (+6%) | 10mo | $175,000 | $92 | 79 |
| 1616 Pennsylvania Ave #243 | 0.04mi | 3/2.0 | 1,902 (+6%) | 12mo | $160,000 | $84 | 78 |
| 1616 Pennsylvania Ave #278 | 0.21mi | 4/2.0 (+1) | 1,820 (+2%) | 10mo | $166,500 | $91 | 74 |
| 3717 Nathan Ln | 0.36mi | 3/2.5 | 1,710 (-5%) | 6mo | $439,900 | $257 | 68 |
| 1616 Pennsylvania Ave Unit 248 CHERRY LANE | 0.04mi | 3/2.0 | 1,568 (-12%) | 11mo | $130,000 | $83 | 68 |
| 1616 Pennsylvania Ave Unit 292 CHERRY | 0.17mi | 3/2.0 | 1,560 (-13%) | 8mo | $100,000 | $64 | 64 |
| 2550 Hance Bridge Rd | 0.71mi | 3/1.5 | 1,544 (-14%) | 12mo | $509,000 | $330 | 32 |
Match score weights: distance 35% · size 25% · config 20% · recency 20%. Top-matched comps best support the ARV.
Projected returns pro-forma
-3.0% appreciation · 3.0% rent growth · sell at horizon
- IRR
- 7.7%
- Equity multiple
- 1.30×
- Total profit
- $14,357
- Equity at exit
- $25,348
- IRR
- 17.0%
- Equity multiple
- 2.40×
- Total profit
- $66,558
- Equity at exit
- $14,698
Cash invested: $47,600 (down + closing). Projections, not guarantees.
Landlord ↔ Tenant lean methodology
- Overall (STATE)
- 21 Tenant-Leaning
- State New Jersey
- 21 Tenant-Leaning · D+6
- County
- — inherits STATE
- City
- — inherits STATE
ZIP-level market 08361
- Active inventory
- 87
- Price-to-rent
- 6.1×
Monthly cashflow live
- Estimated rent
- $2,319 medium interval (Pro) →
- Mortgage (P&I)
- −$891
- Tax est. 1.5%
- −$212 /mo · $2,550/yr
- Insurance
- −$71
- HOA
- −$0
- Vacancy / Maint / Mgmt
- −$487
- Net cashflow
- $657
Break-even live
UW: 25.0% down · 7.5% · 30yr · 1.5% tax · 5.0% vac · 8.0% maint · 8.0% mgmt
Financing live
Cash to close
- Down payment
- $42,500
- Closing costs
- $5,100
- Reserves months
- —
- Total cash needed
- —
Loan-product check · same deal, 3 products live
Conventional
25% down · 7.5% · 30yr
- Down + closing
- —
- Monthly P&I
- —
- Monthly cashflow
- —
- DSCR
- —
- Eligible?
- —
Personal DTI + credit; lowest rate.
DSCR
20% down · 8.5% · 30yr
- Down + closing
- —
- Monthly P&I
- —
- Monthly cashflow
- —
- DSCR
- —
- Eligible?
- —
No personal income docs; deal must DSCR.
Hard money
10% down · 12.0% · 12mo
- Down + closing
- —
- Monthly P&I
- —
- Monthly cashflow
- —
- DSCR
- —
- Eligible?
- —
Short-term bridge; refi at stabilization.
Listing history 19 events
-
2026-06-19days on market $170,000 Active 274 DOM
-
2026-06-18days on market $170,000 Active 273 DOM
-
2026-06-17days on market $170,000 Active 272 DOM
-
2026-06-16days on market $170,000 Active 271 DOM
-
2026-06-15days on market $170,000 Active 270 DOM
-
2026-06-14days on market $170,000 Active 268 DOM
-
2026-06-13days on market $170,000 Active 267 DOM
-
2026-06-10days on market $170,000 Active 265 DOM
-
2026-06-09days on market $170,000 Active 264 DOM
-
2026-06-08days on market $170,000 Active 263 DOM
-
2026-06-07days on market $170,000 Active 262 DOM
-
2026-06-03days on market $170,000 Active 258 DOM
-
2026-06-02days on market $170,000 Active 257 DOM
-
2026-06-01days on market $170,000 Active 256 DOM
-
2026-05-31days on market $170,000 Active 255 DOM
-
2026-05-30days on market $170,000 Active 254 DOM
-
2026-03-18price $170,000
-
2025-09-19$175,000 Active
-
2025-09-17historical $175,000
ⓘ Source: listings_history table (triggers on properties + properties_extension) + one-shot
backfill from property_details.listing_events for pre-trigger history.
Nearby sold comps map
Loading sold comps map…
Walkable amenities ~0.75 mi
Loading nearby amenities…
Taxation est. · year 1
- Rental income
- $27,831
- − Mortgage interest
- −$9,523
- − Property taxes
- −$2,550
- − Insurance
- −$850
- − Repairs & maintenance
- −$2,226
- − Management
- −$2,226
- − Depreciation
- −$4,945
- Taxable income
- $5,510
- Est. tax owed @ 24.0%
- −$1,322
- After-tax cash flow
- $6,566/yr
For passive investors: Depreciation is non-cash, so a rental often shows a tax loss while cash-flowing — sheltering income. Rental losses are passive: they offset passive income freely, and up to $25,000/yr can offset ordinary (W-2) income if you actively participate and your MAGI is under $100k (phasing out to $0 by $150k); unused losses carry forward. On sale, claimed depreciation is recaptured at up to 25%, and gains may owe capital-gains tax (a 1031 exchange can defer both). Figures are a year-1 estimate at your 24.0% rate — not tax advice; consult a CPA.
Schools (NCES district)
- District
- Vineland Public School District
- NCES district ID
- 3416800
- Math proficiency
- 9% ▼ -17.00%
- Reading proficiency
- 34% ▬ 0.00%
- Median HH income
- $51,168
- Composite
- 19.17/100
- National rank
- #8819
- State rank
- #418 of 472 in NJ
Livability — Vineland
- Score
- 66/100
- State rank
- #363
- US rank
- #12180
Category grades
Schools grade is shown separately in the Schools card above.
Census & demographics
- Census place
- Vineland, NJ
- City population
- 45,038
- Population (ZIP)
- 18,375
Population outlook (Cumberland County) Hauer SSP2
- Today (2025)
- 152,743 people
- By 2030
- 150,373 · -1.6%
- By 2040
- 146,881 · -3.8%
- By 2050
- 142,653 · -6.6%
- By 2075
- 129,468 · -15.2%
- By 2100
- 107,456 · -29.6%
Race, ethnicity, and origin ACS 2023
- Neighborhood character
- Diverse neighborhood (Simpson 0.59)
- Race & ethnicity
- White 57% Hispanic / Latino 27% Two or more races 13% Black 10% Asian 3% Native American 2%
- Hispanic origin (detail)
- Mexican 2% Puerto Rican 20% Dominican 3%
- Common ancestry
- Romanian 2% Scotch-Irish 2% Subsaharan African 2%
- Foreign-born
- 9% · Canada
- Languages at home
- 75% English-only · Spanish 16% Other Indo-European 4% Russian/Polish/Slavic 2%
Political lean MEDSL · Cumberland
- 2024 margin
- Toss-up / Even · D 47.6% · R 51.3% · Other 1.1%
- 2008→2024 swing
- -25.4pp toward R · 2008: 21.6pp · 2024: -3.8pp
- All cycles
- 2024: R+3.8 2020: D+6.0 2016: D+5.3 2012: D+23.1 2008: D+21.6
Not yet ingested
- Civics
- —
Market trends
- HPI YoY
- ▼ -215.80%
- Current HPI
- 291.3404
- Rent YoY
- —
- Metro
- —
- State GDP YoY
- ▲ 2.05%
- F500 in state
- 34
Industry mix (Fortune 500 HQ in NJ)
| Industry | F500 HQs | Revenue |
|---|---|---|
| Consumer Goods | 3 | $31B |
|
||
| Pharmaceuticals | 2 | $153B |
|
||
| Technology | 2 | $21B |
|
||
| Insurance | 2 | $20B |
|
||
| Healthcare | 2 | $19B |
|
||
| Financial Services | 1 | $70B |
|
||
Price history
-2.9% since first listed3 events — show timeline
- 2026-03-18 Price Changed $170,000 BRIGHT MLS
- 2025-09-19 Listed $175,000 BRIGHT MLS
- 2025-09-17 Coming Soon $175,000 BRIGHT MLS
Cash-flow waterfall
monthlySold comps — $/sqft
last 12 mo · ≤1 miLoading sold comps…