 🏗️ New Construction
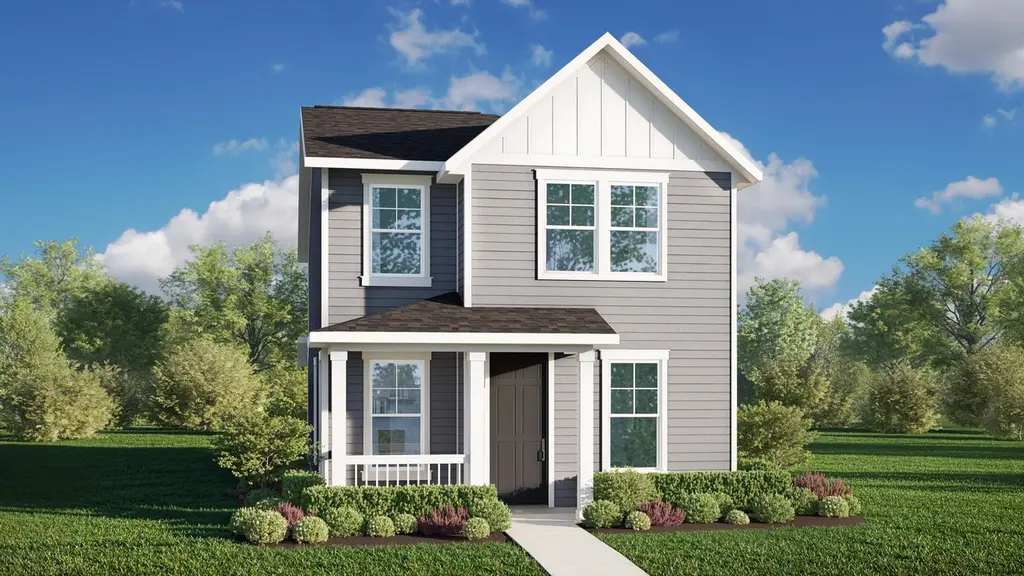
Barton Plan · Taylor, TX
Flood risk No data
- FEMA flood zone
- —
- Chance of flooding over 30 yrs
- —
- Est. flood insurance / yr
- —
Fire risk No data
- Est. fire insurance / yr
- —
Heat risk No data
- Hot days now (above threshold)
- —
- Hot days in 30 yrs
- —
Wind risk No data
- Chance of severe wind over 30 yrs
- —
Air-quality risk No data
- Unhealthy air days now
- —
- Unhealthy air days in 30 yrs
- —
Risk factors via First Street. Map © Google.
Why this score? — see what drove the D- grade
The composite is a weighted blend of 9 inputs, each scored 0–100. Each bar is that input's sub-score; the figure is the points it added to the 100-point composite (weight × sub-score).
- Cash flow +10.7/30.0
- ARV discount +7.5/15.0
- Condition / age +4.0/5.0
- Livability +3.6/5.0
- 1% rule +3.1/10.0
- DSCR +3.1/10.0
- Rent growth +2.6/5.0
- Schools +2.0/10.0
- Appreciation +0.0/10.0
$243,990
🖨 Deal sheet 📄 Offer letter ✓ Due diligence
Listing remarks MLS
Spring - Barton
Key facts
- 2 garage spots
- Listed 267 days
Neighborhood map
What this means for you Summary
Snapshot
- This is a 3-bed/2.5-bath single-family listed at $244k. Condition is rated good.
Deal economics
- At list price, monthly cash flow is $-142 ($-2k/yr) — negative.
- The deal already cash-flows at list — no discount required.
- To meet the 1% rule (rent ≥ 1% of price), the offer needs to be $238k (2.6% below list).
- Recommended offer: $215k (12.0% below list) — sets the bar for market timing.
- Cap rate 5.7% vs local median 4.3% in Taylor — top-decile yield for the area; either an underpriced asset or a hidden risk that comps aren't pricing in. Stress-test before assuming the spread holds.
Location & tenants
- Location reads 71/100 on livability (#312 in TX) — a middle-class / working-renter tenant base. Strengths: cost of living A+, housing A+; Watch: employment C-, schools D-, amenities F.
- Taylor ISD (town): math 20% / reading 27% proficiency, ranked #726 of 826 in TX (top 88%) — low school quality limits family demand, transient renter base, plan for 1-2y turnover; 61% free/reduced lunch — lower-income household profile, screen leases tightly.
- Market conditions: Rents flat; 314 active listings in the ZIP; 13 comparable units currently listed for rent nearby; rentals at typical pace (median 22d on market — plan ~3-4 weeks tenant-placement turnaround); solid renter incomes; 7,543 units permitted in Williamson County in 2024 (1,425 in 5+ unit buildings).
- This rent runs 36% of the median local income ($79k/yr) — at the standard rent-burdened threshold; future hikes will face affordability resistance.
Forward outlook
- Local home prices are declining (-3.0%/yr); year-one equity from $2k of loan paydown is wiped out by about $9k of value loss. Plan a longer hold.
- Williamson County population projected at +69% by 2050 — long-run rental-demand tailwind backs the buy-and-hold thesis.
Negotiation context
- It's been on market 267 days — a 12% lower offer ($215k) is reasonable based on typical stale-listing flexibility.
Questions for the listing agent
- What do current leases actually rent for vs. the listed asking? Can we see a recent rent roll and the last 12 months of T-12 income?
- It's been on market 267 days. Have you received any prior offers? Is the seller open to a 12% concession, seller financing, or rate buy-down credit?
- Why hasn't it sold? Are there any deal-killer items the seller is aware of (foundation, flood, title, zoning, code violations)?
- Is there a deadline driving the sale (1031 exchange, divorce, estate, relocation)? That informs how much negotiation room exists.
- Schools are D-rated, which usually means shorter tenancies and higher turnover. Who's the typical renter profile here, and what's been the actual vacancy rate?
- The area grade is low — what's the realistic commute time and amenity access for the typical tenant pool here? Any planned neighborhood developments (good or bad) we should know about?
- What's the average days-on-market for RENTAL listings here right now (not sales)? A rising rental-DOM trend means longer vacancies and softer asking-rent achievability than the comps imply.
- What's the recent tenant-quality profile in this submarket — average credit score on applications, eviction rate, late-payment / NSF rate, and stable-employment percentage? A property-management company in the area should have these aggregated.
- How much new for-sale + rental construction is in the pipeline within 1–3 miles? Heavy new supply typically softens prices + rents 12–24 months out; constrained supply supports both.
Investment metrics
- 1% rule
- 0.81% ✗
- Cap rate
- 5.71%
- Cash-on-cash
- -2.08%
- DSCR
- 0.91
- GRM
- 10.2
CMA / ARV
- ARV (median comp)
- $292,129
- List price
- $243,990
- Delta
- -16.48%
- Verdict
- UNDERPRICED
- Comps
- 20 within 1.0 mi
Show comp detail 12 sales within ~0.75 mi
| Address | Dist | Beds/Ba | Sqft | Sold | Price | $/sf | Match |
|---|---|---|---|---|---|---|---|
| 129 Greinert Dr | 0.03mi | 3/2.0 | 1,610 (-2%) | 1mo | $324,990 | $202 | 92 |
| 108 Greinert Dr | 0.07mi | 3/2.5 | 1,780 (+8%) | 6mo | $259,990 | $146 | 77 |
| 156 Hartson Dr | 0.10mi | 3/2.5 | 1,780 (+8%) | 9mo | $279,990 | $157 | 74 |
| 116 Greinert Dr | 0.06mi | 3/2.5 | 1,880 (+15%) | 3mo | $274,990 | $146 | 70 |
| 144 Hartson Dr | 0.08mi | 3/2.5 | 1,880 (+15%) | 9mo | $289,990 | $154 | 64 |
| 1503 Sherry Dr | 0.28mi | 4/2.0 (+1) | 1,794 (+9%) | 7mo | $349,000 | $195 | 59 |
| 109 Gunther Way | 0.73mi | 3/2.0 | 1,564 (-5%) | 1mo | $265,000 | $169 | 55 |
| 105 Onna St | 0.71mi | 3/2.0 | 1,743 (+6%) | 2mo | $319,500 | $183 | 52 |
| 1644 T H Johnson Dr | 0.56mi | 4/2.0 (+1) | 1,786 (+9%) | 2mo | $300,000 | $168 | 50 |
| 2100 Oaklawn Dr | 0.70mi | 4/2.0 (+1) | 1,532 (-7%) | 0mo | $315,000 | $206 | 49 |
| 3006 Greenlawn St | 0.69mi | 4/2.0 (+1) | 1,757 (+7%) | 5mo | $199,900 | $114 | 44 |
| 1944 T H Johnson Dr | 0.74mi | 4/2.0 (+1) | 1,783 (+9%) | 6mo | $299,500 | $168 | 39 |
Match score weights: distance 35% · size 25% · config 20% · recency 20%. Top-matched comps best support the ARV.
Projected returns pro-forma
-3.0% appreciation · 0.43% rent growth · sell at horizon
- IRR
- -22.6%
- Equity multiple
- 0.24×
- Total profit
- $-62,311
- Equity at exit
- $43,557
- IRR
- -25.2%
- Equity multiple
- -0.09×
- Total profit
- $-89,077
- Equity at exit
- $25,258
Cash invested: $81,796 (down + closing). Projections, not guarantees.
Landlord ↔ Tenant lean methodology
- Overall (STATE)
- 87 Strongly Landlord-Friendly
- State Texas
- 87 Strongly Landlord-Friendly · R+5
- County
- — inherits STATE
- City
- — inherits STATE
ZIP-level market 76574
- Home prices YoY
- -32.3%
- Rents YoY
- 0.4%
- Active inventory
- 314
- Price-to-rent
- 8.6×
Monthly cashflow live
- Estimated rent
- $2,376 high interval (Pro) →
- Mortgage (P&I)
- −$1,532
- Tax est. 1.5%
- −$365 /mo · $4,382/yr
- Insurance
- −$122
- HOA
- −$0
- Vacancy / Maint / Mgmt
- −$499
- Net cashflow
- $-142
Break-even live
UW: 25.0% down · 7.5% · 30yr · 1.5% tax · 5.0% vac · 8.0% maint · 8.0% mgmt
Financing live
Cash to close
- Down payment
- $73,032
- Closing costs
- $8,764
- Reserves months
- —
- Total cash needed
- —
Loan-product check · same deal, 3 products live
Conventional
25% down · 7.5% · 30yr
- Down + closing
- —
- Monthly P&I
- —
- Monthly cashflow
- —
- DSCR
- —
- Eligible?
- —
Personal DTI + credit; lowest rate.
DSCR
20% down · 8.5% · 30yr
- Down + closing
- —
- Monthly P&I
- —
- Monthly cashflow
- —
- DSCR
- —
- Eligible?
- —
No personal income docs; deal must DSCR.
Hard money
10% down · 12.0% · 12mo
- Down + closing
- —
- Monthly P&I
- —
- Monthly cashflow
- —
- DSCR
- —
- Eligible?
- —
Short-term bridge; refi at stabilization.
Rent comps 13 comps
| Address | Beds | Baths | Sqft | Rent | $/sqft | DOM | Units | Dist |
|---|---|---|---|---|---|---|---|---|
| 120 Hartson Dr Taylor, TX | 3.0 | 2.5 | 1806 | $1,925 | $1.07 | 4d | 1 | 0.03mi |
| 108 Hartson Dr Taylor, TX | 3.0 | 2.5 | 1806 | $1,850 | $1.02 | 14d | 1 | 0.03mi |
| 140 Hartson Dr Taylor, TX | 3.0 | 3.0 | 1780 | $2,100 | $1.18 | 43d | 1 | 0.05mi |
| 211 Tribute Blvd Unit Front Main Unit Taylor, TX | 3.0 | 3.0 | 1900 | $4,250 | $2.24 | 1d | 1 | 0.05mi |
| 124 Marcel Ct Taylor, TX | 3.0 | 2.0 | 1557 | $1,795 | $1.15 | 43d | 1 | 0.54mi |
| 180 Pivot Dr Taylor, TX | 4.0 | 3.0 | 1906 | $1,950 | $1.02 | 24d | 1 | 0.66mi |
| 120 Onna St Taylor, TX | 3.0 | 2.0 | 1734 | $2,150 | $1.24 | 3d | 1 | 0.68mi |
| 3004 Don Hill Ln Taylor, TX | 3.0 | 2.0 | 1184 | $2,800 | $2.36 | 10d | 1 | 0.77mi |
| 108 Pivot Dr Taylor, TX | 3.0 | 2.0 | 1605 | $1,800 | $1.12 | 22d | 1 | 0.78mi |
| 1006 Cottonbowl Dr Taylor, TX | 4.0 | 2.0 | 1615 | $2,300 | $1.42 | 43d | 1 | 0.83mi |
| 2109 Brewers Pl Taylor, TX | 3.0 | 2.0 | 1296 | $1,950 | $1.50 | 43d | 1 | 0.99mi |
| 2005 Whistling Way Taylor, TX | 4.0 | 2.5 | 2209 | $2,050 | $0.93 | 4d | 1 | 1.05mi |
| 1707 Lexington St Taylor, TX | 3.0 | 2.0 | 2140 | $2,500 | $1.17 | 24d | 1 | 1.49mi |
Listing history 22 events
-
2026-06-18days on market $243,990 Active 267 DOM
-
2026-06-17days on market $243,990 Active 266 DOM
-
2026-06-16days on market $243,990 Active 265 DOM
-
2026-06-15days on market $243,990 Active 264 DOM
-
2026-06-13days on market $243,990 Active 262 DOM
-
2026-06-09days on market $243,990 Active 258 DOM
-
2026-06-08days on market $243,990 Active 257 DOM
-
2026-06-07days on market $243,990 Active 256 DOM
-
2026-06-05days on market $243,990 Active 253 DOM
-
2026-06-03days on market $243,990 Active 252 DOM
-
2026-06-02days on market $243,990 Active 251 DOM
-
2026-06-01days on market $243,990 Active 250 DOM
-
2026-05-31days on market $243,990 Active 249 DOM
-
2026-04-01price $243,990 15-char remark
Show marketing remark (15 chars)
Spring - Barton
-
2026-03-03price $241,990 15-char remark
Show marketing remark (15 chars)
Spring - Barton
-
2026-01-01price $239,990 15-char remark
Show marketing remark (15 chars)
Spring - Barton
-
2025-12-03price $231,990 15-char remark
Show marketing remark (15 chars)
Spring - Barton
-
2025-10-31price $229,990 15-char remark
Show marketing remark (15 chars)
Spring - Barton
-
2025-10-30price $224,990 15-char remark
Show marketing remark (15 chars)
Spring - Barton
-
2025-10-30price $229,990 15-char remark
Show marketing remark (15 chars)
Spring - Barton
-
2025-09-28price $224,990 15-char remark
Show marketing remark (15 chars)
Spring - Barton
-
2025-09-24$279,990 Active 15-char remark
Show marketing remark (15 chars)
Spring - Barton
ⓘ Source: listings_history table (triggers on properties + properties_extension) + one-shot
backfill from property_details.listing_events for pre-trigger history.
Nearby sold comps map
Loading sold comps map…
Walkable amenities ~0.75 mi
Loading nearby amenities…
Taxation est. · year 1
- Rental income
- $28,515
- − Mortgage interest
- −$16,364
- − Property taxes
- −$4,382
- − Insurance
- −$1,461
- − Repairs & maintenance
- −$2,281
- − Management
- −$2,281
- − Depreciation
- −$8,498
- Taxable loss
- −$6,752
- Est. tax savings @ 24.0%
- +$1,620
- After-tax cash flow
- $-79/yr
For passive investors: Depreciation is non-cash, so a rental often shows a tax loss while cash-flowing — sheltering income. Rental losses are passive: they offset passive income freely, and up to $25,000/yr can offset ordinary (W-2) income if you actively participate and your MAGI is under $100k (phasing out to $0 by $150k); unused losses carry forward. On sale, claimed depreciation is recaptured at up to 25%, and gains may owe capital-gains tax (a 1031 exchange can defer both). Figures are a year-1 estimate at your 24.0% rate — not tax advice; consult a CPA.
Condition & rehab AI · 1 photo
The home is in good condition with a well-maintained exterior and interior. It has potential for cosmetic updates to enhance its curb appeal and value.
Value-add opportunities
- Both Painting the exterior and interior walls — Fresh paint can enhance the curb appeal and interior aesthetics, making the home more attractive to potential buyers and renters.
- Both Landscaping improvements — Enhancing the landscaping can improve the home's curb appeal and add value to the property.
- Both Kitchen and bathroom updates — Updating the kitchen and bathrooms can significantly increase the home's value and appeal to a broader range of potential buyers and renters.
Renovation cost estimate screening
Value-add ROI direction
- Both Painting the exterior and interior walls — Fresh paint can enhance the curb appeal and interior aesthetics, making the home more attractive to potential buyers and renters. ↑
- Both Landscaping improvements — Enhancing the landscaping can improve the home's curb appeal and add value to the property. ↑
- Both Kitchen and bathroom updates — Updating the kitchen and bathrooms can significantly increase the home's value and appeal to a broader range of potential buyers and renters. ↑
ⓘ Cost ranges are severity-bucket heuristics (US national rule-of-thumb). Get contractor quotes + a written scope before underwriting a rehab budget.
Schools (NCES district)
- District
- Taylor ISD
- NCES district ID
- 4842280
- Math proficiency
- 20% ▼ -15.00%
- Reading proficiency
- 27% ▼ -11.00%
- Median HH income
- $45,330
- Composite
- 20.35/100
- National rank
- #8606
- State rank
- #726 of 826 in TX
Livability — Taylor
- Score
- 71/100
- State rank
- #312
- US rank
- #7013
Category grades
Schools grade is shown separately in the Schools card above.
Census & demographics
- Census place
- Taylor, TX
- County
- Williamson County · 680,029 people
- City population
- 20,242
- Metro
- Austin-Round Rock-Georgetown, TX
- Population (ZIP)
- 20,242
- Household income
- $78,568
- Rent vs Own
- Severe rent burden
- 371.0
Population outlook (Williamson County) Hauer SSP2
- Today (2025)
- 699,027 people
- By 2030
- 795,537 · +13.8%
- By 2040
- 990,683 · +41.7%
- By 2050
- 1,184,292 · +69.4%
- By 2075
- 1,623,825 · +132.3%
- By 2100
- 1,924,153 · +175.3%
Race, ethnicity, and origin ACS 2023
- Neighborhood character
- Diverse neighborhood (Simpson 0.57)
- Race & ethnicity
- White 50% Hispanic / Latino 42% Two or more races 22% Black 5%
- Hispanic origin (detail)
- Mexican 37%
- Common ancestry
- Romanian 2% Italian 1% Lithuanian 1%
- Foreign-born
- 8% · Canada
- Languages at home
- 74% English-only · Spanish 23% Russian/Polish/Slavic 1%
Political lean MEDSL · Williamson
- 2024 margin
- Toss-up / Even · D 48.0% · R 50.4% · Other 1.6%
- 2008→2024 swing
- +10.6pp toward D · 2008: -13.0pp · 2024: -2.5pp
- All cycles
- 2024: R+2.5 2020: D+1.4 2016: R+9.9 2012: R+21.5 2008: R+13.0
Not yet ingested
- Civics
- —
Market trends
- HPI YoY
- ▼ -108.71%
- Current HPI
- 227.58
- Rent YoY
- ▲ 0.43%
- Metro
- Austin-Round Rock-Georgetown, TX
- State GDP YoY
- ▲ 3.95%
- F500 in state
- 110
Industry mix (Fortune 500 HQ in TX)
| Industry | F500 HQs | Revenue |
|---|---|---|
| Energy | 16 | $1,198B |
|
||
| Technology | 5 | $198B |
|
||
| Engineering / Construction | 4 | $72B |
|
||
| Energy Services | 3 | $60B |
|
||
| Utilities | 3 | $41B |
|
||
| Healthcare | 2 | $330B |
|
||
Price history
-12.9% since first listed9 events — show timeline
- 2026-04-01 Price Changed $243,990 Zillow
- 2026-03-03 Price Changed $241,990 Zillow
- 2026-01-01 Price Changed $239,990 Zillow
- 2025-12-03 Price Changed $231,990 Zillow
- 2025-10-31 Price Changed $229,990 Zillow
- 2025-10-30 Price Changed $224,990 Zillow
- 2025-10-30 Price Changed $229,990 Zillow
- 2025-09-28 Price Changed $224,990 Zillow
- 2025-09-24 Listed $279,990 Zillow
Cash-flow waterfall
monthlySold comps — $/sqft
last 12 mo · ≤1 miLoading sold comps…