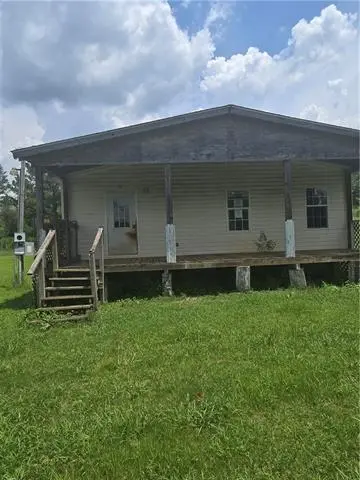
130 Cherry Dr · Fisher, LA
Flood risk 1/10 · Minimal
- FEMA flood zone
- X
- Chance of flooding over 30 yrs
- 0.0%
- Est. flood insurance / yr
- $507 – $1,088
Fire risk 5/10 · Moderate
- Est. fire insurance / yr
- $1,269 – $2,357
Heat risk 7/10 · Major
- Hot days now (above 110°F)
- 7 days/yr
- Hot days in 30 yrs
- 21 days/yr
Wind risk 8/10 · Major
- Chance of severe wind over 30 yrs
- 80.0%
Air-quality risk 1/10 · Minimal
- Unhealthy air days now
- 0 days/yr
- Unhealthy air days in 30 yrs
- 0 days/yr
Risk factors via First Street. Map © Google.
Why this score? — see what drove the C- grade
The composite is a weighted blend of 9 inputs, each scored 0–100. Each bar is that input's sub-score; the figure is the points it added to the 100-point composite (weight × sub-score).
- Cash flow +21.9/30.0
- ARV discount +7.5/15.0
- DSCR +7.0/10.0
- 1% rule +4.6/10.0
- Schools +2.7/10.0
- Livability +2.6/5.0
- Rent growth +2.5/5.0
- Condition / age +2.5/5.0
- Appreciation +0.0/10.0
$117,400
🖨 Deal sheet (PDF) 📄 Offer letter ✓ Due diligence
Listing remarks
Are you looking for a home with land in a country setting? Stop, and look no further. 3 bedroom/ 2 bath Manufactured home for sale sitting on 20 acres of land. Lots of potential, make this your forever home. Property will be sold "AS IS, and WHERE IS, WITH ALL FAULTS. No warranties express , implied or arising from operation of law.
Key facts
- 20 acre lot
- Built 2007
Property features AI
Exterior
- Home design: Manufactured home
- Construction: Vinyl siding; Composition roof
- Exterior features: Acreage; No fencing
Interior
- Kitchen: Dishwasher; Refrigerator
- Bedrooms: Bedroom 1; Bedroom 2
- Bathrooms: 2 full bathrooms
- Heating & cooling: Central heating; Central air conditioning
- Interior features: Living room; Dining room; Kitchen; Bathroom; Bedroom 1; Bedroom 2; Wood-burning fireplace
Neighborhood map
What this means for you Summary
Snapshot
- This is a 3-bed/2.0-bath single-family listed at $117k.
Deal economics
- At list price, monthly cash flow is $184 ($2k/yr) — positive.
- The deal already cash-flows at list — no discount required.
- To meet the 1% rule (rent ≥ 1% of price), the offer needs to be $113k (4.1% below list).
- Recommended offer: $113k (4.1% below list) — sets the bar for 1% rule.
Location & tenants
- Location reads 52/100 on livability (#413 in LA) — a working-class tenant base; expect higher turnover. Strengths: cost of living A+, housing B+; Watch: health & safety C-, schools F, crime F.
- Sabine Parish (rural): math 27% / reading 39% proficiency, ranked #40 of 98 in LA (top 41%) — families likely to look elsewhere, expect single-tenant / working-renter base with shorter leases; 64% free/reduced lunch — lower-income household profile, screen leases tightly.
- Market conditions: 32 active listings in the ZIP; 49 units permitted in Sabine Parish in 2024 (0 in 5+ unit buildings).
Forward outlook
- Local home prices are declining (-3.0%/yr); year-one equity from $812 of loan paydown is wiped out by about $4k of value loss. Plan a longer hold.
- Sabine County population projected to shrink 7% by 2050 — rents likely to lag national; underwrite the cash flow, not the appreciation.
Negotiation context
- Only 1 days on market — expect competitive offers; lowballing is unlikely to land.
- 2 sale attempts with the ask held roughly flat each time — persistent listings suggest the price (not the market) is what's stuck; bring a comps-based counter.
- Current owner paid $3k; list at $117k implies a 3813% gain — meaningful room to come down on a strong offer.
Risks & watch-outs
- Climate carrying-cost: severe wind risk, 80% chance of damaging wind over 30y; moderate wildfire risk; extreme-heat days projected 7→21/yr by 2055 (HVAC capex compounding) — expect insurance premiums to compound above CPI over the hold.
Questions for the listing agent
- Is there a deadline driving the sale (1031 exchange, divorce, estate, relocation)? That informs how much negotiation room exists.
- Schools are F-rated, which usually means shorter tenancies and higher turnover. Who's the typical renter profile here, and what's been the actual vacancy rate?
- Crime grade is F in this area — have there been break-ins, vandalism, or insurance claims at this property in the last 3 years? What carrier currently insures it and at what premium?
- What's the average days-on-market for RENTAL listings here right now (not sales)? A rising rental-DOM trend means longer vacancies and softer asking-rent achievability than the comps imply.
- What's the recent tenant-quality profile in this submarket — average credit score on applications, eviction rate, late-payment / NSF rate, and stable-employment percentage? A property-management company in the area should have these aggregated.
- How much new for-sale + rental construction is in the pipeline within 1–3 miles? Heavy new supply typically softens prices + rents 12–24 months out; constrained supply supports both.
Investment metrics
- 1% rule
- 0.96% ✗
- Cap rate
- 8.18%
- Cash-on-cash
- 6.73%
- DSCR
- 1.30
- GRM
- 8.7
CMA / ARV
No comps found within radius.
Projected returns pro-forma
-3.0% appreciation · 3.0% rent growth · sell at horizon
- IRR
- -6.0%
- Equity multiple
- 0.78×
- Total profit
- $-7,331
- Equity at exit
- $17,505
- IRR
- 3.6%
- Equity multiple
- 1.26×
- Total profit
- $8,540
- Equity at exit
- $10,151
Cash invested: $32,872 (down + closing). Projections, not guarantees.
Landlord ↔ Tenant lean methodology
- Overall (STATE)
- 90 Strongly Landlord-Friendly
- State Louisiana
- 90 Strongly Landlord-Friendly · R+12
- County
- — inherits STATE
- City
- — inherits STATE
ZIP-level market 71449
- Active inventory
- 32
- Price-to-rent
- 8.7×
Monthly cashflow live
- Estimated rent
- $1,126 medium interval (Pro) →
- Mortgage (P&I)
- −$616
- Tax from tax record
- −$41 /mo · $487/yr
- Insurance
- −$49
- HOA
- −$0
- Vacancy / Maint / Mgmt
- −$236
- Net cashflow
- $184
Break-even live
Sensitivity live
| Price | -10% $251 | -5% $218 | +0% $184 | +5% $151 | +10% $118 |
|---|---|---|---|---|---|
| Rent | -10% $95 | -5% $140 | +0% $184 | +5% $229 | +10% $273 |
| Rate | -1.0pp $243 | -0.5pp $214 | base $184 | +0.5pp $154 | +1.0pp $123 |
UW: 25.0% down · 7.5% · 30yr · 1.5% tax · 5.0% vac · 8.0% maint · 8.0% mgmt
Financing live
Cash to close
- Down payment
- $29,350
- Closing costs
- $3,522
- Reserves months
- —
- Total cash needed
- —
Loan-product check · same deal, 3 products live
Conventional
25% down · 7.5% · 30yr
- Down + closing
- —
- Monthly P&I
- —
- Monthly cashflow
- —
- DSCR
- —
- Eligible?
- —
Personal DTI + credit; lowest rate.
DSCR
20% down · 8.5% · 30yr
- Down + closing
- —
- Monthly P&I
- —
- Monthly cashflow
- —
- DSCR
- —
- Eligible?
- —
No personal income docs; deal must DSCR.
Hard money
10% down · 12.0% · 12mo
- Down + closing
- —
- Monthly P&I
- —
- Monthly cashflow
- —
- DSCR
- —
- Eligible?
- —
Short-term bridge; refi at stabilization.
Listing history 8 events
-
2026-05-06status Pending
-
2026-05-05$117,400 Active
-
2026-04-08price $117,400
-
2026-03-05price $123,400
-
2025-12-30price $128,400
-
2025-10-22price $129,400
-
2025-08-24$144,900 Active
-
2007-11-20soldstatus $3,000
ⓘ Source: listings_history table (triggers on properties + properties_extension) + one-shot
backfill from property_details.listing_events for pre-trigger history.
Tax reassessment forecast LA · Resets to sale price
- Current annual tax
- $487 · $41/mo
- Projected year-2 tax
- $646 · $54/mo
- Expected delta
- +$158/yr (+$13/mo · 32.5%)
ⓘ Screening estimate from a state-policy table — verify with the county assessor before closing.
Climate risk First Street
- Flood 1/10 Low FEMA zone X · 0% chance over 30 yrs
- Wildfire 5/10 Major
- Heat 7/10 Severe 7 d/yr ≥110°F today · 21 d/yr by 30 yrs out
- Wind 8/10 Severe 80% chance of damaging wind over 30 yrs
- Air quality 1/10 Low 0 unhealthy d/yr today · 0 by 30 yrs out
Nearby sold comps map
Loading sold comps map…
Walkable amenities ~0.75 mi
Loading nearby amenities…
Taxation est. · year 1
- Rental income
- $13,512
- − Mortgage interest
- −$6,576
- − Property taxes
- −$487
- − Insurance
- −$587
- − Repairs & maintenance
- −$1,081
- − Management
- −$1,081
- − Depreciation
- −$3,415
- Taxable income
- $284
- Est. tax owed @ 24.0%
- −$68
- After-tax cash flow
- $2,144/yr
For passive investors: Depreciation is non-cash, so a rental often shows a tax loss while cash-flowing — sheltering income. Rental losses are passive: they offset passive income freely, and up to $25,000/yr can offset ordinary (W-2) income if you actively participate and your MAGI is under $100k (phasing out to $0 by $150k); unused losses carry forward. On sale, claimed depreciation is recaptured at up to 25%, and gains may owe capital-gains tax (a 1031 exchange can defer both). Figures are a year-1 estimate at your 24.0% rate — not tax advice; consult a CPA.
Schools (NCES district)
- District
- Sabine Parish
- NCES district ID
- 2201380
- Math proficiency
- 27% ▼ -38.00%
- Reading proficiency
- 39% ▼ -35.00%
- Median HH income
- $37,017
- Composite
- 27.41/100
- National rank
- #6970
- State rank
- #40 of 98 in LA
Livability — Fisher
- Score
- 52/100
- State rank
- #413
- US rank
- #25058
Category grades
Schools grade is shown separately in the Schools card above.
Census & demographics
- City population
- 123
- Population (ZIP)
- 8,818
Population outlook (Sabine County) Hauer SSP2
- Today (2025)
- 23,820 people
- By 2030
- 23,505 · -1.3%
- By 2040
- 22,885 · -3.9%
- By 2050
- 22,235 · -6.7%
- By 2075
- 20,257 · -15.0%
- By 2100
- 17,348 · -27.2%
Race, ethnicity, and origin ACS 2023
- Neighborhood character
- Predominantly White (70%)
- Race & ethnicity
- White 70% Black 18% Two or more races 9% Hispanic / Latino 2% Native American 2%
- Common ancestry
- Lithuanian 6% Romanian 1% Italian 1%
- Foreign-born
- 1%
- Languages at home
- 97% English-only · French/Haitian/Cajun 2% Spanish 1%
Political lean MEDSL · Sabine
- 2024 margin
- Solid R (+70.1) · D 14.6% · R 84.7%
- 2008→2024 swing
- -18.5pp toward R · 2008: -51.6pp · 2024: -70.1pp
- All cycles
- 2024: R+70.1 2020: R+66.5 2016: R+63.1 2012: R+55.1 2008: R+51.6
Not yet ingested
- Civics
- —
Market trends
- HPI YoY
- ▼ -127.77%
- Current HPI
- 114.4327
- Rent YoY
- —
- Metro
- —
- State GDP YoY
- ▲ 3.29%
- F500 in state
- 10
Industry mix (Fortune 500 HQ in LA)
| Industry | F500 HQs | Revenue |
|---|---|---|
| Telecommunications | 2 | $23B |
|
||
| Utilities | 1 | $12B |
|
||
| Wholesale / Distribution | 1 | $5B |
|
||
| Advertising | 1 | $2B |
|
||
Price history
+3813.3% since first listed8 events — show timeline
- 2026-05-06 Pending — AcadianaMLS
- 2026-05-05 Listed $117,400 AcadianaMLS
- 2026-04-08 Price Changed $117,400 AcadianaMLS
- 2026-03-05 Price Changed $123,400 AcadianaMLS
- 2025-12-30 Price Changed $128,400 AcadianaMLS
- 2025-10-22 Price Changed $129,400 AcadianaMLS
- 2025-08-24 Listed $144,900 AcadianaMLS
- 2007-11-20 Sold (Public Records) $3,000 Public Records
Property tax history
+0.5%/yrLatest (2025): $487 · -6.0% YoY. Source: county tax records.
Cash-flow waterfall
monthlySold comps — $/sqft
last 12 mo · ≤1 miLoading sold comps…