 Duplex
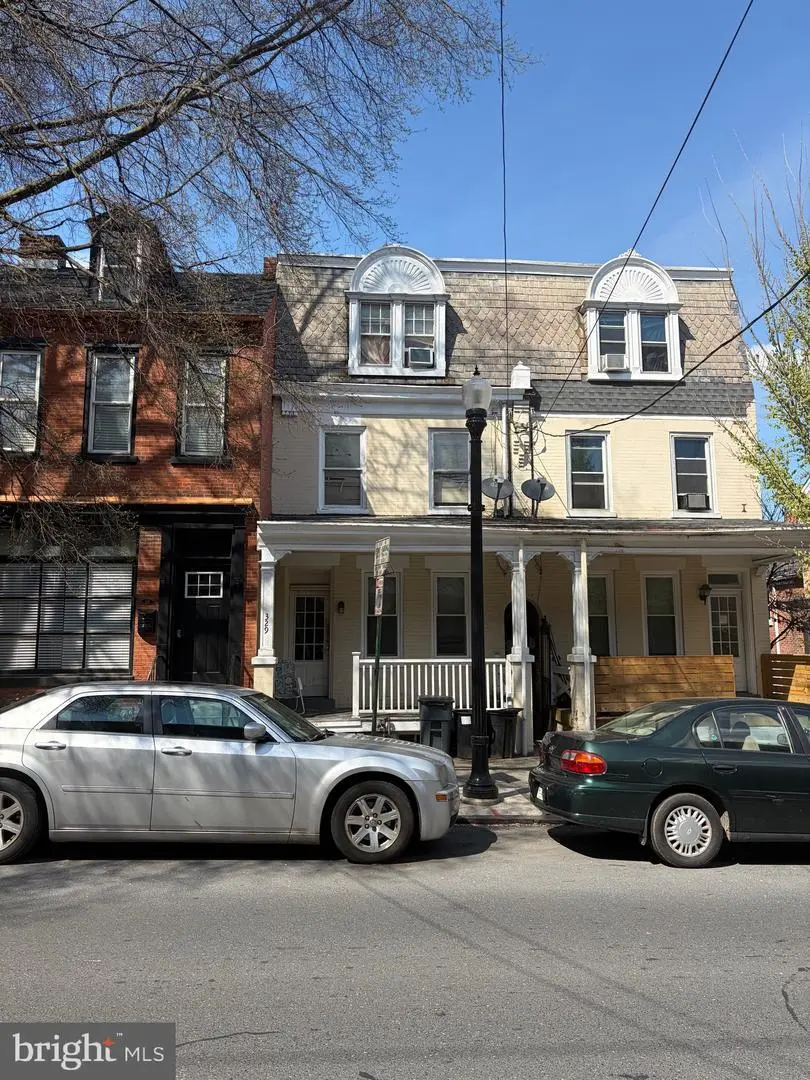
329 W King St · Lancaster, PA
Flood risk 1/10 · Minimal
- FEMA flood zone
- X (unshaded)
- Chance of flooding over 30 yrs
- 0.0%
- Est. flood insurance / yr
- $473 – $860
Fire risk 1/10 · Minimal
- Est. fire insurance / yr
- $511 – $949
Heat risk 6/10 · Moderate
- Hot days now (above 101°F)
- 7 days/yr
- Hot days in 30 yrs
- 15 days/yr
Wind risk 4/10 · Minor
- Chance of severe wind over 30 yrs
- 16.0%
Air-quality risk 4/10 · Minor
- Unhealthy air days now
- 4 days/yr
- Unhealthy air days in 30 yrs
- 7 days/yr
Risk factors via First Street. Map © Google.
Why this score? — see what drove the C+ grade
The composite is a weighted blend of 9 inputs, each scored 0–100. Each bar is that input's sub-score; the figure is the points it added to the 100-point composite (weight × sub-score).
- Cash flow +25.9/30.0
- ARV discount +9.1/15.0
- DSCR +8.7/10.0
- 1% rule +6.9/10.0
- Livability +4.2/5.0
- Rent growth +2.6/5.0
- Condition / age +2.5/5.0
- Schools +1.6/10.0
- Appreciation +0.0/10.0
$289,900
🖨 Deal sheet (PDF) 📄 Offer letter ✓ Due diligence
Multi-family units
County records classify this as Multi-Family (2-4 Unit). Listing-text estimate: 2 units. confirmed
Listing remarks MLS
24 hour notice needed for showings. 2-unit property located on W King Street within walking distance to downtown Lancaster. The property has recently passed all city inspections and includes a lead-based paint certification. Unit 1 is a 2 bedroom, 1 full bath. Unit 2 is a 4 bedroom, 2 full bath, offering strong potential for rental income. Laundry is located in the basement. The basement and backyard are shared common areas for tenants. Property is set up for immediate rental use with required certifications already in place. CALL TODAY!
Key facts
- 2,178 sq ft lot
- Built 1900
- Listed 23 days
Neighborhood map
What this means for you Summary
Snapshot
- This is a 1×2bd/1ba + 1×4bd/2ba units multifamily listed at $290k.
Deal economics
- At list price, monthly cash flow is $710 ($9k/yr) — positive. Per door: $355/mo.
- The deal already cash-flows at list — no discount required.
- Meets the 1% rule at list price ($3k rent vs $290k).
- Recommended offer: $286k (1.5% below list) — sets the bar for market timing.
- Cap rate 9.2% vs local median 4.2% in Lancaster — top-decile yield for the area; either an underpriced asset or a hidden risk that comps aren't pricing in. Stress-test before assuming the spread holds.
Location & tenants
- Location reads 85/100 on livability (#71 in PA, #498 nationally) — a professional / high-income tenant draw. Strengths: amenities A+, commute A+, cost of living A+; Watch: crime C-, employment C-.
- Lancaster SD (urban): math 12% / reading 25% proficiency, ranked #500 of 539 in PA (top 93%) — low school quality limits family demand, transient renter base, plan for 1-2y turnover; 72% free/reduced lunch — lower-income household profile, screen leases tightly.
- Market conditions: Rents flat; 292 active listings in the ZIP; 16 comparable units currently listed for rent nearby; rentals lingering (median 45d on market — plan ~5-8 weeks vacancy on turnover, expect pricing pressure); 50% of comp listings sitting > 30 days — soft ceiling on asking rent; solid renter incomes; 1,093 units permitted in Lancaster County in 2024 (201 in 5+ unit buildings).
- At $3,456/mo this rent would consume 54% of the median local household income ($77k/yr) (locally 2557% of renters already pay >50% of income on rent) — very limited rent-growth headroom before tenants either downsize or default.
Forward outlook
- Local home prices are declining (-3.0%/yr); year-one equity from $2k of loan paydown is wiped out by about $9k of value loss. Plan a longer hold.
- Lancaster County population projected at +5% by 2050 — modest demand growth; plan on rents tracking national, not racing it.
Negotiation context
- It's been on market 23 days — a 2% lower offer ($286k) is reasonable based on typical stale-listing flexibility.
- 7 sale attempts since 21y ago with the ask held roughly flat each time — persistent listings suggest the price (not the market) is what's stuck; bring a comps-based counter.
- Current owner paid $151k; list at $290k implies a 92% gain — meaningful room to come down on a strong offer.
Risks & watch-outs
- Watch-outs: built in 1900 — expect roof / HVAC / electrical / plumbing capex.
- Climate carrying-cost: extreme-heat days projected 7→15/yr by 2055 (HVAC capex compounding) — expect insurance premiums to compound above CPI over the hold.
Questions for the listing agent
- Can we see the unit-by-unit rent roll, current vacancy, and any below-market leases? What's the average tenancy length?
- What capital expenditures (roof, boiler, parking lot, exteriors) have been made in the last 5 years, and what's planned in the next 2?
- Built in 1900 — when were the roof, HVAC, electrical panel, plumbing, and water heater last replaced?
- Is there a deadline driving the sale (1031 exchange, divorce, estate, relocation)? That informs how much negotiation room exists.
- What's the average days-on-market for RENTAL listings here right now (not sales)? A rising rental-DOM trend means longer vacancies and softer asking-rent achievability than the comps imply.
- What's the recent tenant-quality profile in this submarket — average credit score on applications, eviction rate, late-payment / NSF rate, and stable-employment percentage? A property-management company in the area should have these aggregated.
- How much new apartment / multifamily construction is in the pipeline within 1–3 miles? Heavy new supply (>2% of stock underway) typically softens rents 12–24 months out; light construction supports rent growth.
Investment metrics
- 1% rule
- 1.19% ✓
- Cap rate
- 9.23%
- Cash-on-cash
- 10.50%
- DSCR
- 1.47
- GRM
- 7.0
CMA / ARV
- ARV (median comp)
- $300,825
- List price
- $289,900
- Delta
- -3.63%
- Verdict
- FAIR
- Comps
- 20 within 1.0 mi
Show comp detail 12 sales within ~0.75 mi
| Address | Dist | Beds/Ba | Sqft | Sold | Price | $/sf | Match |
|---|---|---|---|---|---|---|---|
| 329 W King St | 0.00mi | 4/— | 2,149 (0%) | 1mo | $270,000 | $126 | 99 |
| 503-505 Manor St | 0.19mi | 4/3.0 | 2,056 (-4%) | 1mo | $355,000 | $173 | 80 |
| 348 S Queen St | 0.53mi | 4/2.0 | 2,080 (-3%) | 2mo | $229,900 | $111 | 69 |
| 751 High St | 0.54mi | 5/— (+1) | 2,152 (+0%) | 2mo | $383,500 | $178 | 68 |
| 642 Second St | 0.46mi | 4/— | 2,013 (-6%) | 4mo | $270,000 | $134 | 65 |
| 411-413 S Arch St | 0.24mi | 5/— (+1) | 1,896 (-12%) | 1mo | $230,500 | $122 | 64 |
| 747-749 Manor St | 0.52mi | 4/3.0 | 2,048 (-5%) | 2mo | $335,000 | $164 | 62 |
| 662 Saint Joseph St | 0.43mi | 5/2.0 (+1) | 1,941 (-10%) | 2mo | $290,000 | $149 | 57 |
| 102 Ruby St | 0.47mi | 4/3.0 | 2,379 (+11%) | 1mo | $300,000 | $126 | 55 |
| 409 S Shippen St | 0.72mi | 4/— | 1,900 (-12%) | 2mo | $380,000 | $200 | 46 |
| 405 S Shippen St | 0.71mi | 4/— | 1,880 (-12%) | 4mo | $292,000 | $155 | 42 |
| 432 S Queen St | 0.61mi | 5/2.0 (+1) | 1,827 (-15%) | 3mo | $245,000 | $134 | 39 |
Match score weights: distance 35% · size 25% · config 20% · recency 20%. Top-matched comps best support the ARV.
Projected returns pro-forma
-3.0% appreciation · 0.47% rent growth · sell at horizon
- IRR
- -3.5%
- Equity multiple
- 0.87×
- Total profit
- $-10,248
- Equity at exit
- $43,225
- IRR
- 3.1%
- Equity multiple
- 1.20×
- Total profit
- $16,121
- Equity at exit
- $25,065
Cash invested: $81,172 (down + closing). Projections, not guarantees.
Landlord ↔ Tenant lean methodology
- Overall (STATE)
- 62 Landlord-Friendly
- State Pennsylvania
- 62 Landlord-Friendly · EVEN
- County
- — inherits STATE
- City
- — inherits STATE
ZIP-level market 17603
- Rents YoY
- 0.5%
- Active inventory
- 292
- Price-to-rent
- 14.4×
Monthly cashflow live
- Estimated rent
- $3,456 high interval (Pro) →
- Mortgage (P&I)
- −$1,520
- Tax from tax record
- −$379 /mo · $4,545/yr
- Insurance
- −$121
- HOA
- −$0
- Vacancy / Maint / Mgmt
- −$726
- Net cashflow
- $710
Break-even live
Sensitivity live
| Price | -10% $875 | -5% $792 | +0% $710 | +5% $628 | +10% $546 |
|---|---|---|---|---|---|
| Rent | -10% $437 | -5% $574 | +0% $710 | +5% $847 | +10% $983 |
| Rate | -1.0pp $856 | -0.5pp $784 | base $710 | +0.5pp $635 | +1.0pp $559 |
2-unit breakdown (identical units grouped — click to expand)
| Units | Beds | Baths | Est. rent |
|---|---|---|---|
| 1× unit | 2 | 1 | $1,677 |
| 1× unit | 4 | 2 | $1,779 |
| Total (2 units) | $3,456 | ||
UW: 25.0% down · 7.5% · 30yr · 1.5% tax · 5.0% vac · 8.0% maint · 8.0% mgmt
Financing live
Cash to close
- Down payment
- $72,475
- Closing costs
- $8,697
- Reserves months
- —
- Total cash needed
- —
Loan-product check · same deal, 3 products live
Conventional
25% down · 7.5% · 30yr
- Down + closing
- —
- Monthly P&I
- —
- Monthly cashflow
- —
- DSCR
- —
- Eligible?
- —
Personal DTI + credit; lowest rate.
DSCR
20% down · 8.5% · 30yr
- Down + closing
- —
- Monthly P&I
- —
- Monthly cashflow
- —
- DSCR
- —
- Eligible?
- —
No personal income docs; deal must DSCR.
Hard money
10% down · 12.0% · 12mo
- Down + closing
- —
- Monthly P&I
- —
- Monthly cashflow
- —
- DSCR
- —
- Eligible?
- —
Short-term bridge; refi at stabilization.
Rent comps 16 comps
| Address | Beds | Baths | Sqft | Rent | $/sqft | DOM | Units | Dist |
|---|---|---|---|---|---|---|---|---|
| 118 N Prince St Lancaster, PA | 1.0–3.0 | 1.0–3.0 | 1274 | $4,703 | $3.69 | 14d | 48 | 0.23mi |
| 529 Manor St Lancaster, PA | 3.0 | 1.0 | 1434 | $1,635 | $1.14 | 14d | 1 | 0.24mi |
| 49 W Farnum St Lancaster, PA | 3.0 | 1.0 | 1820 | $1,650 | $0.91 | 44d | 1 | 0.35mi |
| 609 Saint Joseph St Lancaster, PA | 4.0 | 2.0 | 1523 | $1,695 | $1.11 | 44d | 1 | 0.36mi |
| 337 W Lemon St Unit 2 Lancaster, PA | 3.0 | 1.0 | 1588 | $1,895 | $1.19 | 14d | 1 | 0.41mi |
| 403 N Queen St Lancaster, PA | 3.0 | 2.0 | 1950 | $3,500 | $1.79 | 14d | 1 | 0.53mi |
| 549 Howard Ave Lancaster, PA | 4.0 | 1.0 | 1439 | $1,700 | $1.18 | 44d | 1 | 0.55mi |
| 520 W Frederick St Lancaster, PA | 4.0 | 1.0 | 1713 | $1,895 | $1.11 | 44d | 1 | 0.62mi |
| 611 S West End Ave Lancaster, PA | 4.0 | 1.5 | 1589 | $1,800 | $1.13 | 14d | 1 | 0.80mi |
| 860 N Market St Lancaster, PA | 3.0 | 2.0 | 1514 | $1,850 | $1.22 | 44d | 1 | 0.94mi |
| 708 S Lime St Unit 3 Lancaster, PA | 4.0 | 1.0 | 1742 | $1,850 | $1.06 | 44d | 1 | 0.96mi |
| 1121 Spring Grove Ave Lancaster, PA | 4.0 | 2.0 | 1755 | $2,200 | $1.25 | 44d | 1 | 0.99mi |
| 836 N Plum St Lancaster, PA | 3.0 | 2.0 | 1602 | $2,150 | $1.34 | 14d | 1 | 1.15mi |
| 631 E Frederick St Lancaster, PA | 3.0 | 1.0 | 1830 | $1,850 | $1.01 | 44d | 1 | 1.24mi |
| 1415 Spencer Ave Lancaster, PA | 1.0–3.0 | 1.0–2.0 | 1181 | $3,720 | $3.15 | 14d | 1 | 1.32mi |
| 1330 Wabank Rd Lancaster, PA | 1.0–3.0 | 1.0–2.5 | 1423 | $2,062 | $1.45 | 14d | 21 | 1.44mi |
Listing history 21 events
-
2026-05-06status Pending 543-char remark
Show marketing remark (543 chars)
24 hour notice needed for showings. 2-unit property located on W King Street within walking distance to downtown Lancaster. The property has recently passed all city inspections and includes a lead-based paint certification. Unit 1 is a 2 bedroom, 1 full bath. Unit 2 is a 4 bedroom, 2 full bath, offering strong potential for rental income. Laundry is located in the basement. The basement and backyard are shared common areas for tenants. Property is set up for immediate rental use with required certifications already in place. CALL TODAY!
-
2026-04-14$289,900 Active 543-char remark
Show marketing remark (543 chars)
24 hour notice needed for showings. 2-unit property located on W King Street within walking distance to downtown Lancaster. The property has recently passed all city inspections and includes a lead-based paint certification. Unit 1 is a 2 bedroom, 1 full bath. Unit 2 is a 4 bedroom, 2 full bath, offering strong potential for rental income. Laundry is located in the basement. The basement and backyard are shared common areas for tenants. Property is set up for immediate rental use with required certifications already in place. CALL TODAY!
-
2026-04-01historical $289,900 543-char remark
Show marketing remark (543 chars)
24 hour notice needed for showings. 2-unit property located on W King Street within walking distance to downtown Lancaster. The property has recently passed all city inspections and includes a lead-based paint certification. Unit 1 is a 2 bedroom, 1 full bath. Unit 2 is a 4 bedroom, 2 full bath, offering strong potential for rental income. Laundry is located in the basement. The basement and backyard are shared common areas for tenants. Property is set up for immediate rental use with required certifications already in place. CALL TODAY!
-
2020-02-19soldstatus $151,000
-
2020-02-18soldstatus $151,000 Closed 78-char remark
Show marketing remark (78 chars)
Two unit in West End, separate utilities. Tenant pays heat, electric, and gas.
-
2020-01-06status Pending 78-char remark
Show marketing remark (78 chars)
Two unit in West End, separate utilities. Tenant pays heat, electric, and gas.
-
2019-12-17$150,000 Active 78-char remark
Show marketing remark (78 chars)
Two unit in West End, separate utilities. Tenant pays heat, electric, and gas.
-
2014-03-29historical
-
2014-03-28soldstatus $110,000
-
2013-07-13$114,900
-
2013-01-01historical
-
2011-01-25$115,000
-
2010-12-31historical
-
2010-05-18$129,900
-
2010-01-08soldstatus $70,000
-
2009-12-22historical
-
2009-11-25$78,900
-
2007-10-26soldstatus $97,000
-
2006-01-01historical
-
2005-08-03$64,900
-
1985-04-30soldstatus $78,000
ⓘ Source: listings_history table (triggers on properties + properties_extension) + one-shot
backfill from property_details.listing_events for pre-trigger history.
Tax reassessment forecast PA · Partial reset (capped growth)
- Current annual tax
- $4,545 · $379/mo
- Projected year-2 tax
- $4,563 · $380/mo
- Expected delta
- +$18/yr (+$1/mo · 0.4%)
ⓘ Screening estimate from a state-policy table — verify with the county assessor before closing.
Climate risk First Street
- Flood 1/10 Low FEMA zone X (unshaded) · 0% chance over 30 yrs
- Wildfire 1/10 Low
- Heat 6/10 Major 7 d/yr ≥101°F today · 15 d/yr by 30 yrs out
- Wind 4/10 Moderate 16% chance of damaging wind over 30 yrs
- Air quality 4/10 Moderate 4 unhealthy d/yr today · 7 by 30 yrs out
Nearby sold comps map
Loading sold comps map…
Walkable amenities ~0.75 mi
Loading nearby amenities…
Taxation est. · year 1
- Rental income
- $41,472
- − Mortgage interest
- −$16,239
- − Property taxes
- −$4,545
- − Insurance
- −$1,450
- − Repairs & maintenance
- −$3,318
- − Management
- −$3,318
- − Depreciation
- −$8,433
- Taxable income
- $4,170
- Est. tax owed @ 24.0%
- −$1,001
- After-tax cash flow
- $7,524/yr
For passive investors: Depreciation is non-cash, so a rental often shows a tax loss while cash-flowing — sheltering income. Rental losses are passive: they offset passive income freely, and up to $25,000/yr can offset ordinary (W-2) income if you actively participate and your MAGI is under $100k (phasing out to $0 by $150k); unused losses carry forward. On sale, claimed depreciation is recaptured at up to 25%, and gains may owe capital-gains tax (a 1031 exchange can defer both). Figures are a year-1 estimate at your 24.0% rate — not tax advice; consult a CPA.
Schools (NCES district)
- District
- Lancaster SD
- NCES district ID
- 4213140
- Math proficiency
- 12% ▼ -10.00%
- Reading proficiency
- 25% ▼ -13.00%
- Median HH income
- $38,500
- Composite
- 15.52/100
- National rank
- #9301
- State rank
- #500 of 539 in PA
Livability — Lancaster
- Score
- 85/100
- State rank
- #71
- US rank
- #498
Category grades
Schools grade is shown separately in the Schools card above.
Census & demographics
- Census place
- Lancaster, PA
- County
- Lancaster County · 390,309 people
- City population
- 1,171
- Metro
- Lancaster, PA
- Population (ZIP)
- 67,571
- Household income
- $77,084
- Rent vs Own
- Severe rent burden
- 2557.0
Population outlook (Lancaster County) Hauer SSP2
- Today (2025)
- 561,011 people
- By 2030
- 570,969 · +1.8%
- By 2040
- 585,929 · +4.4%
- By 2050
- 591,056 · +5.4%
- By 2075
- 594,747 · +6.0%
- By 2100
- 558,850 · -0.4%
Race, ethnicity, and origin ACS 2023
- Neighborhood character
- Diverse neighborhood (Simpson 0.59)
- Race & ethnicity
- White 58% Hispanic / Latino 27% Two or more races 12% Black 7% Asian 4%
- Hispanic origin (detail)
- Mexican 1% Puerto Rican 19% Cuban 1% Dominican 2%
- Common ancestry
- Romanian 2% Slovak 2% Lithuanian 1%
- Foreign-born
- 9% · Canada, China, India
- Languages at home
- 77% English-only · Spanish 17% Other Indo-European 1% Chinese 1%
Political lean MEDSL · Lancaster
- 2024 margin
- R (+15.9) · D 41.5% · R 57.5%
- 2008→2024 swing
- -4.1pp toward R · 2008: -11.8pp · 2024: -15.9pp
- All cycles
- 2024: R+15.9 2020: R+15.8 2016: R+19.7 2012: R+19.2 2008: R+11.8
Not yet ingested
- Civics
- —
Market trends
- HPI YoY
- ▼ -508.78%
- Current HPI
- 289.3324
- Rent YoY
- ▲ 0.47%
- Metro
- Lancaster, PA
- State GDP YoY
- ▲ 1.68%
- F500 in state
- 34
Industry mix (Fortune 500 HQ in PA)
| Industry | F500 HQs | Revenue |
|---|---|---|
| Healthcare | 2 | $309B |
|
||
| Insurance | 2 | $27B |
|
||
| Telecommunications / Media | 1 | $124B |
|
||
| Industrial Distribution | 1 | $22B |
|
||
| Financial Services | 1 | $20B |
|
||
| Chemicals / Materials | 1 | $18B |
|
||
Price history
+271.7% since first listed21 events — show timeline
- 2026-05-06 Pending — BRIGHT MLS
- 2026-04-14 Listed $289,900 BRIGHT MLS
- 2026-04-01 Coming Soon $289,900 BRIGHT MLS
- 2020-02-19 Sold (Public Records) $151,000 Public Records
- 2020-02-18 Sold (MLS) $151,000 BRIGHT MLS
- 2020-01-06 Pending — BRIGHT MLS
- 2019-12-17 Listed $150,000 BRIGHT MLS
- 2014-03-29 Listing Removed — BRIGHT MLS
- 2014-03-28 Sold (MLS) $110,000 BRIGHT MLS
- 2013-07-13 Listed $114,900 BRIGHT MLS
- 2013-01-01 Listing Removed — BRIGHT MLS
- 2011-01-25 Listed $115,000 BRIGHT MLS
- 2010-12-31 Listing Removed — BRIGHT MLS
- 2010-05-18 Listed $129,900 BRIGHT MLS
- 2010-01-08 Sold (Public Records) $70,000 Public Records
- 2009-12-22 Listing Removed — BRIGHT MLS
- 2009-11-25 Listed $78,900 BRIGHT MLS
- 2007-10-26 Sold (Public Records) $97,000 Public Records
- 2006-01-01 Listing Removed — BRIGHT MLS
- 2005-08-03 Listed $64,900 BRIGHT MLS
- 1985-04-30 Sold (Public Records) $78,000 Public Records
Property tax history
+1.5%/yrLatest (2026): $4,545 · +3.3% YoY. Source: county tax records.
Cash-flow waterfall
monthlySold comps — $/sqft
last 12 mo · ≤1 miLoading sold comps…