1219 E Highway 330 Hwy · Schererville, IN
Flood risk 1/10 · Minimal
- FEMA flood zone
- X (unshaded)
- Chance of flooding over 30 yrs
- 0.0%
- Est. flood insurance / yr
- $473 – $860
Fire risk 1/10 · Minimal
- Est. fire insurance / yr
- $717 – $1,331
Heat risk 2/10 · Minimal
- Hot days now (above 102°F)
- 7 days/yr
- Hot days in 30 yrs
- 15 days/yr
Wind risk 2/10 · Minimal
- Chance of severe wind over 30 yrs
- 1.0%
Air-quality risk 3/10 · Minor
- Unhealthy air days now
- 2 days/yr
- Unhealthy air days in 30 yrs
- 3 days/yr
Risk factors via First Street. Map © Google.
Why this score? — see what drove the C grade
The composite is a weighted blend of 9 inputs, each scored 0–100. Each bar is that input's sub-score; the figure is the points it added to the 100-point composite (weight × sub-score).
- Cash flow +17.4/30.0
- ARV discount +15.0/15.0
- DSCR +5.4/10.0
- 1% rule +4.8/10.0
- Schools +4.5/10.0
- Livability +3.4/5.0
- Rent growth +2.5/5.0
- Condition / age +2.5/5.0
- Appreciation +0.0/10.0
$149,900
🖨 Deal sheet (PDF) 📄 Offer letter ✓ Due diligence
Listing remarks MLS
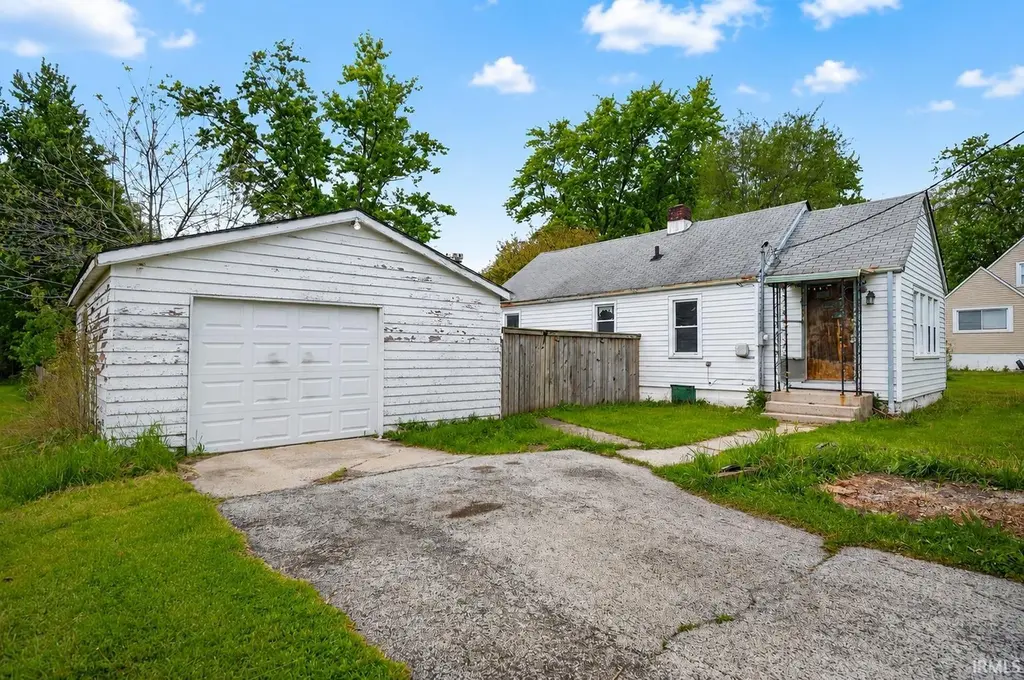
WOW! Almost an acre of land on city water & sewer sits this cute, cozy & well cared for Ranch home featuring 2 bedrooms den or office could be 3rd bedroom but no closet; updated spacious kitchen; comfortable living room; mud room could be converted to main floor laundry; windows replaced in 2000; furnace & central air replaced approx. 5 years ago; updated electric Oct. 2012; detached garage displays one garage door but is actually size of a two car garage; huge backyard. If home is not big enough, there is plenty of room to add on. LOW TAXES!
Key facts
- Value-add potential
- Flexible layout
- Newer water heater
Tags
Property features AI
Finance
- Other: Lot dimensions approximately 99 x 463 feet (about 0.93 acres)
- Financial info: Financial details not provided
- HOA & community: No HOA information provided
Exterior
- Parking: Detached garage with 1 garage space
- Security: No security features listed
- Utilities: Public water; Public sewer
- Home design: Single-family residence, site-built; One story
- Construction: Vinyl siding and asphalt construction materials; Built details not provided
- Exterior features: Level lot; Shed(s) on the property
Interior
- Kitchen: Kitchen details not provided
- Bedrooms: Bedrooms not specified
- Flooring: Flooring details not provided
- Bathrooms: 2 full bathrooms (both on the main level)
- Heating & cooling: Natural gas heating with forced air; Central air conditioning
- Interior features: 5 total rooms; Basement is full, unfinished with a crawl space
- Laundry & utility: Laundry located in the basement
Neighborhood map
What this means for you Summary
Snapshot
- This is a 2-bed/1.0-bath single-family listed at $150k.
Deal economics
- At list price, monthly cash flow is $112 ($1k/yr) — positive.
- The deal already cash-flows at list — no discount required.
- To meet the 1% rule (rent ≥ 1% of price), the offer needs to be $147k (1.8% below list).
- Recommended offer: $147k (1.8% below list) — sets the bar for 1% rule.
- Cap rate 7.2% vs local median 4.0% in Schererville — top-decile yield for the area; either an underpriced asset or a hidden risk that comps aren't pricing in. Stress-test before assuming the spread holds.
Location & tenants
- Location reads 68/100 on livability (#226 in IN) — a middle-class / working-renter tenant base. Strengths: cost of living A+, housing A+, crime A; Watch: amenities F, commute F, health & safety F.
- Lake Central School Corporation (suburban): math 45% / reading 54% proficiency, ranked #41 of 301 in IN (top 14%) — families likely to look elsewhere, expect single-tenant / working-renter base with shorter leases; only 15% free/reduced lunch — higher-income household profile.
- Market conditions: 69 active listings in the ZIP; 5 comparable units currently listed for rent nearby; rentals leasing fast (median 0d on market — plan ~1-2 weeks tenant-placement turnaround); 1,642 units permitted in Lake County in 2024 (14 in 5+ unit buildings).
Forward outlook
- Local home prices are declining (-3.0%/yr); year-one equity from $1k of loan paydown is wiped out by about $4k of value loss. Plan a longer hold.
- Lake County population projected to shrink 7% by 2050 — rents likely to lag national; underwrite the cash flow, not the appreciation.
Negotiation context
- It's been on market 28 days — a 2% lower offer ($148k) is reasonable based on typical stale-listing flexibility.
- 3 sale attempts since 14y ago; this cycle's ask has dropped $30k (17%) from the opening price — seller is motivated, your offer sets the floor, not the list.
- Current owner paid $90k; list at $150k implies a 67% gain — meaningful room to come down on a strong offer.
Risks & watch-outs
- Watch-outs: built in 1938 — expect roof / HVAC / electrical / plumbing capex.
Questions for the listing agent
- Built in 1938 — when were the roof, HVAC, electrical panel, plumbing, and water heater last replaced?
- Is there a deadline driving the sale (1031 exchange, divorce, estate, relocation)? That informs how much negotiation room exists.
- Schools are B-rated — typically a magnet for longer-tenancy family renters. What's the average tenant stay here, and is there a school-zone premium baked into asking?
- What's the average days-on-market for RENTAL listings here right now (not sales)? A rising rental-DOM trend means longer vacancies and softer asking-rent achievability than the comps imply.
- What's the recent tenant-quality profile in this submarket — average credit score on applications, eviction rate, late-payment / NSF rate, and stable-employment percentage? A property-management company in the area should have these aggregated.
- How much new for-sale + rental construction is in the pipeline within 1–3 miles? Heavy new supply typically softens prices + rents 12–24 months out; constrained supply supports both.
Investment metrics
- 1% rule
- 0.98% ✗
- Cap rate
- 7.19%
- Cash-on-cash
- 3.20%
- DSCR
- 1.14
- GRM
- 8.5
CMA / ARV
- ARV (median comp)
- $256,397
- List price
- $149,900
- Delta
- -39.20%
- Verdict
- UNDERPRICED
- Comps
- 20 within 1.0 mi
Show comp detail 3 sales within ~0.75 mi
| Address | Dist | Beds/Ba | Sqft | Sold | Price | $/sf | Match |
|---|---|---|---|---|---|---|---|
| 1004 70th Pl | 0.49mi | 3/1.0 (+1) | 1,120 (+10%) | 11mo | $259,900 | $232 | 45 |
| 7220 Burr St | 0.39mi | 2/1.0 | 1,129 (+11%) | 22mo | $180,000 | $159 | 45 |
| 942 E 71st Ave | 0.53mi | 3/1.0 (+1) | 1,120 (+10%) | 21mo | $190,000 | $170 | 35 |
Match score weights: distance 35% · size 25% · config 20% · recency 20%. Top-matched comps best support the ARV.
Projected returns pro-forma
-3.0% appreciation · 3.0% rent growth · sell at horizon
- IRR
- -11.2%
- Equity multiple
- 0.59×
- Total profit
- $-17,127
- Equity at exit
- $22,351
- IRR
- -2.0%
- Equity multiple
- 0.87×
- Total profit
- $-5,604
- Equity at exit
- $12,961
Cash invested: $41,972 (down + closing). Projections, not guarantees.
Landlord ↔ Tenant lean methodology
- Overall (STATE)
- 90 Strongly Landlord-Friendly
- State Indiana
- 90 Strongly Landlord-Friendly · R+11
- County
- — inherits STATE
- City
- — inherits STATE
ZIP-level market 46319
- Home prices YoY
- -25.5%
- Active inventory
- 69
- Price-to-rent
- 8.5×
Monthly cashflow live
- Estimated rent
- $1,471 high interval (Pro) →
- Mortgage (P&I)
- −$786
- Tax from tax record
- −$202 /mo · $2,422/yr
- Insurance
- −$62
- HOA
- −$0
- Vacancy / Maint / Mgmt
- −$309
- Net cashflow
- $112
Break-even live
Sensitivity live
| Price | -10% $197 | -5% $154 | +0% $112 | +5% $70 | +10% $27 |
|---|---|---|---|---|---|
| Rent | -10% $-4 | -5% $54 | +0% $112 | +5% $170 | +10% $228 |
| Rate | -1.0pp $187 | -0.5pp $150 | base $112 | +0.5pp $73 | +1.0pp $34 |
UW: 25.0% down · 7.5% · 30yr · 1.5% tax · 5.0% vac · 8.0% maint · 8.0% mgmt
Financing live
Cash to close
- Down payment
- $37,475
- Closing costs
- $4,497
- Reserves months
- —
- Total cash needed
- —
Loan-product check · same deal, 3 products live
Conventional
25% down · 7.5% · 30yr
- Down + closing
- —
- Monthly P&I
- —
- Monthly cashflow
- —
- DSCR
- —
- Eligible?
- —
Personal DTI + credit; lowest rate.
DSCR
20% down · 8.5% · 30yr
- Down + closing
- —
- Monthly P&I
- —
- Monthly cashflow
- —
- DSCR
- —
- Eligible?
- —
No personal income docs; deal must DSCR.
Hard money
10% down · 12.0% · 12mo
- Down + closing
- —
- Monthly P&I
- —
- Monthly cashflow
- —
- DSCR
- —
- Eligible?
- —
Short-term bridge; refi at stabilization.
Rent comps 5 comps
| Address | Beds | Baths | Sqft | Rent | $/sqft | DOM | Units | Dist |
|---|---|---|---|---|---|---|---|---|
| 7726 Durbin St Schererville, IN | 3.0 | 1.5 | 1008 | $1,995 | $1.98 | 0d | 1 | 1.09mi |
| 2615 Morningside Dr Unit A4 Crown Point, IN | 2.0 | 1.0 | 1000 | $1,475 | $1.48 | 26d | 1 | 1.15mi |
| 2615 Morningside Dr Crown Point, IN | 2.0 | 1.0 | 1000 | $1,475 | $1.48 | 5d | 1 | 1.15mi |
| 4059 W 73rd Ave Unit C Merrillville, IN | 2.0 | 1.5 | 1200 | $1,495 | $1.25 | 0d | 1 | 1.32mi |
| 5500 Cedar Point Dr Crown Point, IN | 1.0–2.0 | 1.0–2.0 | 900 | $1,144 | $1.27 | 0d | 2 | 1.45mi |
Listing history 15 events
-
2026-06-21pricedays on market $149,900 Active 28 DOM
-
2026-06-18price $155,900 Active 25 DOM
-
2026-06-18days on market $157,900 Active 25 DOM
-
2026-06-17statusdays on market $157,900 Active 24 DOM
-
2026-06-07statusdays on market $157,900 Pending 23 DOM
-
2026-06-04pricedays on market $157,900 Active 21 DOM
-
2026-06-03days on market $160,900 Active 20 DOM
-
2026-06-02days on market $160,900 Active 19 DOM
-
2026-06-02price $160,900 Active 18 DOM
-
2026-06-01pricedays on market $161,900 Active 18 DOM
-
2026-05-31days on market $164,900 Active 17 DOM
-
2026-05-14$179,900 Active 691-char remark
-
2013-04-23soldstatus $90,000
-
2013-04-12soldstatus $90,000 566-char remark
Show marketing remark (566 chars)
WOW! Almost an acre of land on city water & sewer sits this cute, cozy & well cared for Ranch home featuring 2 bedrooms den or office could be 3rd bedroom but no closet; updated spacious kitchen; comfortable living room; mud room could be converted to main floor laundry; windows replaced in 2000; furnace & central air replaced approx. 5 years ago; updated electric Oct. 2012; detached garage displays one garage door but is actually size of a two car garage; huge backyard. If home is not big enough, there is plenty of room to add on. LOW TAXES!
-
2012-10-24$99,999 566-char remark
Show marketing remark (566 chars)
WOW! Almost an acre of land on city water & sewer sits this cute, cozy & well cared for Ranch home featuring 2 bedrooms den or office could be 3rd bedroom but no closet; updated spacious kitchen; comfortable living room; mud room could be converted to main floor laundry; windows replaced in 2000; furnace & central air replaced approx. 5 years ago; updated electric Oct. 2012; detached garage displays one garage door but is actually size of a two car garage; huge backyard. If home is not big enough, there is plenty of room to add on. LOW TAXES!
ⓘ Source: listings_history table (triggers on properties + properties_extension) + one-shot
backfill from property_details.listing_events for pre-trigger history.
Tax reassessment forecast IN · Partial reset (capped growth)
- Current annual tax
- $2,422 · $202/mo
- Projected year-2 tax
- $2,422 · $202/mo
- Expected delta
- $0/yr ($0/mo · 0.0%)
ⓘ Screening estimate from a state-policy table — verify with the county assessor before closing.
Climate risk First Street
- Flood 1/10 Low FEMA zone X (unshaded) · 0% chance over 30 yrs
- Wildfire 1/10 Low
- Heat 2/10 Low 7 d/yr ≥102°F today · 15 d/yr by 30 yrs out
- Wind 2/10 Low 100% chance of damaging wind over 30 yrs
- Air quality 3/10 Moderate 2 unhealthy d/yr today · 3 by 30 yrs out
Nearby sold comps map
Loading sold comps map…
Walkable amenities ~0.75 mi
Loading nearby amenities…
Taxation est. · year 1
- Rental income
- $17,656
- − Mortgage interest
- −$8,397
- − Property taxes
- −$2,422
- − Insurance
- −$750
- − Repairs & maintenance
- −$1,412
- − Management
- −$1,412
- − Depreciation
- −$4,361
- Taxable loss
- −$1,098
- Est. tax savings @ 24.0%
- +$263
- After-tax cash flow
- $1,607/yr
For passive investors: Depreciation is non-cash, so a rental often shows a tax loss while cash-flowing — sheltering income. Rental losses are passive: they offset passive income freely, and up to $25,000/yr can offset ordinary (W-2) income if you actively participate and your MAGI is under $100k (phasing out to $0 by $150k); unused losses carry forward. On sale, claimed depreciation is recaptured at up to 25%, and gains may owe capital-gains tax (a 1031 exchange can defer both). Figures are a year-1 estimate at your 24.0% rate — not tax advice; consult a CPA.
Schools (NCES district)
- District
- Lake Central School Corporation
- NCES district ID
- 1805450
- Math proficiency
- 45% ▼ -9.00%
- Reading proficiency
- 54% ▼ -11.00%
- Median HH income
- $75,957
- Composite
- 44.82/100
- National rank
- #2736
- State rank
- #41 of 301 in IN
Livability — Schererville
- Score
- 68/100
- State rank
- #226
- US rank
- #9897
Category grades
Schools grade is shown separately in the Schools card above.
Census & demographics
- County
- Lake County · 422,878 people
- City population
- 24,188
- Metro
- Chicago-Naperville-Elgin, IL-IN-WI
- Population (ZIP)
- 17,847
- Household income
- $74,662
- Rent vs Own
- Severe rent burden
- 504.0
Population outlook (Lake County) Hauer SSP2
- Today (2025)
- 484,026 people
- By 2030
- 478,091 · -1.2%
- By 2040
- 462,974 · -4.3%
- By 2050
- 449,894 · -7.1%
- By 2075
- 436,169 · -9.9%
- By 2100
- 426,607 · -11.9%
Race, ethnicity, and origin ACS 2023
- Neighborhood character
- Majority White (64%)
- Race & ethnicity
- White 64% Hispanic / Latino 17% Black 13% Two or more races 12% Asian 2%
- Hispanic origin (detail)
- Mexican 14% Puerto Rican 1%
- Common ancestry
- Romanian 14% Iranian 4% Lithuanian 2%
- Foreign-born
- 6% · Canada, Philippines, China
- Languages at home
- 88% English-only · Spanish 9% Russian/Polish/Slavic 1% Other Asian/Pacific 1%
Political lean MEDSL · Lake
- 2024 margin
- Lean D (+5.6) · D 52.1% · R 46.5% · Other 1.5%
- 2008→2024 swing
- -28.6pp toward R · 2008: 34.3pp · 2024: 5.6pp
- All cycles
- 2024: D+5.6 2020: D+15.1 2016: D+20.6 2012: D+31.0 2008: D+34.3
Not yet ingested
- Civics
- —
Market trends
- HPI YoY
- ▼ -95.17%
- Current HPI
- 278.3139
- Rent YoY
- —
- Metro
- Chicago-Naperville-Elgin, IL-IN-WI
- State GDP YoY
- ▲ 2.90%
- F500 in state
- 18
Industry mix (Fortune 500 HQ in IN)
| Industry | F500 HQs | Revenue |
|---|---|---|
| Industrial Machinery | 2 | $37B |
|
||
| Healthcare | 1 | $177B |
|
||
| Pharmaceuticals | 1 | $45B |
|
||
| Metals / Steel | 1 | $18B |
|
||
| Agriculture | 1 | $17B |
|
||
| Packaging | 1 | $12B |
|
||
Price history
+57.9% since first listed14 events — show timeline
- 2026-06-16 Relisted — IRMLS
- 2026-06-06 Pending — IRMLS
- 2026-06-04 Price Changed $157,900 IRMLS
- 2026-06-01 Price Changed $160,900 IRMLS
- 2026-06-01 Price Changed $161,900 IRMLS
- 2026-05-28 Price Changed $164,900 IRMLS
- 2026-05-27 Price Changed $169,900 IRMLS
- 2026-05-27 Price Changed $155,900 IRMLS
- 2026-05-22 Price Changed $172,900 IRMLS
- 2026-05-19 Price Changed $174,900 IRMLS
- 2026-05-14 Listed $179,900 IRMLS
- 2013-04-23 Sold (Public Records) $90,000 Public Records
- 2013-04-12 Sold (MLS) $90,000 NIRA MLS as Distributed by MLS Grid
- 2012-10-24 Listed $99,999 NIRA MLS as Distributed by MLS Grid
Property tax history
+18.5%/yrLatest (2024): $2,422 · -2.3% YoY. Source: county tax records.
Cash-flow waterfall
monthlySold comps — $/sqft
last 12 mo · ≤1 miLoading sold comps…