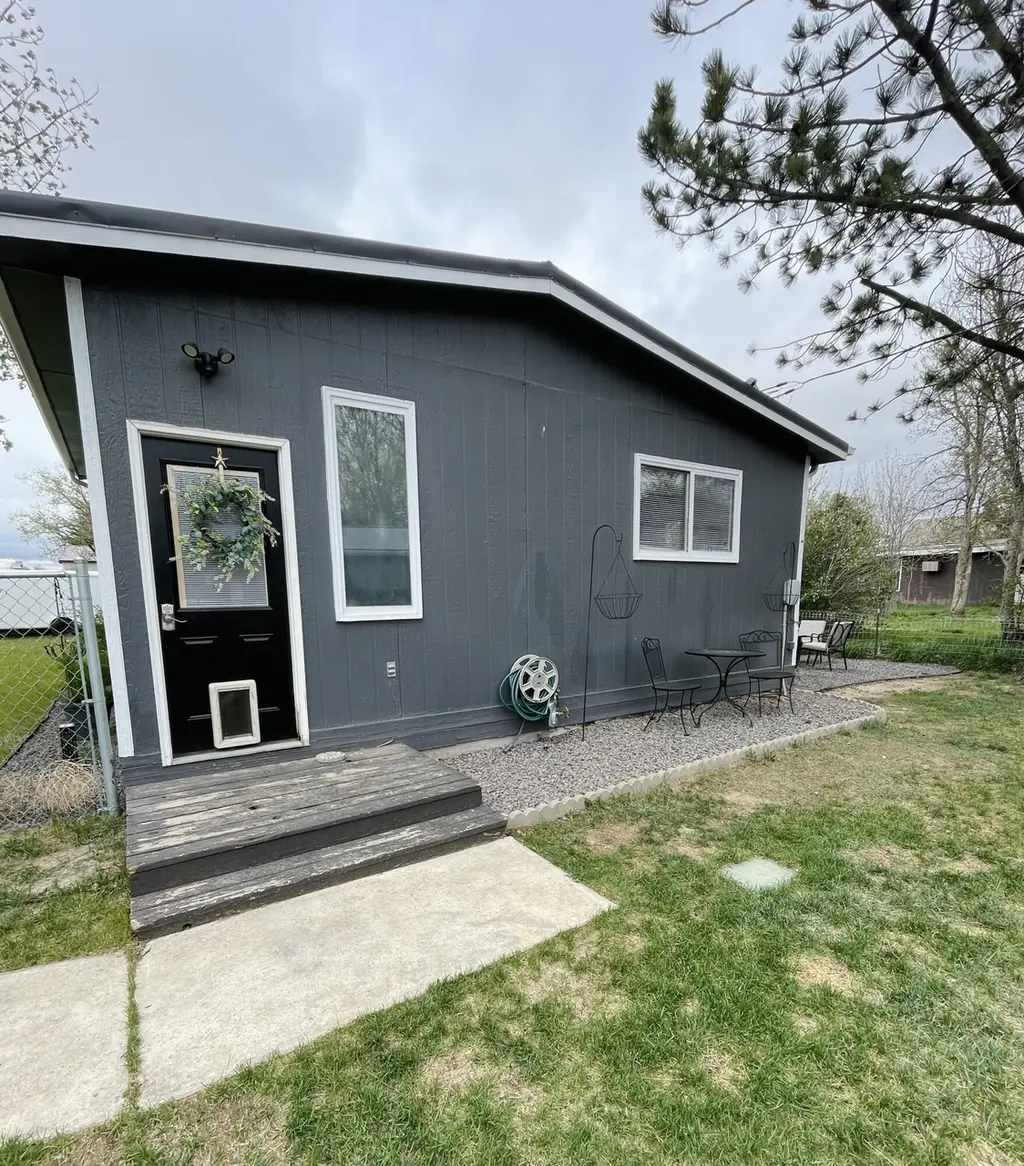
125 2nd Ave NW · Rudyard, MT
Flood risk 4/10 · Minor
- FEMA flood zone
- —
- Chance of flooding over 30 yrs
- 0.2%
- Est. flood insurance / yr
- —
Fire risk 1/10 · Minimal
- Est. fire insurance / yr
- $918 – $1,706
Heat risk 2/10 · Minimal
- Hot days now (above 92°F)
- 7 days/yr
- Hot days in 30 yrs
- 14 days/yr
Wind risk 1/10 · Minimal
- Chance of severe wind over 30 yrs
- —
Air-quality risk 6/10 · Moderate
- Unhealthy air days now
- 9 days/yr
- Unhealthy air days in 30 yrs
- 9 days/yr
Risk factors via First Street. Map © Google.
Why this score? — see what drove the C+ grade
The composite is a weighted blend of 9 inputs, each scored 0–100. Each bar is that input's sub-score; the figure is the points it added to the 100-point composite (weight × sub-score).
- Cash flow +21.3/30.0
- Appreciation +7.9/10.0
- ARV discount +7.5/15.0
- DSCR +6.8/10.0
- 1% rule +4.4/10.0
- Schools +3.8/10.0
- Livability +3.4/5.0
- Rent growth +2.5/5.0
- Condition / age +2.5/5.0
$110,000
🖨 Deal sheet 📄 Offer letter ✓ Due diligence
Key facts
- Fenced in yard
- 7,000 sq ft lot
- 2 garage spots
Tags
Property features AI
Finance
- Other: Annual tax listed
Exterior
- Parking: 2-car garage; Garage door opener
- Utilities: Public water; Public sewer; Natural gas available
- Home design: One level; Manufactured home (residential)
- Construction: Frame construction
- Exterior features: Fenced yard; Metal roof
Interior
- Kitchen: Dishwasher; Microwave; Refrigerator
- Bathrooms: 1 full bathroom; 1 half bathroom
- Heating & cooling: Central air conditioning; Forced air heating; Wood heating source
- Interior features: Dishwasher; Microwave; Refrigerator; 8 total rooms
Neighborhood map
What this means for you Summary
Snapshot
- This is a 1-bed/1.5-bath manufactured listed at $110k.
Deal economics
- At list price, monthly cash flow is $161 ($2k/yr) — positive.
- The deal already cash-flows at list — no discount required.
- To meet the 1% rule (rent ≥ 1% of price), the offer needs to be $104k (5.9% below list).
- Recommended offer: $104k (5.9% below list) — sets the bar for 1% rule.
Location & tenants
- Location reads 67/100 on livability (#107 in MT) — a middle-class / working-renter tenant base. Strengths: cost of living A+, housing A+, employment A-; Watch: health & safety C-, crime F, amenities F.
- North Star Elementary (rural): math 40% / reading 45% proficiency, ranked #126 of 339 in MT (top 37%) — families likely to look elsewhere, expect single-tenant / working-renter base with shorter leases.
- Market conditions: 3 active listings in the ZIP; 1 units permitted in Hill County in 2024 (0 in 5+ unit buildings).
Forward outlook
- In year one you build about $7k of equity ($761 loan paydown + $6k appreciation (5.8% local appreciation)).
- At projected returns (5.8% appreciation + 3.0% rent growth), your $31k cash investment doubles in ~4 years — after that, you're playing with house money.
- By year 5, paydown + projected appreciation supports a ~$32k cash-out refi (75% LTV) — recoverable capital for the next deal without selling this one.
Negotiation context
- Only 4 days on market — expect competitive offers; lowballing is unlikely to land.
- 2 sale attempts since 2y ago with the ask held roughly flat each time — persistent listings suggest the price (not the market) is what's stuck; bring a comps-based counter.
Questions for the listing agent
- Built in 1972 — when were the roof, HVAC, electrical panel, plumbing, and water heater last replaced?
- Is there a deadline driving the sale (1031 exchange, divorce, estate, relocation)? That informs how much negotiation room exists.
- Schools are B-rated — typically a magnet for longer-tenancy family renters. What's the average tenant stay here, and is there a school-zone premium baked into asking?
- Crime grade is F in this area — have there been break-ins, vandalism, or insurance claims at this property in the last 3 years? What carrier currently insures it and at what premium?
- What's the average days-on-market for RENTAL listings here right now (not sales)? A rising rental-DOM trend means longer vacancies and softer asking-rent achievability than the comps imply.
- What's the recent tenant-quality profile in this submarket — average credit score on applications, eviction rate, late-payment / NSF rate, and stable-employment percentage? A property-management company in the area should have these aggregated.
- How much new for-sale + rental construction is in the pipeline within 1–3 miles? Heavy new supply typically softens prices + rents 12–24 months out; constrained supply supports both.
Investment metrics
- 1% rule
- 0.94% ✗
- Cap rate
- 8.05%
- Cash-on-cash
- 6.27%
- DSCR
- 1.28
- GRM
- 8.9
CMA / ARV
No comps found within radius.
Projected returns pro-forma
5.85% appreciation · 3.0% rent growth · sell at horizon
- IRR
- 20.2%
- Equity multiple
- 2.33×
- Total profit
- $41,009
- Equity at exit
- $68,134
- IRR
- 19.5%
- Equity multiple
- 4.66×
- Total profit
- $112,761
- Equity at exit
- $122,689
Cash invested: $30,800 (down + closing). Projections, not guarantees.
Landlord ↔ Tenant lean methodology
- Overall (STATE)
- 82 Strongly Landlord-Friendly
- State Montana
- 82 Strongly Landlord-Friendly · R+11
- County
- — inherits STATE
- City
- — inherits STATE
ZIP-level market 59540
- Home prices YoY
- 2.5%
- Active inventory
- 3
- Price-to-rent
- 8.9×
Monthly cashflow live
- Estimated rent
- $1,036 medium interval (Pro) →
- Mortgage (P&I)
- −$577
- Tax from tax record
- −$34 /mo · $413/yr
- Insurance
- −$46
- HOA
- −$0
- Vacancy / Maint / Mgmt
- −$217
- Net cashflow
- $161
Break-even live
UW: 25.0% down · 7.5% · 30yr · 1.5% tax · 5.0% vac · 8.0% maint · 8.0% mgmt
Financing live
Cash to close
- Down payment
- $27,500
- Closing costs
- $3,300
- Reserves months
- —
- Total cash needed
- —
Loan-product check · same deal, 3 products live
Conventional
25% down · 7.5% · 30yr
- Down + closing
- —
- Monthly P&I
- —
- Monthly cashflow
- —
- DSCR
- —
- Eligible?
- —
Personal DTI + credit; lowest rate.
DSCR
20% down · 8.5% · 30yr
- Down + closing
- —
- Monthly P&I
- —
- Monthly cashflow
- —
- DSCR
- —
- Eligible?
- —
No personal income docs; deal must DSCR.
Hard money
10% down · 12.0% · 12mo
- Down + closing
- —
- Monthly P&I
- —
- Monthly cashflow
- —
- DSCR
- —
- Eligible?
- —
Short-term bridge; refi at stabilization.
Listing history 1 events
-
2026-06-07$110,000 Pending 4 DOM
ⓘ Source: listings_history table (triggers on properties + properties_extension) + one-shot
backfill from property_details.listing_events for pre-trigger history.
Tax reassessment forecast MT · Resets to sale price
- Current annual tax
- $413 · $34/mo
- Projected year-2 tax
- $924 · $77/mo
- Expected delta
- +$511/yr (+$43/mo · 123.6%)
ⓘ Screening estimate from a state-policy table — verify with the county assessor before closing.
Climate risk First Street
- Flood 4/10 Moderate 20% chance over 30 yrs
- Wildfire 1/10 Low
- Heat 2/10 Low 7 d/yr ≥92°F today · 14 d/yr by 30 yrs out
- Wind 1/10 Low
- Air quality 6/10 Major 9 unhealthy d/yr today · 9 by 30 yrs out
Nearby sold comps map
Loading sold comps map…
Walkable amenities ~0.75 mi
Loading nearby amenities…
Taxation est. · year 1
- Rental income
- $12,427
- − Mortgage interest
- −$6,162
- − Property taxes
- −$413
- − Insurance
- −$550
- − Repairs & maintenance
- −$994
- − Management
- −$994
- − Depreciation
- −$3,200
- Taxable income
- $114
- Est. tax owed @ 24.0%
- −$27
- After-tax cash flow
- $1,904/yr
For passive investors: Depreciation is non-cash, so a rental often shows a tax loss while cash-flowing — sheltering income. Rental losses are passive: they offset passive income freely, and up to $25,000/yr can offset ordinary (W-2) income if you actively participate and your MAGI is under $100k (phasing out to $0 by $150k); unused losses carry forward. On sale, claimed depreciation is recaptured at up to 25%, and gains may owe capital-gains tax (a 1031 exchange can defer both). Figures are a year-1 estimate at your 24.0% rate — not tax advice; consult a CPA.
Schools (NCES district)
- District
- North Star Elementary
- NCES district ID
- 3000096
- Math proficiency
- 40% ▬ 0.00%
- Reading proficiency
- 45% ▼ -5.00%
- Median HH income
- $43,473
- Composite
- 38.26/100
- National rank
- #8558
- State rank
- #126 of 339 in MT
Livability — Rudyard
- Score
- 67/100
- State rank
- #107
- US rank
- #11018
Category grades
Schools grade is shown separately in the Schools card above.
Census & demographics
- Census place
- Rudyard, MT
- Population (ZIP)
- 470
Population outlook (Hill County) Hauer SSP2
- Today (2025)
- 16,841 people
- By 2030
- 16,954 · +0.7%
- By 2040
- 17,063 · +1.3%
- By 2050
- 17,130 · +1.7%
- By 2075
- 17,273 · +2.6%
- By 2100
- 16,542 · -1.8%
Race, ethnicity, and origin ACS 2023
- Neighborhood character
- Predominantly White (99%)
- Race & ethnicity
- White 99%
- Common ancestry
- Portuguese 17% Slovak 15% Lithuanian 2%
Political lean MEDSL · Hill
- 2024 margin
- R (+18.2) · D 38.7% · R 56.9% · Other 4.4%
- 2008→2024 swing
- -30.4pp toward R · 2008: 12.2pp · 2024: -18.2pp
- All cycles
- 2024: R+18.2 2020: R+13.6 2016: R+17.3 2012: D+3.5 2008: D+12.2
Not yet ingested
- Civics
- —
Market trends
- HPI YoY
- ▲ 5.85%
- Current HPI
- 235.2428
- Rent YoY
- —
- Metro
- —
- State GDP YoY
- ▲ 3.41%
- F500 in state
- 2
Industry mix (Fortune 500 HQ in MT)
| Industry | F500 HQs | Revenue |
|---|---|---|
| Technology / Analytics | 1 | $2B |
|
||
Price history
+10.0% since first listed3 events — show timeline
- 2026-06-05 Pending — HHLMLS
- 2026-05-19 Listed $110,000 HHLMLS
- 2024-11-25 Listed $100,000 MRMLS
Property tax history
-1.3%/yrLatest (2025): $413 · -21.9% YoY. Source: county tax records.
Cash-flow waterfall
monthlySold comps — $/sqft
last 12 mo · ≤1 miLoading sold comps…