 🏷️ Likely Rental
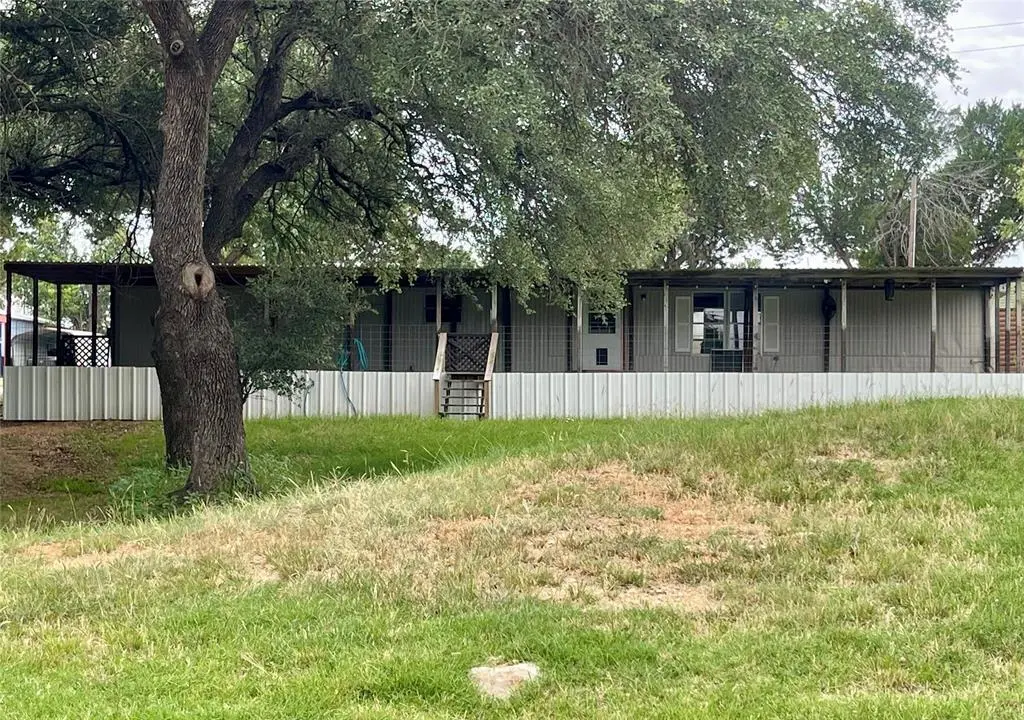
2334 Sanbar Rd #46 · Graford, TX
Flood risk No data
- FEMA flood zone
- —
- Chance of flooding over 30 yrs
- —
- Est. flood insurance / yr
- —
Fire risk No data
- Est. fire insurance / yr
- —
Heat risk No data
- Hot days now (above threshold)
- —
- Hot days in 30 yrs
- —
Wind risk No data
- Chance of severe wind over 30 yrs
- —
Air-quality risk No data
- Unhealthy air days now
- —
- Unhealthy air days in 30 yrs
- —
Risk factors via First Street. Map © Google.
Why this score? — see what drove the D grade
The composite is a weighted blend of 9 inputs, each scored 0–100. Each bar is that input's sub-score; the figure is the points it added to the 100-point composite (weight × sub-score).
- Cash flow +15.0/30.0
- ARV discount +7.5/15.0
- 1% rule +5.0/10.0
- DSCR +5.0/10.0
- Schools +3.4/10.0
- Livability +3.2/5.0
- Rent growth +2.5/5.0
- Condition / age +1.0/5.0
- Appreciation +0.0/10.0
$50,000
🖨 Deal sheet 📄 Offer letter ✓ Due diligence
Listing remarks MLS
Come see this beachy bungalow that's waiting just for you! Known to the community as THE JIMMY BUFFET HOUSE, this great property is located in a great location in sought after Golden Cove. The beautiful home comes with an in ground propane tank and metal roof. Brand new plumbing and water heater spring 2021. Great potential for adding a third bedroom or family room. Most contents included in sale. All you have to do is show up! Move in ready to enjoy the rest of the summer! Large covered porch (70 ft) is great for parties and is a cool place to escape the summer heat! Propane tank filled in 2019. Property has a leasehold. Lease is $575 per month.
Key facts
- Great ac unit
- Metal roof
- Fully covered deck
Tags
Property features AI
Finance
- Other: Deed restrictions; Located in planned development Golden Cove - Sandbar PK Lake; Easements for access and utilities; Will not subdivide; Parcel ID present
- HOA & community: No association
Exterior
- Parking: Gravel parking; Outside parking
- Security: Smoke detector(s)
- Utilities: Propane; Electricity connected; Co-op electric; Co-op water; Individual water meter; Septic; All-weather road access; Asphalt access; Overhead utilities; Outside city limits; Community mailbox; Unincorporated area
- Home design: Manufactured home; One level; Residential property
- Construction: Built in 1983; Siding exterior; Metal roof; Other foundation
- Exterior features: Covered deck; Covered porch(es); Storage; Cul-de-sac lot; Water/Lake view; Grassed vegetation; Leasehold
Interior
- Kitchen: Solid surface/non-natural countertops; Dishwasher
- Bedrooms: 3 bedrooms (all on the main level); Primary bedroom with ensuite bath
- Bathrooms: 2 full bathrooms
- Heating & cooling: Central heating (electric); Central electric air conditioning; Ceiling fan(s)
- Interior features: Open floorplan; Paneling
- Laundry & utility: Washer; Dryer; Electric water heater
Neighborhood map
What this means for you Summary
Snapshot
- This is a 3-bed/2.0-bath single-family listed at $50k. Condition is rated poor.
Deal economics
- At list price, monthly cash flow is $2k ($19k/yr) — positive.
- The deal already cash-flows at list — no discount required.
- Meets the 1% rule at list price ($2k rent vs $50k).
- Cap rate 44.8% vs local median 1.3% in Graford — top-decile yield for the area; either an underpriced asset or a hidden risk that comps aren't pricing in. Stress-test before assuming the spread holds.
Location & tenants
- Location reads 63/100 on livability (#856 in TX) — a middle-class / working-renter tenant base. Strengths: cost of living A+, housing A+; Watch: employment C-, health & safety D+, schools D-.
- Graford ISD (rural): math 35% / reading 40% proficiency, ranked #817 of 1,141 in TX (top 72%) — families likely to look elsewhere, expect single-tenant / working-renter base with shorter leases.
- Market conditions: 465 active listings in the ZIP; 27 units permitted in Palo Pinto County in 2024 (0 in 5+ unit buildings).
Forward outlook
- Local home prices are declining (-3.0%/yr); year-one equity from $346 of loan paydown is wiped out by about $2k of value loss. Plan a longer hold.
- Palo Pinto County population projected to shrink 8% by 2050 — rents likely to lag national; underwrite the cash flow, not the appreciation.
- At projected returns (-3.0% appreciation + 3.0% rent growth), your $14k cash investment doubles in ~1 year — after that, you're playing with house money.
Negotiation context
- Only 11 days on market — expect competitive offers; lowballing is unlikely to land.
- 5 sale attempts since 5y ago with the ask held roughly flat each time — persistent listings suggest the price (not the market) is what's stuck; bring a comps-based counter.
Questions for the listing agent
- Have any recent inspections been done? Can we get a copy of the seller's disclosures and any deferred-maintenance estimates?
- Is there a deadline driving the sale (1031 exchange, divorce, estate, relocation)? That informs how much negotiation room exists.
- Schools are D-rated, which usually means shorter tenancies and higher turnover. Who's the typical renter profile here, and what's been the actual vacancy rate?
- Crime grade is F in this area — have there been break-ins, vandalism, or insurance claims at this property in the last 3 years? What carrier currently insures it and at what premium?
- The area grade is low — what's the realistic commute time and amenity access for the typical tenant pool here? Any planned neighborhood developments (good or bad) we should know about?
- This sits on a lake — are riparian / water-frontage rights deeded with the parcel? Any dock permits, shoreline easements, or HOA water-use restrictions?
- What's the documented flood / surge / shoreline-erosion history here (FEMA AND non-FEMA — e.g., storm surge, creek backup, septic-field saturation)?
- Any water-quality or seasonal algae-bloom issues that affect tenant satisfaction or short-term-rental demand?
- What's the average days-on-market for RENTAL listings here right now (not sales)? A rising rental-DOM trend means longer vacancies and softer asking-rent achievability than the comps imply.
- What's the recent tenant-quality profile in this submarket — average credit score on applications, eviction rate, late-payment / NSF rate, and stable-employment percentage? A property-management company in the area should have these aggregated.
- How much new for-sale + rental construction is in the pipeline within 1–3 miles? Heavy new supply typically softens prices + rents 12–24 months out; constrained supply supports both.
Investment metrics
- 1% rule
- 4.94% ✓
- Cap rate
- 44.84%
- Cash-on-cash
- 137.67%
- DSCR
- 7.13
- GRM
- 1.7
CMA / ARV
- ARV (on-the-fly)
- $150,920
- Comps found
- 1
Show comp detail 1 sale within ~0.75 mi
| Address | Dist | Beds/Ba | Sqft | Sold | Price | $/sf | Match |
|---|---|---|---|---|---|---|---|
| 2334 Sanbar Rd #23 | 0.00mi | 2/2.0 (-1) | 840 (-14%) | 23mo | $129,000 | $154 | 52 |
Match score weights: distance 35% · size 25% · config 20% · recency 20%. Top-matched comps best support the ARV.
Projected returns pro-forma
-3.0% appreciation · 3.0% rent growth · sell at horizon
- IRR
- —
- Equity multiple
- 7.73×
- Total profit
- $94,230
- Equity at exit
- $7,455
- IRR
- —
- Equity multiple
- 16.28×
- Total profit
- $213,925
- Equity at exit
- $4,323
Cash invested: $14,000 (down + closing). Projections, not guarantees.
Landlord ↔ Tenant lean methodology
- Overall (STATE)
- 87 Strongly Landlord-Friendly
- State Texas
- 87 Strongly Landlord-Friendly · R+5
- County
- — inherits STATE
- City
- — inherits STATE
ZIP-level market 76449
- Home prices YoY
- -27.7%
- Active inventory
- 465
- Price-to-rent
- 1.7×
Monthly cashflow live
- Estimated rent
- $2,470 medium interval (Pro) →
- Mortgage (P&I)
- −$262
- Tax est. 1.5%
- −$62 /mo · $750/yr
- Insurance
- −$21
- HOA
- −$0
- Vacancy / Maint / Mgmt
- −$519
- Net cashflow
- $1,606
Break-even live
UW: 25.0% down · 7.5% · 30yr · 1.5% tax · 5.0% vac · 8.0% maint · 8.0% mgmt
Financing live
Cash to close
- Down payment
- $12,500
- Closing costs
- $1,500
- Reserves months
- —
- Total cash needed
- —
Loan-product check · same deal, 3 products live
Conventional
25% down · 7.5% · 30yr
- Down + closing
- —
- Monthly P&I
- —
- Monthly cashflow
- —
- DSCR
- —
- Eligible?
- —
Personal DTI + credit; lowest rate.
DSCR
20% down · 8.5% · 30yr
- Down + closing
- —
- Monthly P&I
- —
- Monthly cashflow
- —
- DSCR
- —
- Eligible?
- —
No personal income docs; deal must DSCR.
Hard money
10% down · 12.0% · 12mo
- Down + closing
- —
- Monthly P&I
- —
- Monthly cashflow
- —
- DSCR
- —
- Eligible?
- —
Short-term bridge; refi at stabilization.
Listing history 9 events
-
2026-06-19days on market $50,000 Active 11 DOM
-
2026-06-18days on market $50,000 Active 10 DOM
-
2026-06-17days on market $50,000 Active 9 DOM
-
2026-06-16days on market $50,000 Active 8 DOM
-
2026-06-15days on market $50,000 Active 7 DOM
-
2026-06-14days on market $50,000 Active 5 DOM
-
2026-06-12days on market $50,000 Active 4 DOM
-
2026-06-09remarks 685-char remark
-
2026-06-09$50,000 Active 1 DOM
ⓘ Source: listings_history table (triggers on properties + properties_extension) + one-shot
backfill from property_details.listing_events for pre-trigger history.
Nearby sold comps map
Loading sold comps map…
Walkable amenities ~0.75 mi
Loading nearby amenities…
Taxation est. · year 1
- Rental income
- $29,645
- − Mortgage interest
- −$2,801
- − Property taxes
- −$750
- − Insurance
- −$250
- − Repairs & maintenance
- −$2,372
- − Management
- −$2,372
- − Depreciation
- −$1,455
- Taxable income
- $19,647
- Est. tax owed @ 24.0%
- −$4,715
- After-tax cash flow
- $14,558/yr
For passive investors: Depreciation is non-cash, so a rental often shows a tax loss while cash-flowing — sheltering income. Rental losses are passive: they offset passive income freely, and up to $25,000/yr can offset ordinary (W-2) income if you actively participate and your MAGI is under $100k (phasing out to $0 by $150k); unused losses carry forward. On sale, claimed depreciation is recaptured at up to 25%, and gains may owe capital-gains tax (a 1031 exchange can defer both). Figures are a year-1 estimate at your 24.0% rate — not tax advice; consult a CPA.
Condition & rehab AI · 1 photo
This property requires extensive repairs and maintenance, including major work on the exterior siding and roof, as well as landscaping improvements. Significant investment is needed to bring it up to a livable condition.
Repairs flagged
- Major exterior siding — Severe weathering and damage
- Major roof — Signs of wear and tear
- Major landscaping — Overgrown grass and lack of maintenance
Value-add opportunities
- Both landscaping and curb appeal — Enhances curb appeal and resale value
- Both exterior siding and roof repairs — Improves structural integrity and aesthetic appeal
Renovation cost estimate screening
| Repair item | Severity | Est. cost |
|---|---|---|
| exterior siding · Severe weathering and damage | Major | $15,000–50,000 |
| roof · Signs of wear and tear | Major | $15,000–50,000 |
| landscaping · Overgrown grass and lack of maintenance | Major | $15,000–50,000 |
| Total estimated repair cost · 3 items | $45,000–150,000 |
Value-add ROI direction
- Both landscaping and curb appeal — Enhances curb appeal and resale value ↑
- Both exterior siding and roof repairs — Improves structural integrity and aesthetic appeal ↑
ⓘ Cost ranges are severity-bucket heuristics (US national rule-of-thumb). Get contractor quotes + a written scope before underwriting a rehab budget.
Schools (NCES district)
- District
- Graford ISD
- NCES district ID
- 4821330
- Math proficiency
- 35% ▬ 0.00%
- Reading proficiency
- 40% ▲ 10.00%
- Median HH income
- $43,275
- Composite
- 34.3/100
- National rank
- #10225
- State rank
- #817 of 1141 in TX
Livability — Graford
- Score
- 63/100
- State rank
- #856
- US rank
- #15394
Category grades
Schools grade is shown separately in the Schools card above.
Census & demographics
- Population (ZIP)
- 2,157
Population outlook (Palo Pinto County) Hauer SSP2
- Today (2025)
- 27,500 people
- By 2030
- 27,079 · -1.5%
- By 2040
- 26,135 · -5.0%
- By 2050
- 25,215 · -8.3%
- By 2075
- 23,416 · -14.9%
- By 2100
- 20,300 · -26.2%
Race, ethnicity, and origin ACS 2023
- Neighborhood character
- Predominantly White (90%)
- Race & ethnicity
- White 90% Hispanic / Latino 7% Two or more races 4%
- Hispanic origin (detail)
- Mexican 5%
- Common ancestry
- Portuguese 1% Italian 1% Serbian 1%
- Foreign-born
- 2% · Canada
- Languages at home
- 95% English-only · Spanish 4%
Political lean MEDSL · Palo Pinto
- 2024 margin
- Solid R (+67.1) · D 16.1% · R 83.2%
- 2008→2024 swing
- -18.9pp toward R · 2008: -48.2pp · 2024: -67.1pp
- All cycles
- 2024: R+67.1 2020: R+64.1 2016: R+64.1 2012: R+59.8 2008: R+48.2
Not yet ingested
- Civics
- —
Market trends
- HPI YoY
- ▼ -92.53%
- Current HPI
- 241.6435
- Rent YoY
- —
- Metro
- —
- State GDP YoY
- ▲ 3.95%
- F500 in state
- 110
Industry mix (Fortune 500 HQ in TX)
| Industry | F500 HQs | Revenue |
|---|---|---|
| Energy | 16 | $1,198B |
|
||
| Technology | 5 | $198B |
|
||
| Engineering / Construction | 4 | $72B |
|
||
| Energy Services | 3 | $60B |
|
||
| Utilities | 3 | $41B |
|
||
| Healthcare | 2 | $330B |
|
||
Price history
-37.5% since first listed13 events — show timeline
- 2026-06-05 Listed $50,000 NTREIS
- 2024-11-30 Listing Removed — NTREIS
- 2024-11-01 Relisted — NTREIS
- 2024-10-31 Listing Removed — NTREIS
- 2024-09-20 Price Changed $40,000 NTREIS
- 2024-09-15 Listed $48,000 NTREIS
- 2021-11-12 Listing Removed — NTREIS
- 2021-11-11 Sold (MLS) — NTREIS
- 2021-09-27 Contingent — NTREIS
- 2021-08-05 Listed $71,643 NTREIS
- 2021-08-01 Listing Removed — NTREIS
- 2021-06-14 Price Changed $74,999 NTREIS
- 2021-01-31 Listed $80,000 NTREIS
Cash-flow waterfall
monthlySold comps — $/sqft
last 12 mo · ≤1 miLoading sold comps…