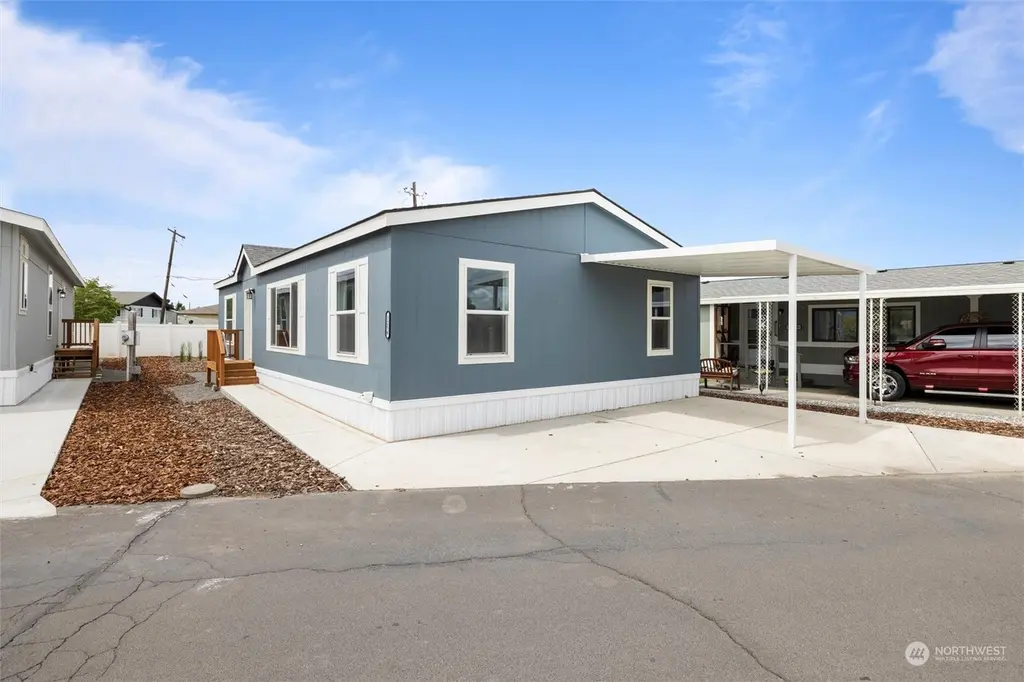
1256 Jones Dr · Walla Walla, WA
Flood risk 4/10 · Minor
- FEMA flood zone
- —
- Chance of flooding over 30 yrs
- 0.22%
- Est. flood insurance / yr
- —
Fire risk 1/10 · Minimal
- Est. fire insurance / yr
- $604 – $1,122
Heat risk 4/10 · Minor
- Hot days now (above 98°F)
- 7 days/yr
- Hot days in 30 yrs
- 15 days/yr
Wind risk 1/10 · Minimal
- Chance of severe wind over 30 yrs
- —
Air-quality risk 8/10 · Major
- Unhealthy air days now
- 9 days/yr
- Unhealthy air days in 30 yrs
- 13 days/yr
Risk factors via First Street. Map © Google.
Why this score? — see what drove the C grade
The composite is a weighted blend of 9 inputs, each scored 0–100. Each bar is that input's sub-score; the figure is the points it added to the 100-point composite (weight × sub-score).
- Cash flow +22.3/30.0
- ARV discount +7.5/15.0
- DSCR +7.1/10.0
- 1% rule +5.3/10.0
- Schools +4.1/10.0
- Livability +4.0/5.0
- Condition / age +4.0/5.0
- Rent growth +3.1/5.0
- Appreciation +0.0/10.0
$174,000
🖨 Deal sheet (PDF) 📄 Offer letter ✓ Due diligence
Listing remarks
ALL AGES WELCOME! 1 YEAR FREE RENT WITH ACCEPTABLE OFFER! SELLER FINANCING AVAILABLE! Brand New 3 bedroom, 2 bath manufactured home, located in Rancho Villa. Open concept living w/ a spacious living & dining room. Large living room, with picture window and mountain view. Kitchen has ample counter & cupboard space. Bar with seating area. Tiled backsplash. Stainless steel appliances in the kitchen are included. Neutral colors throughout. Primary bedroom w/ large closet, and bathroom w/ step-in shower. 2nd & 3rd bedrooms at the other end of the home plus full bathroom. Backyard is large - seller left a small section for patio or sod. Close to shopping and walking trails. Cal
Key facts
- 2 parking spots
- Built 2022
- Listed 1059 days
Neighborhood map
What this means for you Summary
Snapshot
- This is a 3-bed/2.0-bath manufactured listed at $174k. Condition is rated good.
Deal economics
- At list price, monthly cash flow is $285 ($3k/yr) — positive.
- The deal already cash-flows at list — no discount required.
- Meets the 1% rule at list price ($2k rent vs $174k).
- Recommended offer: $153k (12.0% below list) — sets the bar for market timing.
- Cap rate 8.3% vs local median 2.3% in Walla Walla — top-decile yield for the area; either an underpriced asset or a hidden risk that comps aren't pricing in. Stress-test before assuming the spread holds.
Location & tenants
- Location reads 79/100 on livability (#105 in WA, #2,015 nationally) — a middle-class / working-renter tenant base. Strengths: amenities A+, commute A+, housing A+; Watch: schools C-.
- Walla Walla Public Schools (urban): math 41% / reading 50% proficiency, ranked #179 of 291 in WA (top 62%) — families likely to look elsewhere, expect single-tenant / working-renter base with shorter leases.
- Market conditions: Rents rising (+2.4%/yr); 427 active listings in the ZIP; 11 comparable units currently listed for rent nearby; rentals lingering (median 45d on market — plan ~5-8 weeks vacancy on turnover, expect pricing pressure); 100% of comp listings sitting > 30 days — soft ceiling on asking rent; 206 units permitted in Walla Walla County in 2024 (50 in 5+ unit buildings).
Forward outlook
- Local home prices are declining (-3.0%/yr); year-one equity from $1k of loan paydown is wiped out by about $5k of value loss. Plan a longer hold.
- Walla Walla County population projected at +8% by 2050 — modest demand growth; plan on rents tracking national, not racing it.
Negotiation context
- It's been on market 1060 days — a 12% lower offer ($153k) is reasonable based on typical stale-listing flexibility.
- 2 sale attempts since 3y ago with the ask held roughly flat each time — persistent listings suggest the price (not the market) is what's stuck; bring a comps-based counter.
Questions for the listing agent
- It's been on market 1060 days. Have you received any prior offers? Is the seller open to a 12% concession, seller financing, or rate buy-down credit?
- Why hasn't it sold? Are there any deal-killer items the seller is aware of (foundation, flood, title, zoning, code violations)?
- Is there a deadline driving the sale (1031 exchange, divorce, estate, relocation)? That informs how much negotiation room exists.
- What's the average days-on-market for RENTAL listings here right now (not sales)? A rising rental-DOM trend means longer vacancies and softer asking-rent achievability than the comps imply.
- What's the recent tenant-quality profile in this submarket — average credit score on applications, eviction rate, late-payment / NSF rate, and stable-employment percentage? A property-management company in the area should have these aggregated.
- How much new for-sale + rental construction is in the pipeline within 1–3 miles? Heavy new supply typically softens prices + rents 12–24 months out; constrained supply supports both.
Investment metrics
- 1% rule
- 1.03% ✓
- Cap rate
- 8.26%
- Cash-on-cash
- 7.02%
- DSCR
- 1.31
- GRM
- 8.1
CMA / ARV
- ARV (median comp)
- $74,980
- List price
- $174,000
- Delta
- 132.06%
- Verdict
- OVERPRICED
- Comps
- 20 within 1.0 mi
Show comp detail 12 sales within ~0.75 mi
| Address | Dist | Beds/Ba | Sqft | Sold | Price | $/sf | Match |
|---|---|---|---|---|---|---|---|
| 1260 Jones Dr | 0.01mi | 3/2.0 | 1,344 (+4%) | 3mo | $170,000 | $126 | 91 |
| 1252 Jones Dr | 0.01mi | 3/2.0 | 1,344 (+4%) | 7mo | $120,000 | $89 | 88 |
| 1236 Jones Dr | 0.04mi | 3/2.0 | 1,214 (-6%) | 1mo | $49,900 | $41 | 86 |
| 1328 Samuel | 0.18mi | 3/2.0 | 1,352 (+4%) | 0mo | $65,000 | $48 | 84 |
| 1400 Samuel Dr | 0.32mi | 3/2.0 | 1,280 (-1%) | 2mo | $169,900 | $133 | 81 |
| 1312 Rancho Villa Dr | 0.10mi | 3/2.0 | 1,352 (+4%) | 10mo | $125,000 | $92 | 80 |
| 1326 Samuel Dr | 0.17mi | 3/2.0 | 1,334 (+3%) | 10mo | $57,900 | $43 | 79 |
| 1312 Gloria Ln | 0.35mi | 3/2.0 | 1,344 (+4%) | 9mo | $62,000 | $46 | 70 |
| 1372 Samuel Dr | 0.36mi | 2/2.0 (-1) | 1,334 (+3%) | 6mo | $55,000 | $41 | 68 |
| 1370 Samuel Dr | 0.35mi | 3/2.0 | 1,416 (+9%) | 6mo | $135,000 | $95 | 63 |
| 67 Jade St | 0.75mi | 3/2.0 | 1,344 (+4%) | 2mo | $107,000 | $80 | 58 |
| 1344 Gloria Ln | 0.33mi | 3/2.0 | 1,464 (+13%) | 10mo | $190,000 | $130 | 54 |
Match score weights: distance 35% · size 25% · config 20% · recency 20%. Top-matched comps best support the ARV.
Projected returns pro-forma
-3.0% appreciation · 2.4% rent growth · sell at horizon
- IRR
- -6.2%
- Equity multiple
- 0.77×
- Total profit
- $-11,125
- Equity at exit
- $25,944
- IRR
- 2.7%
- Equity multiple
- 1.19×
- Total profit
- $9,273
- Equity at exit
- $15,044
Cash invested: $48,720 (down + closing). Projections, not guarantees.
Landlord ↔ Tenant lean methodology
- Overall (STATE)
- 28 Tenant-Leaning
- State Washington
- 28 Tenant-Leaning · D+8
- County
- — inherits STATE
- City
- — inherits STATE
ZIP-level market 99362
- Rents YoY
- 2.4%
- Active inventory
- 427
- Price-to-rent
- 8.1×
Monthly cashflow live
- Estimated rent
- $1,785 high interval (Pro) →
- Mortgage (P&I)
- −$912
- Tax from tax record
- −$140 /mo · $1,684/yr
- Insurance
- −$72
- HOA
- −$0
- Vacancy / Maint / Mgmt
- −$375
- Net cashflow
- $285
Break-even live
Sensitivity live
| Price | -10% $384 | -5% $334 | +0% $285 | +5% $236 | +10% $187 |
|---|---|---|---|---|---|
| Rent | -10% $144 | -5% $215 | +0% $285 | +5% $356 | +10% $426 |
| Rate | -1.0pp $373 | -0.5pp $329 | base $285 | +0.5pp $240 | +1.0pp $194 |
UW: 25.0% down · 7.5% · 30yr · 1.5% tax · 5.0% vac · 8.0% maint · 8.0% mgmt
Financing live
Cash to close
- Down payment
- $43,500
- Closing costs
- $5,220
- Reserves months
- —
- Total cash needed
- —
Loan-product check · same deal, 3 products live
Conventional
25% down · 7.5% · 30yr
- Down + closing
- —
- Monthly P&I
- —
- Monthly cashflow
- —
- DSCR
- —
- Eligible?
- —
Personal DTI + credit; lowest rate.
DSCR
20% down · 8.5% · 30yr
- Down + closing
- —
- Monthly P&I
- —
- Monthly cashflow
- —
- DSCR
- —
- Eligible?
- —
No personal income docs; deal must DSCR.
Hard money
10% down · 12.0% · 12mo
- Down + closing
- —
- Monthly P&I
- —
- Monthly cashflow
- —
- DSCR
- —
- Eligible?
- —
Short-term bridge; refi at stabilization.
Rent comps 11 comps
| Address | Beds | Baths | Sqft | Rent | $/sqft | DOM | Units | Dist |
|---|---|---|---|---|---|---|---|---|
| 208 Marjorie Pl Unit marj208 Walla Walla, WA | 3.0 | 2.0 | 1080 | $1,295 | $1.20 | 45d | 1 | 0.60mi |
| 1908 Sunset Dr Unit 217 Walla Walla, WA | 3.0 | 2.5 | 1500 | $2,050 | $1.37 | 45d | 1 | 0.63mi |
| 1914 Sunset Dr Unit 1914SUN-B Walla Walla, WA | 2.0 | 1.5 | 952 | $1,625 | $1.71 | 45d | 1 | 0.65mi |
| 1339 Modoc St Walla Walla, WA | 2.0 | 2.0 | 1187 | $2,195 | $1.85 | 45d | 1 | 0.78mi |
| 332 S 3rd Ave Walla Walla, WA | 2.0 | 1.0 | 1084 | $1,630 | $1.50 | 45d | 1 | 1.02mi |
| 265 Avery St Walla Walla, WA | 3.0 | 2.5 | 1268 | $1,995 | $1.57 | 45d | 1 | 1.07mi |
| 2121 S 2nd Ave Apt 304 Walla Walla, WA | 2.0 | 1.5 | 975 | $1,530 | $1.57 | 45d | 1 | 1.11mi |
| 420 Catherine St #3 Walla Walla, WA | 2.0 | 1.0 | 890 | $1,295 | $1.46 | 45d | 1 | 1.19mi |
| 942 NE Spitzenburg St Apt B104 College Place, WA | 2.0 | 1.5 | 975 | $1,530 | $1.57 | 45d | 1 | 1.29mi |
| 425 N 7th Ave Apt 2 Walla Walla, WA | 4.0 | 2.5 | 1697 | $1,795 | $1.06 | 45d | 1 | 1.30mi |
| 22 NE Hadley Way #1 College Place, WA | 2.0 | 2.5 | 1150 | $2,095 | $1.82 | 45d | 1 | 1.42mi |
Listing history 18 events
-
2026-06-21days on market $174,000 Active 1060 DOM
-
2026-06-19days on market $174,000 Active 1058 DOM
-
2026-06-18days on market $174,000 Active 1057 DOM
-
2026-06-17days on market $174,000 Active 1056 DOM
-
2026-06-16days on market $174,000 Active 1055 DOM
-
2026-06-15days on market $174,000 Active 1054 DOM
-
2026-06-14days on market $174,000 Active 1052 DOM
-
2026-06-12days on market $174,000 Active 1051 DOM
-
2026-06-09days on market $174,000 Active 1048 DOM
-
2026-06-08days on market $174,000 Active 1047 DOM
-
2026-06-07days on market $174,000 Active 1046 DOM
-
2026-06-02days on market $174,000 Active 1041 DOM
-
2026-06-01days on market $174,000 Active 1040 DOM
-
2026-05-31days on market $174,000 Active 1039 DOM
-
2026-05-30days on market $174,000 Active 1038 DOM
-
2026-02-24price $174,000
-
2024-08-13status Active
-
2023-07-14$179,000 Active
ⓘ Source: listings_history table (triggers on properties + properties_extension) + one-shot
backfill from property_details.listing_events for pre-trigger history.
Tax reassessment forecast WA · Resets to sale price
- Current annual tax
- $1,684 · $140/mo
- Projected year-2 tax
- $1,705 · $142/mo
- Expected delta
- +$21/yr (+$2/mo · 1.2%)
ⓘ Screening estimate from a state-policy table — verify with the county assessor before closing.
Climate risk First Street
- Flood 4/10 Moderate 22% chance over 30 yrs
- Wildfire 1/10 Low
- Heat 4/10 Moderate 7 d/yr ≥98°F today · 15 d/yr by 30 yrs out
- Wind 1/10 Low
- Air quality 8/10 Severe 9 unhealthy d/yr today · 13 by 30 yrs out
Nearby sold comps map
Loading sold comps map…
Walkable amenities ~0.75 mi
Loading nearby amenities…
Taxation est. · year 1
- Rental income
- $21,425
- − Mortgage interest
- −$9,747
- − Property taxes
- −$1,684
- − Insurance
- −$870
- − Repairs & maintenance
- −$1,714
- − Management
- −$1,714
- − Depreciation
- −$5,062
- Taxable income
- $634
- Est. tax owed @ 24.0%
- −$152
- After-tax cash flow
- $3,270/yr
For passive investors: Depreciation is non-cash, so a rental often shows a tax loss while cash-flowing — sheltering income. Rental losses are passive: they offset passive income freely, and up to $25,000/yr can offset ordinary (W-2) income if you actively participate and your MAGI is under $100k (phasing out to $0 by $150k); unused losses carry forward. On sale, claimed depreciation is recaptured at up to 25%, and gains may owe capital-gains tax (a 1031 exchange can defer both). Figures are a year-1 estimate at your 24.0% rate — not tax advice; consult a CPA.
Condition & rehab AI · 12 photos
This manufactured home is in good condition with a fresh exterior and neutral interior. It offers a good balance of curb appeal and interior space, making it a solid investment.
Value-add opportunities
- Both Painting the exterior — Fresh paint can enhance curb appeal and property value
- Both Landscaping the front yard — A well-maintained front yard can improve curb appeal and attract potential buyers
- Both Upgrading the flooring in the bedrooms — Replacing carpet with hardwood or tile can increase the home's value and appeal to a wider range of buyers
Renovation cost estimate screening
Value-add ROI direction
- Both Painting the exterior — Fresh paint can enhance curb appeal and property value ↑
- Both Landscaping the front yard — A well-maintained front yard can improve curb appeal and attract potential buyers ↑
- Both Upgrading the flooring in the bedrooms — Replacing carpet with hardwood or tile can increase the home's value and appeal to a wider range of buyers ↑
ⓘ Cost ranges are severity-bucket heuristics (US national rule-of-thumb). Get contractor quotes + a written scope before underwriting a rehab budget.
Schools (NCES district)
- District
- Walla Walla Public Schools
- NCES district ID
- 5309450
- Math proficiency
- 41% ▲ 3.00%
- Reading proficiency
- 50% ▼ -1.00%
- Median HH income
- $46,207
- Composite
- 40.88/100
- National rank
- #7531
- State rank
- #179 of 291 in WA
Livability — Walla Walla
- Score
- 79/100
- State rank
- #105
- US rank
- #2015
Category grades
Schools grade is shown separately in the Schools card above.
Census & demographics
- Census place
- Walla Walla, WA
- County
- Walla Walla County · 52,990 people
- City population
- 42,853
- Metro
- Walla Walla, WA
- Population (ZIP)
- 42,853
- Household income
- $72,474
- Rent vs Own
- Severe rent burden
- 1238.0
Population outlook (Walla Walla County) Hauer SSP2
- Today (2025)
- 63,088 people
- By 2030
- 64,417 · +2.1%
- By 2040
- 66,563 · +5.5%
- By 2050
- 68,337 · +8.3%
- By 2075
- 73,235 · +16.1%
- By 2100
- 74,878 · +18.7%
Race, ethnicity, and origin ACS 2023
- Neighborhood character
- Predominantly White (69%)
- Race & ethnicity
- White 69% Hispanic / Latino 22% Two or more races 9% Black 2% Asian 2% Native American 2%
- Hispanic origin (detail)
- Mexican 17%
- Common ancestry
- Slovak 3% Portuguese 3% Lithuanian 3%
- Foreign-born
- 9% · Canada, China
- Languages at home
- 83% English-only · Spanish 15% Chinese 1%
Political lean MEDSL · Walla Walla
- 2024 margin
- Lean R (+8.1) · D 44.6% · R 52.7% · Other 2.7%
- 2008→2024 swing
- +8.5pp toward D · 2008: -16.6pp · 2024: -8.1pp
- All cycles
- 2024: R+8.1 2020: R+8.7 2016: R+16.4 2012: R+22.3 2008: R+16.6
Not yet ingested
- Civics
- —
Market trends
- HPI YoY
- ▼ -488.03%
- Current HPI
- 321.6891
- Rent YoY
- ▲ 2.40%
- Metro
- Walla Walla, WA
- State GDP YoY
- ▲ 4.65%
- F500 in state
- 22
Industry mix (Fortune 500 HQ in WA)
| Industry | F500 HQs | Revenue |
|---|---|---|
| Retail | 2 | $269B |
|
||
| Technology / Retail | 1 | $638B |
|
||
| Technology | 1 | $245B |
|
||
| Telecommunications | 1 | $38B |
|
||
| Food / Beverage | 1 | $36B |
|
||
| Automotive / Trucks | 1 | $34B |
|
||
Price history
-2.8% since first listed3 events — show timeline
- 2026-02-24 Price Changed $174,000 NWMLS as Distributed by MLS Grid
- 2024-08-13 Relisted — NWMLS as Distributed by MLS Grid
- 2023-07-14 Listed $179,000 NWMLS as Distributed by MLS Grid
Property tax history
+5.1%/yrLatest (2026): $1,684 · -1.3% YoY. Source: county tax records.
Cash-flow waterfall
monthlySold comps — $/sqft
last 12 mo · ≤1 miLoading sold comps…