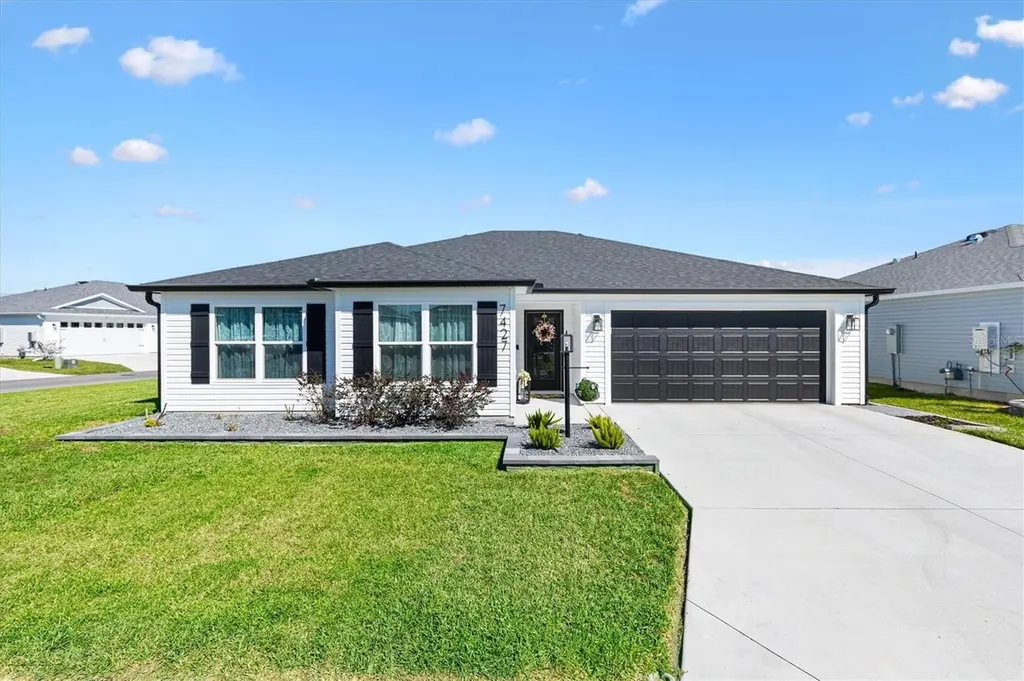
7427 Munday Ln · Wildwood, FL
Flood risk No data
- FEMA flood zone
- —
- Chance of flooding over 30 yrs
- —
- Est. flood insurance / yr
- —
Fire risk No data
- Est. fire insurance / yr
- —
Heat risk No data
- Hot days now (above threshold)
- —
- Hot days in 30 yrs
- —
Wind risk No data
- Chance of severe wind over 30 yrs
- —
Air-quality risk No data
- Unhealthy air days now
- —
- Unhealthy air days in 30 yrs
- —
Risk factors via First Street. Map © Google.
Why this score? — see what drove the C- grade
The composite is a weighted blend of 9 inputs, each scored 0–100. Each bar is that input's sub-score; the figure is the points it added to the 100-point composite (weight × sub-score).
- Cash flow +14.9/30.0
- ARV discount +7.1/15.0
- Appreciation +7.0/10.0
- Schools +5.2/10.0
- DSCR +4.6/10.0
- 1% rule +4.1/10.0
- Condition / age +3.8/5.0
- Livability +3.5/5.0
- Rent growth +2.5/5.0
$359,900
🖨 Deal sheet (PDF) 📄 Offer letter ✓ Due diligence
Listing remarks
Under contract-accepting backup offers. Back on the market due to the buyer’s home sale contingency falling through. Can you belive I was transferred and now I have to leave my beautiful home. My loss is your gain. . I am a 2025-built ANCHOR Floor Plan sitting pretty on a large corner lot on a quiet street in WATERS EDGE, and yes, I am fully aware of how good I look. 3/2 WITH LVP FLOORING throughout, except the bathrooms there I put cool TILE and PRETTY ACCENT WALLS that have been stopping visitors in their tracks since the day I was finished. I did not come here to blend in. My kitchen is not messing around. QUARTZ Countertops, a full PANTRY, and enough CABINET STORAGE that you will
Key facts
- Quiet street
- Quartz countertops
- Full pantry
Tags
Neighborhood map
What this means for you Summary
Snapshot
- This is a 3-bed/2.0-bath single-family listed at $360k. Condition is rated good.
Deal economics
- At list price, monthly cash flow is $109 ($1k/yr) — positive.
- The deal already cash-flows at list — no discount required.
- To meet the 1% rule (rent ≥ 1% of price), the offer needs to be $329k (8.7% below list).
- Recommended offer: $329k (8.7% below list) — sets the bar for 1% rule.
- Cap rate 6.7% vs local median 3.9% in Wildwood — top-decile yield for the area; either an underpriced asset or a hidden risk that comps aren't pricing in. Stress-test before assuming the spread holds.
Location & tenants
- Location reads 69/100 on livability (#471 in FL) — a middle-class / working-renter tenant base. Strengths: health & safety A+, cost of living A, crime A-; Watch: amenities F, commute F, employment D-.
- Sumter (rural): math 61% / reading 61% proficiency, ranked #11 of 73 in FL (top 15%) — acceptable for families but not a draw, mixed tenant base, ~2y average lease.
- Zoned schools: Lake Panasoffkee Elementary School (math 62% / reading 66%, grade B, #552 of 2,144 statewide, top 26%, 584 students, 65% FRL); South Sumter Middle School (math 55% / reading 54%, grade B-, #183 of 571 statewide, top 34%, 897 students, 61% FRL).
- Market conditions: 101 active listings in the ZIP; 2 comparable units currently listed for rent nearby; 3,961 units permitted in Sumter County in 2024 (248 in 5+ unit buildings).
Forward outlook
- In year one you build about $17k of equity ($2k loan paydown + $14k appreciation (3.9% local appreciation)).
- Sumter County population projected at +45% by 2050 — long-run rental-demand tailwind backs the buy-and-hold thesis.
- At projected returns (3.9% appreciation + 3.0% rent growth), your $101k cash investment doubles in ~5 years — after that, you're playing with house money.
- By year 3, paydown + projected appreciation supports a ~$41k cash-out refi (75% LTV) — recoverable capital for the next deal without selling this one.
Negotiation context
- It's been on market 23 days — a 2% lower offer ($355k) is reasonable based on typical stale-listing flexibility.
- 2 sale attempts with the ask held roughly flat each time — persistent listings suggest the price (not the market) is what's stuck; bring a comps-based counter.
Questions for the listing agent
- Is there a deadline driving the sale (1031 exchange, divorce, estate, relocation)? That informs how much negotiation room exists.
- What's the average days-on-market for RENTAL listings here right now (not sales)? A rising rental-DOM trend means longer vacancies and softer asking-rent achievability than the comps imply.
- What's the recent tenant-quality profile in this submarket — average credit score on applications, eviction rate, late-payment / NSF rate, and stable-employment percentage? A property-management company in the area should have these aggregated.
- How much new for-sale + rental construction is in the pipeline within 1–3 miles? Heavy new supply typically softens prices + rents 12–24 months out; constrained supply supports both.
Investment metrics
- 1% rule
- 0.91% ✗
- Cap rate
- 6.66%
- Cash-on-cash
- 1.29%
- DSCR
- 1.06
- GRM
- 9.1
CMA / ARV
- ARV (on-the-fly)
- $356,352
- Comps found
- 4
Show comp detail 4 sales within ~0.75 mi
| Address | Dist | Beds/Ba | Sqft | Sold | Price | $/sf | Match |
|---|---|---|---|---|---|---|---|
| 7427 Munday Ln | 0.00mi | 3/2.0 | 1,536 (0%) | 1mo | $356,000 | $232 | 99 |
| 7608 Daniel Hearns Way | 0.42mi | 3/2.0 | 1,431 (-7%) | 1mo | $315,000 | $220 | 68 |
| 1669 Cadorette Dr | 0.63mi | 3/2.0 | 1,497 (-2%) | 4mo | $380,000 | $254 | 63 |
| 1639 Seiver St | 0.71mi | 3/2.0 | 1,431 (-7%) | 3mo | $318,000 | $222 | 53 |
Match score weights: distance 35% · size 25% · config 20% · recency 20%. Top-matched comps best support the ARV.
Projected returns pro-forma
3.92% appreciation · 3.0% rent growth · sell at horizon
- IRR
- 11.2%
- Equity multiple
- 1.68×
- Total profit
- $68,065
- Equity at exit
- $180,697
- IRR
- 12.9%
- Equity multiple
- 3.10×
- Total profit
- $211,638
- Equity at exit
- $294,136
Cash invested: $100,772 (down + closing). Projections, not guarantees.
Landlord ↔ Tenant lean methodology
- Overall (STATE)
- 87 Strongly Landlord-Friendly
- State Florida
- 87 Strongly Landlord-Friendly · R+3
- County
- — inherits STATE
- City
- — inherits STATE
ZIP-level market 34762
- Home prices YoY
- 1.1%
- Active inventory
- 101
- Price-to-rent
- 9.1×
Monthly cashflow live
- Estimated rent
- $3,286 medium interval (Pro) →
- Mortgage (P&I)
- −$1,887
- Tax est. 1.5%
- −$450 /mo · $5,398/yr
- Insurance
- −$150
- HOA
- −$0
- Vacancy / Maint / Mgmt
- −$690
- Net cashflow
- $109
Break-even live
Sensitivity live
| Price | -10% $357 | -5% $233 | +0% $109 | +5% $-16 | +10% $-140 |
|---|---|---|---|---|---|
| Rent | -10% $-151 | -5% $-21 | +0% $109 | +5% $238 | +10% $368 |
| Rate | -1.0pp $290 | -0.5pp $200 | base $109 | +0.5pp $15 | +1.0pp $-79 |
UW: 25.0% down · 7.5% · 30yr · 1.5% tax · 5.0% vac · 8.0% maint · 8.0% mgmt
Financing live
Cash to close
- Down payment
- $89,975
- Closing costs
- $10,797
- Reserves months
- —
- Total cash needed
- —
Loan-product check · same deal, 3 products live
Conventional
25% down · 7.5% · 30yr
- Down + closing
- —
- Monthly P&I
- —
- Monthly cashflow
- —
- DSCR
- —
- Eligible?
- —
Personal DTI + credit; lowest rate.
DSCR
20% down · 8.5% · 30yr
- Down + closing
- —
- Monthly P&I
- —
- Monthly cashflow
- —
- DSCR
- —
- Eligible?
- —
No personal income docs; deal must DSCR.
Hard money
10% down · 12.0% · 12mo
- Down + closing
- —
- Monthly P&I
- —
- Monthly cashflow
- —
- DSCR
- —
- Eligible?
- —
Short-term bridge; refi at stabilization.
Rent comps 2 comps
| Address | Beds | Baths | Sqft | Rent | $/sqft | DOM | Units | Dist |
|---|---|---|---|---|---|---|---|---|
| 7661 Rutherford Ln Sumterville, FL | 3.0 | 2.0 | 1505 | $3,200 | $2.13 | 22d | 1 | 0.63mi |
| 6776 Robinette Run Sumterville, FL | 3.0 | 2.0 | 1929 | $3,450 | $1.79 | 22d | 1 | 0.98mi |
Listing history 4 events
-
2026-04-19status Pending
-
2026-03-31status Active
-
2026-03-29status Pending
-
2026-03-24$359,900 Active
ⓘ Source: listings_history table (triggers on properties + properties_extension) + one-shot
backfill from property_details.listing_events for pre-trigger history.
Nearby sold comps map
Loading sold comps map…
Walkable amenities ~0.75 mi
Loading nearby amenities…
Taxation est. · year 1
- Rental income
- $39,431
- − Mortgage interest
- −$20,160
- − Property taxes
- −$5,398
- − Insurance
- −$1,800
- − Repairs & maintenance
- −$3,154
- − Management
- −$3,154
- − Depreciation
- −$10,470
- Taxable loss
- −$4,706
- Est. tax savings @ 24.0%
- +$1,129
- After-tax cash flow
- $2,434/yr
For passive investors: Depreciation is non-cash, so a rental often shows a tax loss while cash-flowing — sheltering income. Rental losses are passive: they offset passive income freely, and up to $25,000/yr can offset ordinary (W-2) income if you actively participate and your MAGI is under $100k (phasing out to $0 by $150k); unused losses carry forward. On sale, claimed depreciation is recaptured at up to 25%, and gains may owe capital-gains tax (a 1031 exchange can defer both). Figures are a year-1 estimate at your 24.0% rate — not tax advice; consult a CPA.
Condition & rehab AI · 2 photos
This 2025-built single-family home is in good condition with cosmetic updates, ready for a new owner.
Value-add opportunities
- Both Paint exterior — Enhances curb appeal and value
- Both Landscaping improvements — Improves curb appeal and enhances property value
Renovation cost estimate screening
Value-add ROI direction
- Both Paint exterior — Enhances curb appeal and value ↑
- Both Landscaping improvements — Improves curb appeal and enhances property value ↑
ⓘ Cost ranges are severity-bucket heuristics (US national rule-of-thumb). Get contractor quotes + a written scope before underwriting a rehab budget.
Schools (NCES district)
- District
- Sumter
- NCES district ID
- 1201800
- Math proficiency
- 61% ▼ -4.00%
- Reading proficiency
- 61% ▼ -2.00%
- Median HH income
- $48,240
- Composite
- 51.74/100
- National rank
- #1682
- State rank
- #11 of 73 in FL
Livability — Wildwood
- Score
- 69/100
- State rank
- #471
- US rank
- #8500
Category grades
Schools grade is shown separately in the Schools card above.
Census & demographics
- Census place
- Wildwood, FL
- City population
- 21,568
- Population (ZIP)
- 580
Population outlook (Sumter County) Hauer SSP2
- Today (2025)
- 161,172 people
- By 2030
- 180,083 · +11.7%
- By 2040
- 209,892 · +30.2%
- By 2050
- 234,186 · +45.3%
- By 2075
- 284,602 · +76.6%
- By 2100
- 317,039 · +96.7%
Race, ethnicity, and origin ACS 2023
- Neighborhood character
- Predominantly White (68%)
- Race & ethnicity
- White 68% Hispanic / Latino 20% Two or more races 16% Black 12%
- Hispanic origin (detail)
- Cuban 13%
- Foreign-born
- 13% · Canada
- Languages at home
- 82% English-only · Spanish 18%
Political lean MEDSL · Sumter
- 2024 margin
- Solid R (+37.6) · D 30.9% · R 68.6%
- 2008→2024 swing
- -10.6pp toward R · 2008: -27.0pp · 2024: -37.6pp
- All cycles
- 2024: R+37.6 2020: R+36.1 2016: R+39.2 2012: R+34.9 2008: R+27.0
Not yet ingested
- Civics
- —
Market trends
- HPI YoY
- ▲ 3.92%
- Current HPI
- 365.7475
- Rent YoY
- —
- Metro
- —
- State GDP YoY
- ▲ 3.28%
- F500 in state
- 36
Industry mix (Fortune 500 HQ in FL)
| Industry | F500 HQs | Revenue |
|---|---|---|
| Industrial Technology | 2 | $29B |
|
||
| Insurance | 2 | $17B |
|
||
| Retail | 1 | $60B |
|
||
| Technology Distribution | 1 | $58B |
|
||
| Homebuilding | 1 | $35B |
|
||
| Technology Manufacturing | 1 | $35B |
|
||
Price history
4 events — show timeline
- 2026-04-19 Pending — Stellar MLS as Distributed by MLS Grid
- 2026-03-31 Relisted — Stellar MLS as Distributed by MLS Grid
- 2026-03-29 Pending — Stellar MLS as Distributed by MLS Grid
- 2026-03-24 Listed $359,900 Stellar MLS as Distributed by MLS Grid
Cash-flow waterfall
monthlySold comps — $/sqft
last 12 mo · ≤1 miLoading sold comps…