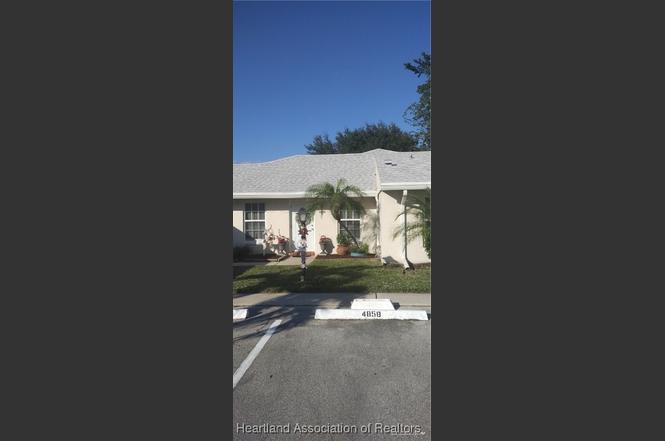
487 Holyoke Ln · Greenacres, FL
Flood risk 1/10 · Minimal
- FEMA flood zone
- X (unshaded)
- Chance of flooding over 30 yrs
- 0.0%
- Est. flood insurance / yr
- $507 – $1,088
Fire risk 1/10 · Minimal
- Est. fire insurance / yr
- $947 – $1,759
Heat risk 9/10 · Severe
- Hot days now (above 106°F)
- 7 days/yr
- Hot days in 30 yrs
- 25 days/yr
Wind risk 10/10 · Severe
- Chance of severe wind over 30 yrs
- 99.0%
Air-quality risk 2/10 · Minimal
- Unhealthy air days now
- 0 days/yr
- Unhealthy air days in 30 yrs
- 2 days/yr
Risk factors via First Street. Map © Google.
Why this score? — see what drove the C+ grade
The composite is a weighted blend of 9 inputs, each scored 0–100. Each bar is that input's sub-score; the figure is the points it added to the 100-point composite (weight × sub-score).
- Cash flow +25.1/30.0
- DSCR +8.2/10.0
- ARV discount +7.5/15.0
- 1% rule +6.8/10.0
- Schools +4.3/10.0
- Livability +3.5/5.0
- Condition / age +2.5/5.0
- Rent growth +2.4/5.0
- Appreciation +0.0/10.0
$165,000
🖨 Deal sheet 📄 Offer letter ✓ Due diligence
Listing remarks MLS
OWNER'S PRIDE SHOWS IN THIS IMMACULATELY KEPT UNIT WHICH APPEARS MUCH LARGER THAN TOTAL SQUARE FOOTAGE. TILE THROUGHOUT LIVING AREAS W/ CARPET IN BEDROOM & FLORIDA ROOM. LOWEST PRICED UNIT MAKING THIS UNDOUBTEDLY THE BEST BUY IN THE AREA!!
Key facts
- Back yard
- Closed patio
- Green grass lawn
Tags
Property features AI
Finance
- Other: Lot frontage approximately 20 (private frontage); Zoned residential
- HOA & community: Homeowners association with monthly fee
Exterior
- Parking: Assigned parking; Detached parking
- Utilities: Public water; Public sewer (sewer available)
- Home design: Residential condominium; One level
- Construction: Block and concrete construction; Shingle roof
- Exterior features: Enclosed patio/porch; Front porch; In-ground pool; Paved private road access (private maintained road)
Interior
- Flooring: Tile
- Bathrooms: One full bathroom
- Heating & cooling: Central heating (electric); Central air conditioning (electric)
- Interior features: Blinds on windows; Tile flooring; Five total rooms
Neighborhood map
What this means for you Summary
Snapshot
- This is a 1-bed/1.0-bath condo listed at $165k.
Deal economics
- At list price, monthly cash flow is $366 ($4k/yr) — positive.
- The deal already cash-flows at list — no discount required.
- Meets the 1% rule at list price ($2k rent vs $165k).
- Recommended offer: $145k (12.0% below list) — sets the bar for market timing.
Location & tenants
- Location reads 69/100 on livability (#490 in FL) — a middle-class / working-renter tenant base. Strengths: cost of living A+, housing A+, health & safety A; Watch: schools D+, employment D, amenities F.
- Palm Beach (suburban): math 46% / reading 53% proficiency, ranked #34 of 73 in FL (top 47%) — families likely to look elsewhere, expect single-tenant / working-renter base with shorter leases.
- Market conditions: Rents soft (-0.4%/yr); 651 active listings in the ZIP; 13 comparable units currently listed for rent nearby; rentals at typical pace (median 15d on market — plan ~3-4 weeks tenant-placement turnaround); solid renter incomes; 3,974 units permitted in Palm Beach County in 2024 (1,012 in 5+ unit buildings).
Forward outlook
- Local home prices are declining (-3.0%/yr); year-one equity from $1k of loan paydown is wiped out by about $5k of value loss. Plan a longer hold.
- Palm Beach County population projected at +30% by 2050 — long-run rental-demand tailwind backs the buy-and-hold thesis.
Negotiation context
- It's been on market 178 days — a 12% lower offer ($145k) is reasonable based on typical stale-listing flexibility.
- 2 sale attempts since 19y ago; this cycle's ask has dropped $14k (8%) from the opening price — seller is motivated, your offer sets the floor, not the list.
- Current owner paid $100; list at $165k implies a 164900% gain — meaningful room to come down on a strong offer.
Risks & watch-outs
- Climate carrying-cost: severe wind risk, 99% chance of damaging wind over 30y; extreme-heat days projected 7→25/yr by 2055 (HVAC capex compounding) — expect insurance premiums to compound above CPI over the hold.
Questions for the listing agent
- It's been on market 178 days. Have you received any prior offers? Is the seller open to a 12% concession, seller financing, or rate buy-down credit?
- What does the HOA fee cover, when was the last increase, and are there any pending special assessments or reserve-fund shortfalls?
- Any open or pending special assessments — roof, HVAC, plumbing, elevator, façade? What's the per-unit balance and payoff schedule, and is the seller paying it off at close or rolling it to the buyer?
- Why hasn't it sold? Are there any deal-killer items the seller is aware of (foundation, flood, title, zoning, code violations)?
- Is there a deadline driving the sale (1031 exchange, divorce, estate, relocation)? That informs how much negotiation room exists.
- Schools are D-rated, which usually means shorter tenancies and higher turnover. Who's the typical renter profile here, and what's been the actual vacancy rate?
- What's the average days-on-market for RENTAL listings here right now (not sales)? A rising rental-DOM trend means longer vacancies and softer asking-rent achievability than the comps imply.
- What's the recent tenant-quality profile in this submarket — average credit score on applications, eviction rate, late-payment / NSF rate, and stable-employment percentage? A property-management company in the area should have these aggregated.
- How much new apartment / multifamily construction is in the pipeline within 1–3 miles? Heavy new supply (>2% of stock underway) typically softens rents 12–24 months out; light construction supports rent growth.
Investment metrics
- 1% rule
- 1.18% ✓
- Cap rate
- 8.95%
- Cash-on-cash
- 9.51%
- DSCR
- 1.42
- GRM
- 7.1
CMA / ARV
No comps found within radius.
Projected returns pro-forma
-3.0% appreciation · 0.0% rent growth · sell at horizon
- IRR
- -5.4%
- Equity multiple
- 0.80×
- Total profit
- $-9,065
- Equity at exit
- $24,602
- IRR
- 0.1%
- Equity multiple
- 1.01×
- Total profit
- $340
- Equity at exit
- $14,266
Cash invested: $46,200 (down + closing). Projections, not guarantees.
Landlord ↔ Tenant lean methodology
- Overall (STATE)
- 87 Strongly Landlord-Friendly
- State Florida
- 87 Strongly Landlord-Friendly · R+3
- County
- — inherits STATE
- City
- — inherits STATE
ZIP-level market 33467
- Rents YoY
- -0.4%
- Active inventory
- 651
- Price-to-rent
- 7.1×
Monthly cashflow live
- Estimated rent
- $1,940 high interval (Pro) →
- Mortgage (P&I)
- −$865
- Tax from tax record
- −$43 /mo · $519/yr
- Insurance
- −$69
- HOA
- −$189
- Vacancy / Maint / Mgmt
- −$407
- Net cashflow
- $366
Break-even live
UW: 25.0% down · 7.5% · 30yr · 1.5% tax · 5.0% vac · 8.0% maint · 8.0% mgmt
Financing live
Cash to close
- Down payment
- $41,250
- Closing costs
- $4,950
- Reserves months
- —
- Total cash needed
- —
Loan-product check · same deal, 3 products live
Conventional
25% down · 7.5% · 30yr
- Down + closing
- —
- Monthly P&I
- —
- Monthly cashflow
- —
- DSCR
- —
- Eligible?
- —
Personal DTI + credit; lowest rate.
DSCR
20% down · 8.5% · 30yr
- Down + closing
- —
- Monthly P&I
- —
- Monthly cashflow
- —
- DSCR
- —
- Eligible?
- —
No personal income docs; deal must DSCR.
Hard money
10% down · 12.0% · 12mo
- Down + closing
- —
- Monthly P&I
- —
- Monthly cashflow
- —
- DSCR
- —
- Eligible?
- —
Short-term bridge; refi at stabilization.
Rent comps 13 comps
| Address | Beds | Baths | Sqft | Rent | $/sqft | DOM | Units | Dist |
|---|---|---|---|---|---|---|---|---|
| 4120 Tivoli Ct #305 Lake Worth, FL | 1.0 | 1.0 | 704 | $1,750 | $2.49 | 24d | 1 | 0.63mi |
| 4284 Deste Ct #304 Greenacres, FL | 1.0 | 1.0 | 716 | $2,200 | $3.07 | 16d | 1 | 0.71mi |
| 4230 Deste Ct Unit 305 Greenacres, FL | 1.0 | 1.0 | 716 | $1,900 | $2.65 | 5d | 1 | 0.71mi |
| 4236 Deste Ct #108 Greenacres, FL | 1.0 | 1.0 | 716 | $1,800 | $2.51 | 17d | 1 | 0.75mi |
| 7137 Golf Colony Ct #202 Lake Worth, FL | 2.0 | 2.0 | 735 | $2,000 | $2.72 | 3d | 1 | 0.75mi |
| 7137 Golf Colony Ct #202 Lake Worth, FL | 2.0 | 2.0 | 735 | $1,995 | $2.71 | 14d | 1 | 0.75mi |
| 7091 Golf Colony Ct #201 Lake Worth, FL | 2.0 | 2.0 | 735 | $1,850 | $2.52 | 13d | 1 | 0.76mi |
| 7178 Golf Colony Ct #101 Lake Worth, FL | 2.0 | 2.0 | 735 | $1,700 | $2.31 | 24d | 1 | 0.79mi |
| 4254 Deste Ct #305 Greenacres, FL | 1.0 | 1.0 | 716 | $1,500 | $2.09 | 24d | 1 | 0.91mi |
| 4310 Chukka Ln Lake Worth, FL | 1.0–3.0 | 1.0–2.0 | 986 | $2,311 | $2.34 | 1d | 21 | 1.14mi |
| 446 Pine Glen Ln Unit A1 Greenacres, FL | 1.0 | 1.0 | 614 | $1,550 | $2.52 | 14d | 1 | 1.22mi |
| 1600 Island Shores Dr Greenacres, FL | 1.0–2.0 | 1.0–2.0 | 889 | $1,660 | $1.87 | 24d | 2 | 1.46mi |
| 5855 S 37th St Unit 5857 Greenacres, FL | 2.0 | 1.0 | 747 | $1,974 | $2.64 | 7d | 1 | 1.49mi |
HOA detail condo
- Monthly dues
- $189 · $2,268/yr
- Assessments
- None detected in remarks — confirm with the listing agent.
Listing history 20 events
-
2026-06-18days on market $165,000 Active 178 DOM
-
2026-06-17days on market $165,000 Active 177 DOM
-
2026-06-16days on market $165,000 Active 176 DOM
-
2026-06-15days on market $165,000 Active 175 DOM
-
2026-06-13days on market $165,000 Active 173 DOM
-
2026-06-09days on market $165,000 Active 169 DOM
-
2026-06-07days on market $165,000 Active 167 DOM
-
2026-06-04days on market $165,000 Active 164 DOM
-
2026-06-03days on market $165,000 Active 163 DOM
-
2026-06-01days on market $165,000 Active 161 DOM
-
2026-05-31days on market $165,000 Active 160 DOM
-
2026-01-20price $165,000
-
2025-12-22$179,000 Active
-
2019-04-26soldstatus $100
-
2007-09-12soldstatus $53,000
-
2007-09-04soldstatus $53,000 245-char remark
Show marketing remark (245 chars)
OWNER'S PRIDE SHOWS IN THIS IMMACULATELY KEPT UNIT WHICH APPEARS MUCH LARGER THAN TOTAL SQUARE FOOTAGE. TILE THROUGHOUT LIVING AREAS W/ CARPET IN BEDROOM & FLORIDA ROOM. LOWEST PRICED UNIT MAKING THIS UNDOUBTEDLY THE BEST BUY IN THE AREA!!
-
2007-08-20historical 245-char remark
Show marketing remark (245 chars)
OWNER'S PRIDE SHOWS IN THIS IMMACULATELY KEPT UNIT WHICH APPEARS MUCH LARGER THAN TOTAL SQUARE FOOTAGE. TILE THROUGHOUT LIVING AREAS W/ CARPET IN BEDROOM & FLORIDA ROOM. LOWEST PRICED UNIT MAKING THIS UNDOUBTEDLY THE BEST BUY IN THE AREA!!
-
2007-05-29$55,000 245-char remark
Show marketing remark (245 chars)
OWNER'S PRIDE SHOWS IN THIS IMMACULATELY KEPT UNIT WHICH APPEARS MUCH LARGER THAN TOTAL SQUARE FOOTAGE. TILE THROUGHOUT LIVING AREAS W/ CARPET IN BEDROOM & FLORIDA ROOM. LOWEST PRICED UNIT MAKING THIS UNDOUBTEDLY THE BEST BUY IN THE AREA!!
-
1996-09-10soldstatus $24,000
-
1989-05-01soldstatus $27,900
ⓘ Source: listings_history table (triggers on properties + properties_extension) + one-shot
backfill from property_details.listing_events for pre-trigger history.
Tax reassessment forecast FL · Resets to sale price
- Current annual tax
- $519 · $43/mo
- Projected year-2 tax
- $1,370 · $114/mo
- Expected delta
- +$850/yr (+$71/mo · 163.9%)
ⓘ Screening estimate from a state-policy table — verify with the county assessor before closing.
Climate risk First Street
- Flood 1/10 Low FEMA zone X (unshaded) · 0% chance over 30 yrs
- Wildfire 1/10 Low
- Heat 9/10 Extreme 7 d/yr ≥106°F today · 25 d/yr by 30 yrs out
- Wind 10/10 Extreme 99% chance of damaging wind over 30 yrs
- Air quality 2/10 Low 0 unhealthy d/yr today · 2 by 30 yrs out
Nearby sold comps map
Loading sold comps map…
Walkable amenities ~0.75 mi
Loading nearby amenities…
Taxation est. · year 1
- Rental income
- $23,275
- − Mortgage interest
- −$9,243
- − Property taxes
- −$519
- − Insurance
- −$825
- − Repairs & maintenance
- −$1,862
- − Management
- −$1,862
- − HOA
- −$2,268
- − Depreciation
- −$4,800
- Taxable income
- $1,897
- Est. tax owed @ 24.0%
- −$455
- After-tax cash flow
- $3,937/yr
For passive investors: Depreciation is non-cash, so a rental often shows a tax loss while cash-flowing — sheltering income. Rental losses are passive: they offset passive income freely, and up to $25,000/yr can offset ordinary (W-2) income if you actively participate and your MAGI is under $100k (phasing out to $0 by $150k); unused losses carry forward. On sale, claimed depreciation is recaptured at up to 25%, and gains may owe capital-gains tax (a 1031 exchange can defer both). Figures are a year-1 estimate at your 24.0% rate — not tax advice; consult a CPA.
Schools (NCES district)
- District
- Palm Beach
- NCES district ID
- 1201500
- Math proficiency
- 46% ▼ -16.00%
- Reading proficiency
- 53% ▼ -4.00%
- Median HH income
- $53,943
- Composite
- 42.72/100
- National rank
- #3160
- State rank
- #34 of 73 in FL
Livability — Greenacres
- Score
- 69/100
- State rank
- #490
- US rank
- #9008
Category grades
Schools grade is shown separately in the Schools card above.
Census & demographics
- County
- Palm Beach County · 1,438,312 people
- City population
- 65,478
- Metro
- Miami-Fort Lauderdale-Pompano Beach, FL
- Population (ZIP)
- 58,411
- Household income
- $95,739
- Rent vs Own
- Severe rent burden
- 960.0
Population outlook (Palm Beach County) Hauer SSP2
- Today (2025)
- 1,637,487 people
- By 2030
- 1,743,255 · +6.5%
- By 2040
- 1,948,712 · +19.0%
- By 2050
- 2,132,979 · +30.3%
- By 2075
- 2,530,027 · +54.5%
- By 2100
- 2,706,979 · +65.3%
Race, ethnicity, and origin ACS 2023
- Neighborhood character
- Diverse neighborhood (Simpson 0.59)
- Race & ethnicity
- White 59% Hispanic / Latino 22% Two or more races 13% Black 10% Asian 4%
- Hispanic origin (detail)
- Mexican 2% Puerto Rican 4% Cuban 4% Dominican 2%
- Common ancestry
- Romanian 4% Scotch-Irish 3% Hispanic 3%
- Foreign-born
- 24% · Canada, Jamaica, Vietnam
- Languages at home
- 71% English-only · Spanish 17% French/Haitian/Cajun 5% Other Indo-European 3%
Political lean MEDSL · Palm Beach
- 2024 margin
- Toss-up / Even · D 50.0% · R 49.2%
- 2008→2024 swing
- -22.1pp toward R · 2008: 22.9pp · 2024: 0.8pp
- All cycles
- 2024: D+0.8 2020: D+12.8 2016: D+15.3 2012: D+17.0 2008: D+22.9
Not yet ingested
- Civics
- —
Market trends
- HPI YoY
- ▼ -288.94%
- Current HPI
- 343.7738
- Rent YoY
- ▼ -0.40%
- Metro
- Miami-Fort Lauderdale-Pompano Beach, FL
- State GDP YoY
- ▲ 3.28%
- F500 in state
- 36
Industry mix (Fortune 500 HQ in FL)
| Industry | F500 HQs | Revenue |
|---|---|---|
| Industrial Technology | 2 | $29B |
|
||
| Insurance | 2 | $17B |
|
||
| Retail | 1 | $60B |
|
||
| Technology Distribution | 1 | $58B |
|
||
| Homebuilding | 1 | $35B |
|
||
| Technology Manufacturing | 1 | $35B |
|
||
Price history
+491.4% since first listed9 events — show timeline
- 2026-01-20 Price Changed $165,000 HAOR as distributed by MLS GRID
- 2025-12-22 Listed $179,000 HAOR as distributed by MLS GRID
- 2019-04-26 Sold (Public Records) $100 Public Records
- 2007-09-12 Sold (Public Records) $53,000 Public Records
- 2007-09-04 Sold (MLS) $53,000 Beaches MLS
- 2007-08-20 Listing Removed — Beaches MLS
- 2007-05-29 Listed $55,000 Beaches MLS
- 1996-09-10 Sold (Public Records) $24,000 Public Records
- 1989-05-01 Sold (Public Records) $27,900 Public Records
Property tax history
+7.0%/yrLatest (2025): $519 · +3.6% YoY. Source: county tax records.
Cash-flow waterfall
monthlySold comps — $/sqft
last 12 mo · ≤1 miLoading sold comps…