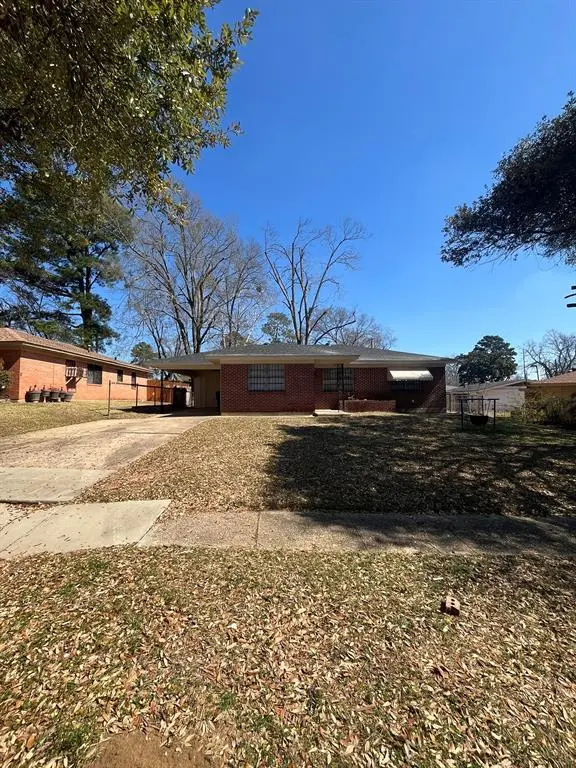
2727 Merrill St · Shreveport, LA
Flood risk 1/10 · Minimal
- FEMA flood zone
- X (unshaded)
- Chance of flooding over 30 yrs
- 0.0%
- Est. flood insurance / yr
- $507 – $1,088
Fire risk 3/10 · Minor
- Est. fire insurance / yr
- $1,269 – $2,357
Heat risk 7/10 · Major
- Hot days now (above 110°F)
- 7 days/yr
- Hot days in 30 yrs
- 22 days/yr
Wind risk 6/10 · Moderate
- Chance of severe wind over 30 yrs
- 66.0%
Air-quality risk 2/10 · Minimal
- Unhealthy air days now
- 1 days/yr
- Unhealthy air days in 30 yrs
- 1 days/yr
Risk factors via First Street. Map © Google.
Why this score? — see what drove the C- grade
The composite is a weighted blend of 9 inputs, each scored 0–100. Each bar is that input's sub-score; the figure is the points it added to the 100-point composite (weight × sub-score).
- Cash flow +20.7/30.0
- DSCR +6.6/10.0
- ARV discount +5.8/15.0
- 1% rule +5.3/10.0
- Appreciation +4.4/10.0
- Livability +3.0/5.0
- Rent growth +2.5/5.0
- Condition / age +2.5/5.0
- Schools +2.2/10.0
$82,000
🖨 Deal sheet 📄 Offer letter ✓ Due diligence
Listing remarks
Completely remodeled in 2026. New roof, water heater, central HVAC, paint, flooring, fixtures, and resurfaced bathroom. Large lot. utility room. and storage. Fenced in backyard. Tenant occupied at $1100 month. Do not disturb tenants. Property is currently under management, that can remain after a sale to make this an easy investment. Owner Agent
Key facts
- Central hvac
- Remodeled
- Water heater
Tags
Property features AI
Finance
- Other: Directions: Jewella to Milton to Merrill; County: Caddo; Country: United States; Geocode confidence: High
- Financial info: Treat as clear loan type; No second mortgage
- HOA & community: No homeowners association
Exterior
- Parking: Covered carport space for 1; Driveway
- Utilities: City water; City sewer; Municipal utility district: No
- Home design: Single family residence; Residential property; Built in 1975; One story
- Construction: Year built: 1975
- Exterior features: Lot less than 0.5 acre (about 0.176 acres); Subdivision: Bonnydell Courts Sub
Interior
- Kitchen: Gas water heater
- Bedrooms: 3 bedrooms; Primary bedroom on main level (11 x 11)
- Bathrooms: 1 full bathroom
- Heating & cooling: Central heating (natural gas); Central electric air conditioning
- Interior features: One-level layout; One living area; One dining area; Other interior features
- Laundry & utility: Gas water heater
Neighborhood map
What this means for you Summary
Snapshot
- This is a 2-bed/1.0-bath single-family listed at $82k.
Deal economics
- At list price, monthly cash flow is $111 ($1k/yr) — positive.
- The deal already cash-flows at list — no discount required.
- Meets the 1% rule at list price ($844 rent vs $82k).
- Recommended offer: $81k (1.5% below list) — sets the bar for market timing.
- Cap rate 7.9% vs local median 5.7% in Shreveport — top-decile yield for the area; either an underpriced asset or a hidden risk that comps aren't pricing in. Stress-test before assuming the spread holds.
Location & tenants
- Location reads 59/100 on livability (#270 in LA) — a working-class tenant base; expect higher turnover. Strengths: cost of living A+, housing A; Watch: schools D+, crime F, amenities F.
- Caddo Parish (urban): math 21% / reading 32% proficiency, ranked #53 of 98 in LA (top 54%) — low school quality limits family demand, transient renter base, plan for 1-2y turnover; 64% free/reduced lunch — lower-income household profile, screen leases tightly.
- Market conditions: 123 active listings in the ZIP; 17 comparable units currently listed for rent nearby; rentals at typical pace (median 21d on market — plan ~3-4 weeks tenant-placement turnaround); 47% of comp listings sitting > 30 days — soft ceiling on asking rent; lower-income renter base — watch delinquency; 221 units permitted in Caddo Parish in 2024 (0 in 5+ unit buildings).
- This rent runs 31% of the median local income ($33k/yr) — at the standard rent-burdened threshold; future hikes will face affordability resistance.
Forward outlook
- Local home prices are declining (-1.2%/yr); year-one equity from $567 of loan paydown is wiped out by about $968 of value loss. Plan a longer hold.
- Caddo County population projected at -15% by 2050 — secular population decline; favor cash flow + early exit over multi-decade hold.
Negotiation context
- It's been on market 20 days — a 2% lower offer ($81k) is reasonable based on typical stale-listing flexibility.
Risks & watch-outs
- Climate carrying-cost: major wind risk, 66% chance of damaging wind over 30y; extreme-heat days projected 7→22/yr by 2055 (HVAC capex compounding) — expect insurance premiums to compound above CPI over the hold.
Questions for the listing agent
- Built in 1975 — when were the roof, HVAC, electrical panel, plumbing, and water heater last replaced?
- Is there a deadline driving the sale (1031 exchange, divorce, estate, relocation)? That informs how much negotiation room exists.
- Schools are D-rated, which usually means shorter tenancies and higher turnover. Who's the typical renter profile here, and what's been the actual vacancy rate?
- Crime grade is F in this area — have there been break-ins, vandalism, or insurance claims at this property in the last 3 years? What carrier currently insures it and at what premium?
- What's the average days-on-market for RENTAL listings here right now (not sales)? A rising rental-DOM trend means longer vacancies and softer asking-rent achievability than the comps imply.
- What's the recent tenant-quality profile in this submarket — average credit score on applications, eviction rate, late-payment / NSF rate, and stable-employment percentage? A property-management company in the area should have these aggregated.
- How much new for-sale + rental construction is in the pipeline within 1–3 miles? Heavy new supply typically softens prices + rents 12–24 months out; constrained supply supports both.
Investment metrics
- 1% rule
- 1.03% ✓
- Cap rate
- 7.91%
- Cash-on-cash
- 5.79%
- DSCR
- 1.26
- GRM
- 8.1
CMA / ARV
- ARV (on-the-fly)
- $79,060
- Comps found
- 12
Show comp detail 12 sales within ~0.75 mi
| Address | Dist | Beds/Ba | Sqft | Sold | Price | $/sf | Match |
|---|---|---|---|---|---|---|---|
| 3501 Hardy St | 0.57mi | 2/1.0 | 1,150 (-2%) | 2mo | $25,000 | $22 | 67 |
| 3801 Ninock St | 0.48mi | 3/1.0 (+1) | 1,105 (-6%) | 1mo | $130,000 | $118 | 61 |
| 3623 Milton St | 0.39mi | 3/1.0 (+1) | 1,164 (-1%) | 18mo | $100,000 | $86 | 60 |
| 3560 Lillian St | 0.60mi | 3/1.0 (+1) | 1,229 (+4%) | 2mo | $40,000 | $33 | 58 |
| 3834 Merwin St | 0.61mi | 3/1.0 (+1) | 1,183 (+0%) | 14mo | $50,000 | $42 | 55 |
| 3708 Glencrest St | 0.66mi | 3/2.0 (+1) | 1,163 (-1%) | 5mo | $98,999 | $85 | 54 |
| 3850 Lisa Ln | 0.72mi | 3/1.5 (+1) | 1,174 (-0%) | 6mo | $60,000 | $51 | 54 |
| 3718 Sumner St | 0.40mi | 3/1.0 (+1) | 1,240 (+5%) | 19mo | $30,000 | $24 | 52 |
| 3802 Woodrow St | 0.51mi | 3/1.0 (+1) | 1,042 (-12%) | 1mo | $130,000 | $125 | 51 |
| 3528 Lakeshore Dr | 0.67mi | 3/1.0 (+1) | 1,270 (+8%) | 2mo | $85,000 | $67 | 49 |
| 3716 W College St | 0.42mi | 3/1.0 (+1) | 1,300 (+10%) | 12mo | $45,000 | $35 | 48 |
| 3759 Elmer Ln | 0.58mi | 3/2.0 (+1) | 1,324 (+12%) | 2mo | $150,000 | $113 | 42 |
Match score weights: distance 35% · size 25% · config 20% · recency 20%. Top-matched comps best support the ARV.
Projected returns pro-forma
-1.18% appreciation · 3.0% rent growth · sell at horizon
- IRR
- 0.2%
- Equity multiple
- 1.01×
- Total profit
- $221
- Equity at exit
- $19,083
- IRR
- 7.1%
- Equity multiple
- 1.67×
- Total profit
- $15,301
- Equity at exit
- $19,439
Cash invested: $22,960 (down + closing). Projections, not guarantees.
Landlord ↔ Tenant lean methodology
- Overall (STATE)
- 90 Strongly Landlord-Friendly
- State Louisiana
- 90 Strongly Landlord-Friendly · R+12
- County
- — inherits STATE
- City
- — inherits STATE
ZIP-level market 71109
- Home prices YoY
- -2.1%
- Active inventory
- 123
- Price-to-rent
- 8.1×
Monthly cashflow live
- Estimated rent
- $844 high interval (Pro) →
- Mortgage (P&I)
- −$430
- Tax from tax record
- −$91 /mo · $1,098/yr
- Insurance
- −$34
- HOA
- −$0
- Vacancy / Maint / Mgmt
- −$177
- Net cashflow
- $111
Break-even live
UW: 25.0% down · 7.5% · 30yr · 1.5% tax · 5.0% vac · 8.0% maint · 8.0% mgmt
Financing live
Cash to close
- Down payment
- $20,500
- Closing costs
- $2,460
- Reserves months
- —
- Total cash needed
- —
Loan-product check · same deal, 3 products live
Conventional
25% down · 7.5% · 30yr
- Down + closing
- —
- Monthly P&I
- —
- Monthly cashflow
- —
- DSCR
- —
- Eligible?
- —
Personal DTI + credit; lowest rate.
DSCR
20% down · 8.5% · 30yr
- Down + closing
- —
- Monthly P&I
- —
- Monthly cashflow
- —
- DSCR
- —
- Eligible?
- —
No personal income docs; deal must DSCR.
Hard money
10% down · 12.0% · 12mo
- Down + closing
- —
- Monthly P&I
- —
- Monthly cashflow
- —
- DSCR
- —
- Eligible?
- —
Short-term bridge; refi at stabilization.
Rent comps 17 comps
| Address | Beds | Baths | Sqft | Rent | $/sqft | DOM | Units | Dist |
|---|---|---|---|---|---|---|---|---|
| 4223 Lakeshore Dr Shreveport, LA | 1.0–3.0 | 1.0–2.0 | 1002 | $798 | $0.80 | 43d | 1 | 0.07mi |
| 3907 Milton St Shreveport, LA | 3.0 | 1.5 | 1275 | $1,100 | $0.86 | 43d | 1 | 0.07mi |
| 3902 Sumner St Shreveport, LA | 2.0 | 1.0 | 900 | $700 | $0.78 | 43d | 1 | 0.29mi |
| 3628 Sumner St Shreveport, LA | 3.0 | 1.0 | 956 | $950 | $0.99 | 44d | 1 | 0.47mi |
| 3515 Stonewall St Shreveport, LA | 2.0 | 1.0 | 1000 | $600 | $0.60 | 13d | 1 | 0.59mi |
| 3420 Darien St Shreveport, LA | 2.0 | 1.0 | 1200 | $665 | $0.55 | 13d | 1 | 0.70mi |
| 3323 Darien St Shreveport, LA | 3.0 | 1.0 | 1200 | $785 | $0.65 | 43d | 1 | 0.75mi |
| 3240 Jackson St Shreveport, LA | 2.0 | 1.0 | 1014 | $700 | $0.69 | 13d | 1 | 0.79mi |
| 3612 Michigan Blvd Shreveport, LA | 2.0 | 1.0 | 1200 | $615 | $0.51 | 13d | 1 | 0.84mi |
| 3022 Lillian St Shreveport, LA | 2.0 | 1.0 | 1115 | $695 | $0.62 | 21d | 1 | 1.07mi |
| 4122 Cherokee St Apt 4 Shreveport, LA | 2.0 | 1.0 | 960 | $850 | $0.89 | 43d | 1 | 1.13mi |
| 4122 Cherokee St Apt 4 Shreveport, LA | 2.0 | 1.0 | 750 | $850 | $1.13 | 21d | 1 | 1.13mi |
| 3101 Harp St Shreveport, LA | 3.0 | 1.0 | 839 | $850 | $1.01 | 21d | 1 | 1.30mi |
| 4021 Theo St Shreveport, LA | 3.0 | 1.0 | 1200 | $800 | $0.67 | 43d | 1 | 1.37mi |
| 2924 DuPont St Shreveport, LA | 2.0 | 1.0 | 768 | $750 | $0.98 | 21d | 1 | 1.39mi |
| 4131 Barbara Ave Shreveport, LA | 3.0 | 1.0 | 1400 | $1,200 | $0.86 | 43d | 1 | 1.42mi |
| 4129 Lamar Ave Shreveport, LA | 2.0 | 1.0 | 1178 | $875 | $0.74 | 21d | 1 | 1.47mi |
Listing history 17 events
-
2026-06-18days on market $82,000 Active 20 DOM
-
2026-06-17days on market $82,000 Active 19 DOM
-
2026-06-16days on market $82,000 Active 18 DOM
-
2026-06-15days on market $82,000 Active 17 DOM
-
2026-06-14days on market $82,000 Active 15 DOM
-
2026-06-13days on market $82,000 Active 14 DOM
-
2026-06-10days on market $82,000 Active 12 DOM
-
2026-06-09days on market $82,000 Active 11 DOM
-
2026-06-08days on market $82,000 Active 10 DOM
-
2026-06-07days on market $82,000 Active 9 DOM
-
2026-06-05days on market $82,000 Active 6 DOM
-
2026-06-03days on market $82,000 Active 5 DOM
-
2026-06-02days on market $82,000 Active 4 DOM
-
2026-06-01days on market $82,000 Active 3 DOM
-
2026-05-31days on market $82,000 Active 2 DOM
-
2026-05-30remarks 348-char remark
-
2026-05-30$82,000 Active 1 DOM
ⓘ Source: listings_history table (triggers on properties + properties_extension) + one-shot
backfill from property_details.listing_events for pre-trigger history.
Tax reassessment forecast LA · Resets to sale price
- Current annual tax
- $1,098 · $91/mo
- Projected year-2 tax
- $1,098 · $91/mo
- Expected delta
- $0/yr ($0/mo · 0.0%)
ⓘ Screening estimate from a state-policy table — verify with the county assessor before closing.
Climate risk First Street
- Flood 1/10 Low FEMA zone X (unshaded) · 0% chance over 30 yrs
- Wildfire 3/10 Moderate
- Heat 7/10 Severe 7 d/yr ≥110°F today · 22 d/yr by 30 yrs out
- Wind 6/10 Major 66% chance of damaging wind over 30 yrs
- Air quality 2/10 Low 1 unhealthy d/yr today · 1 by 30 yrs out
Nearby sold comps map
Loading sold comps map…
Walkable amenities ~0.75 mi
Loading nearby amenities…
Taxation est. · year 1
- Rental income
- $10,124
- − Mortgage interest
- −$4,593
- − Property taxes
- −$1,098
- − Insurance
- −$410
- − Repairs & maintenance
- −$810
- − Management
- −$810
- − Depreciation
- −$2,385
- Taxable income
- $17
- Est. tax owed @ 24.0%
- −$4
- After-tax cash flow
- $1,326/yr
For passive investors: Depreciation is non-cash, so a rental often shows a tax loss while cash-flowing — sheltering income. Rental losses are passive: they offset passive income freely, and up to $25,000/yr can offset ordinary (W-2) income if you actively participate and your MAGI is under $100k (phasing out to $0 by $150k); unused losses carry forward. On sale, claimed depreciation is recaptured at up to 25%, and gains may owe capital-gains tax (a 1031 exchange can defer both). Figures are a year-1 estimate at your 24.0% rate — not tax advice; consult a CPA.
Schools (NCES district)
- District
- Caddo Parish
- NCES district ID
- 2200300
- Math proficiency
- 21% ▼ -33.00%
- Reading proficiency
- 32% ▼ -30.00%
- Median HH income
- $39,227
- Composite
- 22.23/100
- National rank
- #8148
- State rank
- #53 of 98 in LA
Livability — Shreveport
- Score
- 59/100
- State rank
- #270
- US rank
- #19730
Category grades
Schools grade is shown separately in the Schools card above.
Census & demographics
- Census place
- Shreveport, LA
- County
- Caddo Parish · 178,536 people
- City population
- 164,123
- Metro
- Shreveport-Bossier City, LA
- Population (ZIP)
- 17,412
- Household income
- $32,939
- Rent vs Own
- Severe rent burden
- 1265.0
Population outlook (Caddo County) Hauer SSP2
- Today (2025)
- 243,190 people
- By 2030
- 237,231 · -2.5%
- By 2040
- 222,502 · -8.5%
- By 2050
- 206,516 · -15.1%
- By 2075
- 165,706 · -31.9%
- By 2100
- 122,262 · -49.7%
Race, ethnicity, and origin ACS 2023
- Neighborhood character
- Predominantly Black (95%)
- Race & ethnicity
- Black 95% White 4%
- Common ancestry
- Lithuanian 1%
- Foreign-born
- 0%
Political lean MEDSL · Caddo
- 2024 margin
- Toss-up / Even · D 51.6% · R 47.0% · Other 1.4%
- 2008→2024 swing
- +1.6pp toward D · 2008: 3.0pp · 2024: 4.6pp
- All cycles
- 2024: D+4.6 2020: D+6.8 2016: D+4.2 2012: D+4.9 2008: D+3.0
Not yet ingested
- Civics
- —
Market trends
- HPI YoY
- ▼ -1.18%
- Current HPI
- 54.4158
- Rent YoY
- —
- Metro
- Shreveport-Bossier City, LA
- State GDP YoY
- ▲ 3.29%
- F500 in state
- 10
Industry mix (Fortune 500 HQ in LA)
| Industry | F500 HQs | Revenue |
|---|---|---|
| Telecommunications | 2 | $23B |
|
||
| Utilities | 1 | $12B |
|
||
| Wholesale / Distribution | 1 | $5B |
|
||
| Advertising | 1 | $2B |
|
||
Price history
2 events — show timeline
- 2026-05-29 Listed $82,000 NTREIS
- 1983-12-29 Sold (Public Records) — Public Records
Property tax history
+14.2%/yrLatest (2025): $1,098 · +0.4% YoY. Source: county tax records.
Cash-flow waterfall
monthlySold comps — $/sqft
last 12 mo · ≤1 miLoading sold comps…