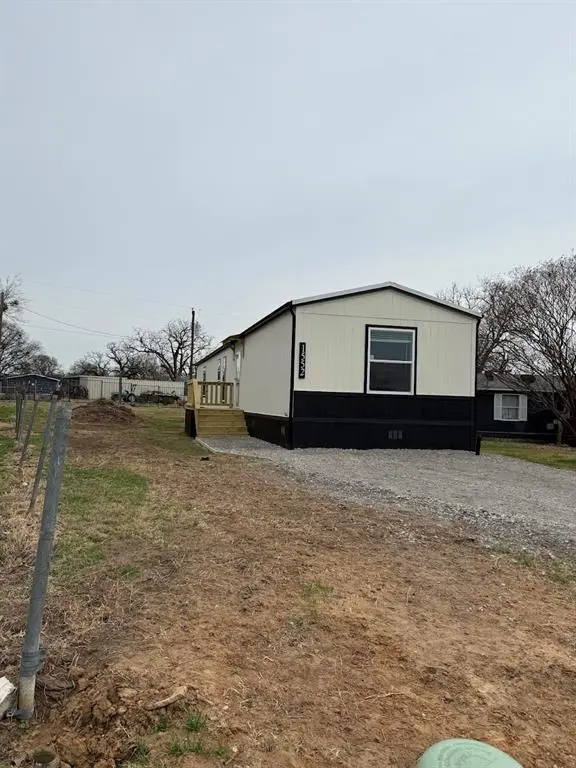
1552 Chaparral Ln · Pelican Bay, TX
Flood risk 1/10 · Minimal
- FEMA flood zone
- X (unshaded)
- Chance of flooding over 30 yrs
- 0.0%
- Est. flood insurance / yr
- $507 – $1,088
Fire risk 4/10 · Minor
- Est. fire insurance / yr
- $1,222 – $2,270
Heat risk 7/10 · Major
- Hot days now (above 110°F)
- 7 days/yr
- Hot days in 30 yrs
- 22 days/yr
Wind risk 4/10 · Minor
- Chance of severe wind over 30 yrs
- 18.0%
Air-quality risk 2/10 · Minimal
- Unhealthy air days now
- 2 days/yr
- Unhealthy air days in 30 yrs
- 2 days/yr
Risk factors via First Street. Map © Google.
Why this score? — see what drove the D+ grade
The composite is a weighted blend of 9 inputs, each scored 0–100. Each bar is that input's sub-score; the figure is the points it added to the 100-point composite (weight × sub-score).
- Cash flow +18.4/30.0
- ARV discount +7.5/15.0
- DSCR +5.8/10.0
- 1% rule +3.7/10.0
- Schools +3.6/10.0
- Rent growth +3.1/5.0
- Livability +3.1/5.0
- Condition / age +2.5/5.0
- Appreciation +0.0/10.0
$185,000
🖨 Deal sheet (PDF) 📄 Offer letter ✓ Due diligence
Listing remarks MLS
Come and Enjoy the Lake and live in a New 2026 Champion Home with two decks. Split bedrooms, luxury vinyl floors throughout the home and large pantry, refrigerator included! Community has a public boat dock where residents can launch for free and a free public beach and park.
Key facts
- Public boat dock
- Free public beach
- Two decks
Tags
Neighborhood map
What this means for you Summary
Snapshot
- This is a 3-bed/2.0-bath land listed at $185k.
Deal economics
- At list price, monthly cash flow is $171 ($2k/yr) — positive.
- The deal already cash-flows at list — no discount required.
- To meet the 1% rule (rent ≥ 1% of price), the offer needs to be $162k (12.6% below list).
- Recommended offer: $162k (12.6% below list) — sets the bar for 1% rule.
Location & tenants
- Location reads 62/100 on livability (#917 in TX) — a middle-class / working-renter tenant base. Strengths: cost of living A+, housing A+, crime A; Watch: health & safety D+, amenities F, commute F.
- Azle ISD (suburban): math 37% / reading 43% proficiency, ranked #351 of 826 in TX (top 42%) — families likely to look elsewhere, expect single-tenant / working-renter base with shorter leases.
- Zoned schools: Liberty El (math 32% / reading 42%, grade F, #1,769 of 4,322 statewide, top 44%, 466 students, 64% FRL); Santo Forte J H (math 28% / reading 41%, grade F, #858 of 1,662 statewide, top 54%, 514 students, 55% FRL); Azle H S (math 41% / reading 50%, grade D-, #634 of 1,632 statewide, top 39%, 2,054 students, 44% FRL).
- Market conditions: Rents rising (+2.3%/yr); 594 active listings in the ZIP; 13 comparable units currently listed for rent nearby; rentals at typical pace (median 23d on market — plan ~3-4 weeks tenant-placement turnaround); solid renter incomes; 18,938 units permitted in Tarrant County in 2024 (8,336 in 5+ unit buildings).
Forward outlook
- Local home prices are declining (-3.0%/yr); year-one equity from $1k of loan paydown is wiped out by about $6k of value loss. Plan a longer hold.
- Tarrant County population projected at +41% by 2050 — long-run rental-demand tailwind backs the buy-and-hold thesis.
Negotiation context
- It's been on market 75 days — a 6% lower offer ($174k) is reasonable based on typical stale-listing flexibility.
Risks & watch-outs
- Climate carrying-cost: extreme-heat days projected 7→22/yr by 2055 (HVAC capex compounding) — expect insurance premiums to compound above CPI over the hold.
Questions for the listing agent
- It's been on market 75 days. Have you received any prior offers? Is the seller open to a 13% concession, seller financing, or rate buy-down credit?
- Why hasn't it sold? Are there any deal-killer items the seller is aware of (foundation, flood, title, zoning, code violations)?
- Is there a deadline driving the sale (1031 exchange, divorce, estate, relocation)? That informs how much negotiation room exists.
- Schools are F-rated, which usually means shorter tenancies and higher turnover. Who's the typical renter profile here, and what's been the actual vacancy rate?
- The area grade is low — what's the realistic commute time and amenity access for the typical tenant pool here? Any planned neighborhood developments (good or bad) we should know about?
- What's the average days-on-market for RENTAL listings here right now (not sales)? A rising rental-DOM trend means longer vacancies and softer asking-rent achievability than the comps imply.
- What's the recent tenant-quality profile in this submarket — average credit score on applications, eviction rate, late-payment / NSF rate, and stable-employment percentage? A property-management company in the area should have these aggregated.
- How much new for-sale + rental construction is in the pipeline within 1–3 miles? Heavy new supply typically softens prices + rents 12–24 months out; constrained supply supports both.
Investment metrics
- 1% rule
- 0.87% ✗
- Cap rate
- 7.40%
- Cash-on-cash
- 3.97%
- DSCR
- 1.18
- GRM
- 9.5
CMA / ARV
- ARV (median comp)
- $60,000
- List price
- $185,000
- Delta
- 208.33%
- Verdict
- OVERPRICED
- Comps
- 12 within 1.0 mi
Projected returns pro-forma
-3.0% appreciation · 2.31% rent growth · sell at horizon
- IRR
- -10.8%
- Equity multiple
- 0.61×
- Total profit
- $-20,258
- Equity at exit
- $27,584
- IRR
- -2.5%
- Equity multiple
- 0.84×
- Total profit
- $-8,427
- Equity at exit
- $15,995
Cash invested: $51,800 (down + closing). Projections, not guarantees.
Landlord ↔ Tenant lean methodology
- Overall (STATE)
- 87 Strongly Landlord-Friendly
- State Texas
- 87 Strongly Landlord-Friendly · R+5
- County
- — inherits STATE
- City
- — inherits STATE
ZIP-level market 76020
- Home prices YoY
- -20.6%
- Rents YoY
- 2.3%
- Active inventory
- 594
- Price-to-rent
- 9.5×
Monthly cashflow live
- Estimated rent
- $1,616 high interval (Pro) →
- Mortgage (P&I)
- −$970
- Tax from tax record
- −$58 /mo · $699/yr
- Insurance
- −$77
- HOA
- −$0
- Vacancy / Maint / Mgmt
- −$339
- Net cashflow
- $171
Break-even live
Sensitivity live
| Price | -10% $276 | -5% $224 | +0% $171 | +5% $119 | +10% $67 |
|---|---|---|---|---|---|
| Rent | -10% $44 | -5% $108 | +0% $171 | +5% $235 | +10% $299 |
| Rate | -1.0pp $265 | -0.5pp $218 | base $171 | +0.5pp $123 | +1.0pp $75 |
UW: 25.0% down · 7.5% · 30yr · 1.5% tax · 5.0% vac · 8.0% maint · 8.0% mgmt
Financing live
Cash to close
- Down payment
- $46,250
- Closing costs
- $5,550
- Reserves months
- —
- Total cash needed
- —
Loan-product check · same deal, 3 products live
Conventional
25% down · 7.5% · 30yr
- Down + closing
- —
- Monthly P&I
- —
- Monthly cashflow
- —
- DSCR
- —
- Eligible?
- —
Personal DTI + credit; lowest rate.
DSCR
20% down · 8.5% · 30yr
- Down + closing
- —
- Monthly P&I
- —
- Monthly cashflow
- —
- DSCR
- —
- Eligible?
- —
No personal income docs; deal must DSCR.
Hard money
10% down · 12.0% · 12mo
- Down + closing
- —
- Monthly P&I
- —
- Monthly cashflow
- —
- DSCR
- —
- Eligible?
- —
Short-term bridge; refi at stabilization.
Rent comps 13 comps
| Address | Beds | Baths | Sqft | Rent | $/sqft | DOM | Units | Dist |
|---|---|---|---|---|---|---|---|---|
| 1620 Mockingbird Ln Azle, TX | 3.0 | 2.0 | 1090 | $1,499 | $1.38 | 22d | 1 | 0.18mi |
| 1329 Fox Hollow Ct Azle, TX | 2.0 | 1.0 | 924 | $900 | $0.97 | 8d | 1 | 0.42mi |
| 1844 Sheila Dr Azle, TX | 3.0 | 2.0 | 1319 | $1,645 | $1.25 | 0d | 1 | 0.83mi |
| 1920 Reef Ct Azle, TX | 3.0 | 2.0 | 1090 | $1,449 | $1.33 | 45d | 1 | 0.96mi |
| 700 Stribling Cir Azle, TX | 3.0 | 2.0 | 1311 | $1,659 | $1.27 | 18d | 1 | 1.14mi |
| 11124 Liberty School Rd Unit 24B Azle, TX | 2.0 | 2.0 | 700 | $999 | $1.43 | 24d | 1 | 1.18mi |
| 11128 Liberty School Rd Unit 28A Azle, TX | 2.0 | 2.0 | 700 | $1,050 | $1.50 | 26d | 1 | 1.20mi |
| 1324 White Sand Dr Azle, TX | 3.0 | 2.0 | 1149 | $1,650 | $1.44 | 7d | 1 | 1.20mi |
| 1300 White Sand Dr Unit 1304 Azle, TX | 3.0 | 2.0 | 1149 | $1,695 | $1.48 | 45d | 1 | 1.21mi |
| 1408 Yachtclub Dr Azle, TX | 3.0 | 2.0 | 1302 | $2,000 | $1.54 | 14d | 1 | 1.23mi |
| 1304 White Sand Dr Azle, TX | 3.0 | 2.0 | 1149 | $1,695 | $1.48 | 45d | 1 | 1.25mi |
| 424 Lochridge Dr Unit 424 Azle, TX | 3.0 | 2.0 | 1182 | $1,575 | $1.33 | 14d | 1 | 1.36mi |
| 1002 N Stewart St Azle, TX | 3.0 | 1.0 | 1119 | $1,400 | $1.25 | 45d | 1 | 1.45mi |
Listing history 3 events
-
2026-05-02status Pending 276-char remark
Show marketing remark (276 chars)
Come and Enjoy the Lake and live in a New 2026 Champion Home with two decks. Split bedrooms, luxury vinyl floors throughout the home and large pantry, refrigerator included! Community has a public boat dock where residents can launch for free and a free public beach and park.
-
2026-02-16$185,000 Active 276-char remark
Show marketing remark (276 chars)
Come and Enjoy the Lake and live in a New 2026 Champion Home with two decks. Split bedrooms, luxury vinyl floors throughout the home and large pantry, refrigerator included! Community has a public boat dock where residents can launch for free and a free public beach and park.
-
1993-01-05soldstatus
ⓘ Source: listings_history table (triggers on properties + properties_extension) + one-shot
backfill from property_details.listing_events for pre-trigger history.
Tax reassessment forecast TX · Resets to sale price
- Current annual tax
- $699 · $58/mo
- Projected year-2 tax
- $3,386 · $282/mo
- Expected delta
- +$2,687/yr (+$224/mo · 384.6%)
ⓘ Screening estimate from a state-policy table — verify with the county assessor before closing.
Climate risk First Street
- Flood 1/10 Low FEMA zone X (unshaded) · 0% chance over 30 yrs
- Wildfire 4/10 Moderate
- Heat 7/10 Severe 7 d/yr ≥110°F today · 22 d/yr by 30 yrs out
- Wind 4/10 Moderate 18% chance of damaging wind over 30 yrs
- Air quality 2/10 Low 2 unhealthy d/yr today · 2 by 30 yrs out
Nearby sold comps map
Loading sold comps map…
Walkable amenities ~0.75 mi
Loading nearby amenities…
Taxation est. · year 1
- Rental income
- $19,395
- − Mortgage interest
- −$10,363
- − Property taxes
- −$699
- − Insurance
- −$925
- − Repairs & maintenance
- −$1,552
- − Management
- −$1,552
- − Depreciation
- −$5,382
- Taxable loss
- −$1,076
- Est. tax savings @ 24.0%
- +$258
- After-tax cash flow
- $2,315/yr
For passive investors: Depreciation is non-cash, so a rental often shows a tax loss while cash-flowing — sheltering income. Rental losses are passive: they offset passive income freely, and up to $25,000/yr can offset ordinary (W-2) income if you actively participate and your MAGI is under $100k (phasing out to $0 by $150k); unused losses carry forward. On sale, claimed depreciation is recaptured at up to 25%, and gains may owe capital-gains tax (a 1031 exchange can defer both). Figures are a year-1 estimate at your 24.0% rate — not tax advice; consult a CPA.
Schools (NCES district)
- District
- Azle ISD
- NCES district ID
- 4809200
- Math proficiency
- 37% ▼ -11.00%
- Reading proficiency
- 43% ▼ -5.00%
- Median HH income
- $61,473
- Composite
- 35.57/100
- National rank
- #4900
- State rank
- #351 of 826 in TX
Livability — Pelican Bay
- Score
- 62/100
- State rank
- #917
- US rank
- #16376
Category grades
Schools grade is shown separately in the Schools card above.
Census & demographics
- Census place
- Pelican Bay, TX
- County
- Parker County · 144,797 people
- Metro
- Dallas-Fort Worth-Arlington, TX
- Population (ZIP)
- 34,602
- Household income
- $87,298
- Rent vs Own
- Severe rent burden
- 433.0
Population outlook (Tarrant County) Hauer SSP2
- Today (2025)
- 2,380,417 people
- By 2030
- 2,578,900 · +8.3%
- By 2040
- 2,974,995 · +25.0%
- By 2050
- 3,350,489 · +40.8%
- By 2075
- 4,216,909 · +77.2%
- By 2100
- 4,741,527 · +99.2%
Race, ethnicity, and origin ACS 2023
- Neighborhood character
- Predominantly White (78%)
- Race & ethnicity
- White 78% Hispanic / Latino 18% Two or more races 9% Black 1%
- Hispanic origin (detail)
- Mexican 15%
- Common ancestry
- Slovak 2% Italian 1% Portuguese 1%
- Foreign-born
- 5% · Canada
- Languages at home
- 89% English-only · Spanish 11%
Political lean MEDSL · Tarrant
- 2024 margin
- Lean R (+5.1) · D 46.7% · R 51.9% · Other 1.4%
- 2008→2024 swing
- +6.6pp toward D · 2008: -11.7pp · 2024: -5.1pp
- All cycles
- 2024: R+5.1 2020: D+0.2 2016: R+8.7 2012: R+15.7 2008: R+11.7
Not yet ingested
- Civics
- —
Market trends
- HPI YoY
- ▼ -74.72%
- Current HPI
- 287.155
- Rent YoY
- ▲ 2.31%
- Metro
- Dallas-Fort Worth-Arlington, TX
- State GDP YoY
- ▲ 3.95%
- F500 in state
- 110
Industry mix (Fortune 500 HQ in TX)
| Industry | F500 HQs | Revenue |
|---|---|---|
| Energy | 16 | $1,198B |
|
||
| Technology | 5 | $198B |
|
||
| Engineering / Construction | 4 | $72B |
|
||
| Energy Services | 3 | $60B |
|
||
| Utilities | 3 | $41B |
|
||
| Healthcare | 2 | $330B |
|
||
Price history
3 events — show timeline
- 2026-05-02 Pending — NTREIS
- 2026-02-16 Listed $185,000 NTREIS
- 1993-01-05 Sold (Public Records) — Public Records
Property tax history
+9.0%/yrLatest (2025): $699 · +1.3% YoY. Source: county tax records.
Cash-flow waterfall
monthlySold comps — $/sqft
last 12 mo · ≤1 miLoading sold comps…