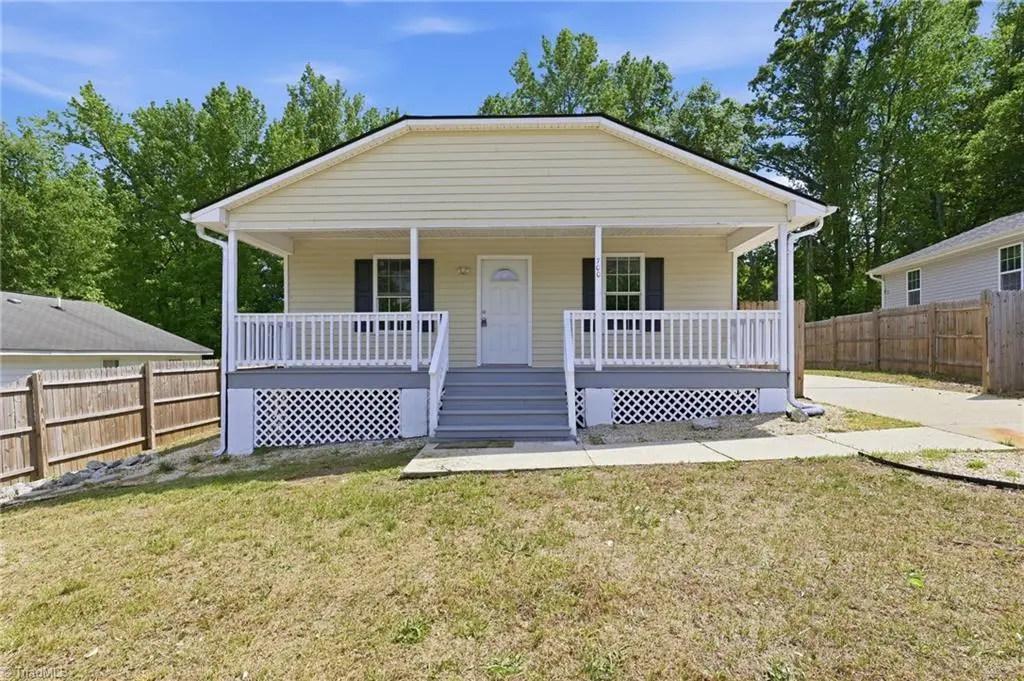
700 Sharing Ter · Greensboro, NC
Flood risk 1/10 · Minimal
- FEMA flood zone
- X (unshaded)
- Chance of flooding over 30 yrs
- 0.0%
- Est. flood insurance / yr
- $507 – $1,088
Fire risk 1/10 · Minimal
- Est. fire insurance / yr
- $906 – $1,684
Heat risk 5/10 · Moderate
- Hot days now (above 103°F)
- 7 days/yr
- Hot days in 30 yrs
- 18 days/yr
Wind risk 4/10 · Minor
- Chance of severe wind over 30 yrs
- 15.0%
Air-quality risk 2/10 · Minimal
- Unhealthy air days now
- 1 days/yr
- Unhealthy air days in 30 yrs
- 2 days/yr
Risk factors via First Street. Map © Google.
Why this score? — see what drove the D grade
The composite is a weighted blend of 9 inputs, each scored 0–100. Each bar is that input's sub-score; the figure is the points it added to the 100-point composite (weight × sub-score).
- Cash flow +12.5/30.0
- ARV discount +11.1/15.0
- Livability +4.0/5.0
- DSCR +3.7/10.0
- Schools +3.6/10.0
- Rent growth +3.5/5.0
- 1% rule +2.5/10.0
- Condition / age +2.5/5.0
- Appreciation +0.0/10.0
$200,000
🖨 Deal sheet 📄 Offer letter ✓ Due diligence
Listing remarks
You've found your next home, at a price you can afford!! 1-level living, in an easy-to-maintain package. Wide-open living area, perfect for family gatherings. Enjoy your morning cup of coffee or evening beverage from the wide front porch or backyard. New stove and dishwasher included. Minutes from downtown Greensboro, I-40 and Hwy 70. Sharing Terrace is move-in ready to make your homeownership dreams a reality!
Key facts
- New stove
- Wide front porch
- Backyard
Tags
Property features AI
Finance
- Other: Subdivision: Poplar Ridge
- HOA & community: No homeowners association (listed association: Greensboro)
Exterior
- Parking: Driveway (no garage)
- Security: Smoke detectors; Deadbolt locks
- Utilities: Public water; Public sewer; Electric water heater; Electric service
- Home design: Residential stick-built house; One story; Built in 1997
- Construction: Vinyl siding; Wood siding; Crawl space foundation
- Exterior features: Fenced yard; City lot; Public maintained road
Interior
- Kitchen: Dishwasher; Free-standing range; Range hood; Exhaust fan; Pantry
- Bedrooms: Main level bedrooms (dimensions listed in room details)
- Flooring: Vinyl flooring
- Bathrooms: 2 full bathrooms
- Heating & cooling: Central air conditioning; Forced air heat; Heat pump (electric)
- Interior features: Ceiling fans; Deadbolt locks; Pantry; Primary bedroom on main level; Attic access only
- Laundry & utility: Washer hookup; Dryer connection; Laundry on main level; Electric water heater
Neighborhood map
What this means for you Summary
Snapshot
- This is a 3-bed/2.0-bath single-family listed at $200k.
Deal economics
- At list price, monthly cash flow is $-30 ($-358/yr) — negative.
- To cash-flow at today's rent, offer at most $195k (2.6% below list).
- To meet the 1% rule (rent ≥ 1% of price), the offer needs to be $149k (25.3% below list).
- Recommended offer: $149k (25.3% below list) — sets the bar for 1% rule.
- Cap rate 6.1% vs local median 3.8% in Greensboro — top-decile yield for the area; either an underpriced asset or a hidden risk that comps aren't pricing in. Stress-test before assuming the spread holds.
Location & tenants
- Location reads 81/100 on livability (#12 in NC, #1,335 nationally) — a professional / high-income tenant draw. Strengths: amenities A+, commute A+, cost of living A+; Watch: employment D, crime F.
- Guilford County Schools (urban): math 39% / reading 45% proficiency, ranked #99 of 178 in NC (top 56%) — families likely to look elsewhere, expect single-tenant / working-renter base with shorter leases.
- Zoned schools: Waldo C Falkener Sr Elementary (math 14% / reading 15%, grade F, #1,331 of 1,410 statewide, top 96%, 511 students, 99% FRL); Otis L Hairston Sr Middle (math 13% / reading 22%, grade F, #445 of 475 statewide, top 94%, 631 students, 100% FRL); James B Dudley High (math 34% / reading 40%, grade F, #414 of 535 statewide, top 79%, 1,491 students, 100% FRL) — zoned schools average 100% FRL vs 52% district-wide (47 pts higher); higher-poverty schools than district average — tighter screening recommended.
- Zoned-school proficiency averages 23% at this address vs 42% district-wide (-19 pts) — the specific schools serving this property underperform the Guilford County Schools average; the district grade overstates school quality for this exact location.
- Market conditions: Rents rising (+3.8%/yr); 381 active listings in the ZIP; 18 comparable units currently listed for rent nearby; rentals at typical pace (median 23d on market — plan ~3-4 weeks tenant-placement turnaround); 3,843 units permitted in Guilford County in 2024 (2,397 in 5+ unit buildings).
- This rent runs 38% of the median local income ($47k/yr) — at the standard rent-burdened threshold; future hikes will face affordability resistance.
Forward outlook
- Local home prices are declining (-3.0%/yr); year-one equity from $1k of loan paydown is wiped out by about $6k of value loss. Plan a longer hold.
- Guilford County population projected at +26% by 2050 — long-run rental-demand tailwind backs the buy-and-hold thesis.
Negotiation context
- It's been on market 25 days — a 2% lower offer ($197k) is reasonable based on typical stale-listing flexibility.
- Current owner paid $150k; 33% above their basis — modest negotiation headroom, anchor on the comps not their cost.
Risks & watch-outs
- Climate carrying-cost: extreme-heat days projected 7→18/yr by 2055 (HVAC capex compounding) — expect insurance premiums to compound above CPI over the hold.
Questions for the listing agent
- What do current leases actually rent for vs. the listed asking? Can we see a recent rent roll and the last 12 months of T-12 income?
- Is there a deadline driving the sale (1031 exchange, divorce, estate, relocation)? That informs how much negotiation room exists.
- Crime grade is F in this area — have there been break-ins, vandalism, or insurance claims at this property in the last 3 years? What carrier currently insures it and at what premium?
- The area grade is low — what's the realistic commute time and amenity access for the typical tenant pool here? Any planned neighborhood developments (good or bad) we should know about?
- What's the average days-on-market for RENTAL listings here right now (not sales)? A rising rental-DOM trend means longer vacancies and softer asking-rent achievability than the comps imply.
- What's the recent tenant-quality profile in this submarket — average credit score on applications, eviction rate, late-payment / NSF rate, and stable-employment percentage? A property-management company in the area should have these aggregated.
- How much new for-sale + rental construction is in the pipeline within 1–3 miles? Heavy new supply typically softens prices + rents 12–24 months out; constrained supply supports both.
Investment metrics
- 1% rule
- 0.75% ✗
- Cap rate
- 6.11%
- Cash-on-cash
- -0.64%
- DSCR
- 0.97
- GRM
- 11.2
CMA / ARV
- ARV (on-the-fly)
- $217,280
- Comps found
- 8
Show comp detail 8 sales within ~0.75 mi
| Address | Dist | Beds/Ba | Sqft | Sold | Price | $/sf | Match |
|---|---|---|---|---|---|---|---|
| 625 Shirley Ln | 0.40mi | 3/2.0 | 1,104 (-1%) | 12mo | $190,500 | $173 | 69 |
| 4017 Mountainridge Dr | 0.33mi | 3/2.0 | 1,040 (-7%) | 8mo | $210,000 | $202 | 66 |
| 629 Chavis Dr | 0.46mi | 3/2.0 | 1,160 (+4%) | 14mo | $225,000 | $194 | 61 |
| 3938 Eastland Ave | 0.32mi | 3/1.5 | 1,007 (-10%) | 9mo | $165,000 | $164 | 58 |
| 3912 Fairall Dr | 0.53mi | 3/2.0 | 1,287 (+15%) | 3mo | $255,000 | $198 | 48 |
| 715 Chavis Dr | 0.51mi | 3/2.0 | 1,232 (+10%) | 19mo | $250,000 | $203 | 44 |
| 123 Ward Rd | 0.63mi | 2/1.0 (-1) | 1,288 (+15%) | 3mo | $200,000 | $155 | 34 |
| 3807 Holts Chapel Rd | 0.63mi | 2/1.0 (-1) | 973 (-13%) | 23mo | $159,999 | $164 | 21 |
Match score weights: distance 35% · size 25% · config 20% · recency 20%. Top-matched comps best support the ARV.
Projected returns pro-forma
-3.0% appreciation · 3.83% rent growth · sell at horizon
- IRR
- -16.6%
- Equity multiple
- 0.41×
- Total profit
- $-33,136
- Equity at exit
- $29,821
- IRR
- -7.2%
- Equity multiple
- 0.53×
- Total profit
- $-26,392
- Equity at exit
- $17,292
Cash invested: $56,000 (down + closing). Projections, not guarantees.
Landlord ↔ Tenant lean methodology
- Overall (STATE)
- 85 Strongly Landlord-Friendly
- State North Carolina
- 85 Strongly Landlord-Friendly · R+3
- County
- — inherits STATE
- City
- — inherits STATE
ZIP-level market 27405
- Home prices YoY
- -20.6%
- Rents YoY
- 3.8%
- Active inventory
- 381
- Price-to-rent
- 11.2×
Monthly cashflow live
- Estimated rent
- $1,494 high interval (Pro) →
- Mortgage (P&I)
- −$1,049
- Tax from tax record
- −$78 /mo · $933/yr
- Insurance
- −$83
- HOA
- −$0
- Vacancy / Maint / Mgmt
- −$314
- Net cashflow
- $-30
Break-even live
UW: 25.0% down · 7.5% · 30yr · 1.5% tax · 5.0% vac · 8.0% maint · 8.0% mgmt
Financing live
Cash to close
- Down payment
- $50,000
- Closing costs
- $6,000
- Reserves months
- —
- Total cash needed
- —
Loan-product check · same deal, 3 products live
Conventional
25% down · 7.5% · 30yr
- Down + closing
- —
- Monthly P&I
- —
- Monthly cashflow
- —
- DSCR
- —
- Eligible?
- —
Personal DTI + credit; lowest rate.
DSCR
20% down · 8.5% · 30yr
- Down + closing
- —
- Monthly P&I
- —
- Monthly cashflow
- —
- DSCR
- —
- Eligible?
- —
No personal income docs; deal must DSCR.
Hard money
10% down · 12.0% · 12mo
- Down + closing
- —
- Monthly P&I
- —
- Monthly cashflow
- —
- DSCR
- —
- Eligible?
- —
Short-term bridge; refi at stabilization.
Rent comps 18 comps
| Address | Beds | Baths | Sqft | Rent | $/sqft | DOM | Units | Dist |
|---|---|---|---|---|---|---|---|---|
| 4020 Mountainridge Dr Greensboro, NC | 4.0 | 2.5 | 1500 | $1,825 | $1.22 | 23d | 1 | 0.32mi |
| 4014 Mountainridge Dr Greensboro, NC | 4.0 | 2.5 | 1445 | $1,795 | $1.24 | 19d | 1 | 0.34mi |
| 3900 Hahns Ln Greensboro, NC | 2.0 | 1.0 | 880 | $955 | $1.09 | 14d | 8 | 0.59mi |
| 3817 Central Ave Greensboro, NC | 4.0 | 2.0 | 1200 | $1,740 | $1.45 | 14d | 1 | 0.66mi |
| 311 Guerrant St Greensboro, NC | 3.0 | 1.0 | 1025 | $1,295 | $1.26 | 23d | 1 | 0.78mi |
| 306 Murraylane Rd Greensboro, NC | 3.0 | 2.0 | 1330 | $1,815 | $1.36 | 14d | 1 | 0.80mi |
| 909 Beaumont Ave Greensboro, NC | 4.0 | 2.0 | 1192 | $1,625 | $1.36 | 23d | 1 | 0.92mi |
| 4216 Parker St Unit C Greensboro, NC | 2.0 | 1.0 | 800 | $825 | $1.03 | 21d | 1 | 1.02mi |
| 210 Woodnell St Unit G Greensboro, NC | 2.0 | 1.0 | 750 | $975 | $1.30 | 23d | 1 | 1.12mi |
| 129 Aunt Mary Ave Unit A Greensboro, NC | 2.0 | 1.0 | 800 | $950 | $1.19 | 23d | 1 | 1.13mi |
| 209 Woodnell St Unit H Greensboro, NC | 2.0 | 1.0 | 750 | $975 | $1.30 | 19d | 1 | 1.13mi |
| 522 Banner Ave Greensboro, NC | 3.0 | 2.0 | 822 | $1,600 | $1.95 | 23d | 1 | 1.17mi |
| 600 Banner Ave Unit 614-B Greensboro, NC | 2.0 | 1.5 | 850 | $850 | $1.00 | 23d | 1 | 1.18mi |
| 309 Holt Ave Greensboro, NC | 2.0 | 1.0 | 1000 | $1,175 | $1.18 | 23d | 1 | 1.25mi |
| 810 Elwell Ave Greensboro, NC | 3.0 | 2.0 | 1280 | $1,500 | $1.17 | 14d | 1 | 1.29mi |
| 4214 Kildare Dr Greensboro, NC | 3.0 | 1.5 | 1329 | $1,450 | $1.09 | 23d | 1 | 1.29mi |
| 703 Sykes Ave Greensboro, NC | 2.0 | 1.0 | 923 | $1,295 | $1.40 | 23d | 1 | 1.34mi |
| 610 Holt Ave Greensboro, NC | 2.0 | 1.0 | 1092 | $1,300 | $1.19 | 14d | 1 | 1.41mi |
Listing history 9 events
-
2026-06-03status $200,000 Pending 25 DOM
-
2026-06-02days on market $200,000 Due Diligence Period 25 DOM
-
2026-06-01days on market $200,000 Due Diligence Period 24 DOM
-
2026-05-31days on market $200,000 Due Diligence Period 23 DOM
-
2026-05-31days on market $200,000 Due Diligence Period 22 DOM
-
2026-05-12historical Due Diligence Period
-
2026-05-08$200,000 Active
-
2024-09-30soldstatus $150,000
-
1997-10-01soldstatus $43,000
ⓘ Source: listings_history table (triggers on properties + properties_extension) + one-shot
backfill from property_details.listing_events for pre-trigger history.
Tax reassessment forecast NC · Resets to sale price
- Current annual tax
- $933 · $78/mo
- Projected year-2 tax
- $1,640 · $137/mo
- Expected delta
- +$707/yr (+$59/mo · 75.8%)
ⓘ Screening estimate from a state-policy table — verify with the county assessor before closing.
Climate risk First Street
- Flood 1/10 Low FEMA zone X (unshaded) · 0% chance over 30 yrs
- Wildfire 1/10 Low
- Heat 5/10 Major 7 d/yr ≥103°F today · 18 d/yr by 30 yrs out
- Wind 4/10 Moderate 15% chance of damaging wind over 30 yrs
- Air quality 2/10 Low 1 unhealthy d/yr today · 2 by 30 yrs out
Nearby sold comps map
Loading sold comps map…
Walkable amenities ~0.75 mi
Loading nearby amenities…
Taxation est. · year 1
- Rental income
- $17,925
- − Mortgage interest
- −$11,203
- − Property taxes
- −$933
- − Insurance
- −$1,000
- − Repairs & maintenance
- −$1,434
- − Management
- −$1,434
- − Depreciation
- −$5,818
- Taxable loss
- −$3,897
- Est. tax savings @ 24.0%
- +$935
- After-tax cash flow
- $577/yr
For passive investors: Depreciation is non-cash, so a rental often shows a tax loss while cash-flowing — sheltering income. Rental losses are passive: they offset passive income freely, and up to $25,000/yr can offset ordinary (W-2) income if you actively participate and your MAGI is under $100k (phasing out to $0 by $150k); unused losses carry forward. On sale, claimed depreciation is recaptured at up to 25%, and gains may owe capital-gains tax (a 1031 exchange can defer both). Figures are a year-1 estimate at your 24.0% rate — not tax advice; consult a CPA.
Schools (NCES district)
- District
- Guilford County Schools
- NCES district ID
- 3701920
- Math proficiency
- 39% ▲ 1.00%
- Reading proficiency
- 45% ▲ 1.00%
- Median HH income
- $46,315
- Composite
- 35.78/100
- National rank
- #4842
- State rank
- #99 of 178 in NC
Livability — Greensboro
- Score
- 81/100
- State rank
- #12
- US rank
- #1335
Category grades
Schools grade is shown separately in the Schools card above.
Census & demographics
- Census place
- Greensboro, NC
- County
- Guilford County · 487,190 people
- City population
- 329,421
- Metro
- Greensboro-High Point, NC
- Population (ZIP)
- 54,303
- Household income
- $47,431
- Rent vs Own
- Severe rent burden
- 2517.0
Population outlook (Guilford County) Hauer SSP2
- Today (2025)
- 584,596 people
- By 2030
- 616,851 · +5.5%
- By 2040
- 678,451 · +16.1%
- By 2050
- 734,788 · +25.7%
- By 2075
- 862,985 · +47.6%
- By 2100
- 948,704 · +62.3%
Race, ethnicity, and origin ACS 2023
- Neighborhood character
- Diverse neighborhood (Simpson 0.62)
- Race & ethnicity
- Black 57% White 20% Hispanic / Latino 14% Two or more races 7% Asian 4%
- Hispanic origin (detail)
- Mexican 9% Puerto Rican 2%
- Common ancestry
- Romanian 1% Ukrainian 1% Italian 1%
- Foreign-born
- 15% · Canada, Vietnam, China
- Languages at home
- 79% English-only · Spanish 11% Other Asian/Pacific 2% Other Indo-European 1%
Political lean MEDSL · Guilford
- 2024 margin
- Strong D (+21.8) · D 60.2% · R 38.4% · Other 1.4%
- 2008→2024 swing
- +3.5pp toward D · 2008: 18.4pp · 2024: 21.8pp
- All cycles
- 2024: D+21.8 2020: D+23.1 2016: D+20.0 2012: D+16.5 2008: D+18.4
Not yet ingested
- Civics
- —
Market trends
- HPI YoY
- ▼ -63.02%
- Current HPI
- 243.1261
- Rent YoY
- ▲ 3.83%
- Metro
- Greensboro-High Point, NC
- State GDP YoY
- ▲ 3.28%
- F500 in state
- 26
Industry mix (Fortune 500 HQ in NC)
| Industry | F500 HQs | Revenue |
|---|---|---|
| Financial Services | 2 | $213B |
|
||
| Retail | 2 | $95B |
|
||
| Industrial Conglomerate | 1 | $38B |
|
||
| Metals / Steel | 1 | $35B |
|
||
| Utilities | 1 | $30B |
|
||
| Industrial Machinery | 1 | $19B |
|
||
Price history
+365.1% since first listed4 events — show timeline
- 2026-05-12 Contingent — Triad MLS
- 2026-05-08 Listed $200,000 Triad MLS
- 2024-09-30 Sold (Public Records) $150,000 Public Records
- 1997-10-01 Sold (Public Records) $43,000 Public Records
Property tax history
+5.5%/yrLatest (2024): $933 · +5302.4% YoY. Source: county tax records.
Cash-flow waterfall
monthlySold comps — $/sqft
last 12 mo · ≤1 miLoading sold comps…