 🏗️ New Construction
Saratoga Plan · South Lockport, NY
Flood risk 6/10 · Moderate
- FEMA flood zone
- X (unshaded)
- Chance of flooding over 30 yrs
- 0.72%
- Est. flood insurance / yr
- $507 – $1,088
Fire risk 3/10 · Minor
- Est. fire insurance / yr
- $691 – $1,283
Heat risk 2/10 · Minimal
- Hot days now (above 94°F)
- 7 days/yr
- Hot days in 30 yrs
- 15 days/yr
Wind risk 1/10 · Minimal
- Chance of severe wind over 30 yrs
- —
Air-quality risk 2/10 · Minimal
- Unhealthy air days now
- 2 days/yr
- Unhealthy air days in 30 yrs
- 2 days/yr
Risk factors via First Street. Map © Google.
Why this score? — see what drove the B grade
The composite is a weighted blend of 9 inputs, each scored 0–100. Each bar is that input's sub-score; the figure is the points it added to the 100-point composite (weight × sub-score).
- Cash flow +30.0/30.0
- 1% rule +10.0/10.0
- DSCR +10.0/10.0
- ARV discount +7.5/15.0
- Schools +3.9/10.0
- Condition / age +3.8/5.0
- Rent growth +3.4/5.0
- Livability +3.3/5.0
- Appreciation +0.0/10.0
$122,000
🖨 Deal sheet 📄 Offer letter ✓ Due diligence
Listing remarks
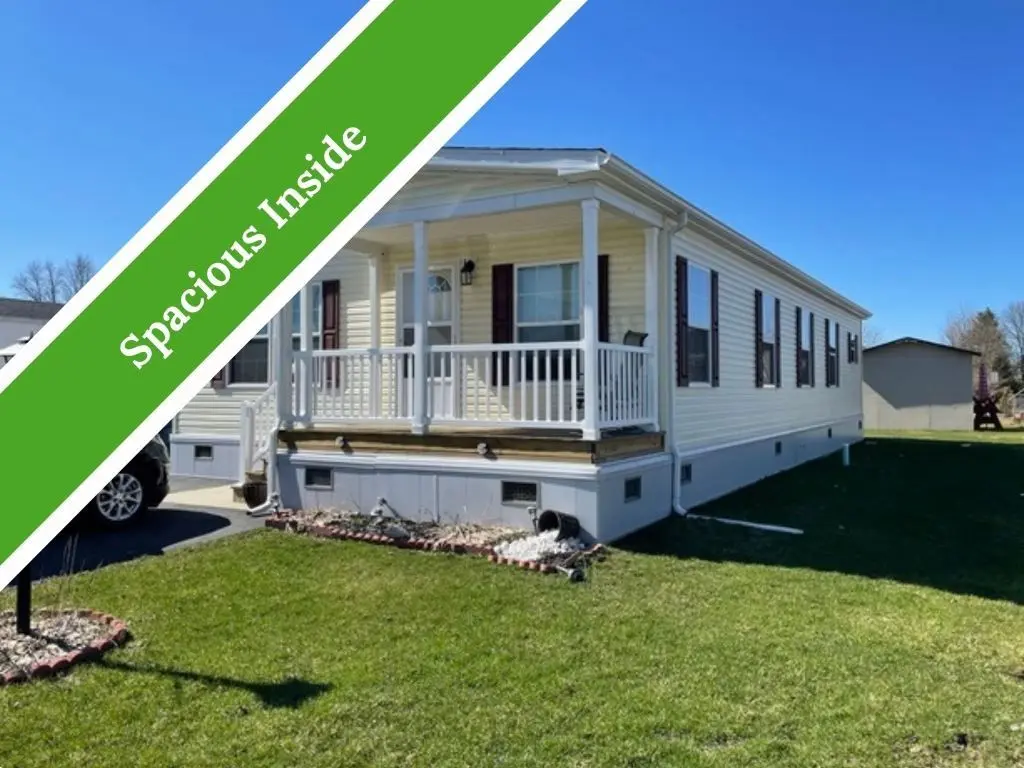
SALE PENDING---Welcome to The Woodlands an all age active and vibrant community, where you can find yourself in your dream home. We have a stunning, beautiful 3 bed, 2 bath home for sale featuring 1508.00 sq ft of beautifully designed living space. Located near Lockport, this property offers the perfect blend of modern amenities and timeless charm. Step inside to find an open-concept floor plan, vinyl floors, and plenty of natural light. The kitchen boasts features like clean glossy black appliances, custom cabinetry, and a kitchen island that is perfect for both everyday living and entertaining. The spacious primary suite offers a peaceful retreat, complete with en-suite features like plen
Key facts
- Vinyl floors
- Walk-in closet
- Walk-in shower
Tags
Property features AI
Finance
- Financial info: List price $122,000
Exterior
- Home design: Plan home named Saratoga; New construction (Plan)
- Construction: Living area approximately 1508; Built/listed in 2026
Interior
- Bedrooms: 3 bedrooms
- Bathrooms: 2 full bathrooms
- Interior features: Open living area
Neighborhood map
What this means for you Summary
Snapshot
- This is a 3-bed/2.0-bath manufactured listed at $122k. Condition is rated good.
Deal economics
- At list price, monthly cash flow is $649 ($8k/yr) — positive.
- The deal already cash-flows at list — no discount required.
- Meets the 1% rule at list price ($1k rent vs $122k).
- Recommended offer: $115k (6.0% below list) — sets the bar for market timing.
- Cap rate 16.4% vs local median 1.5% in South Lockport — top-decile yield for the area; either an underpriced asset or a hidden risk that comps aren't pricing in. Stress-test before assuming the spread holds.
Location & tenants
- Location reads 66/100 on livability (#633 in NY) — a middle-class / working-renter tenant base. Strengths: cost of living A+, health & safety A+; Watch: employment D+, schools F, crime F.
- Lockport City School District (town): math 44% / reading 49% proficiency, ranked #452 of 590 in NY (top 77%) — families likely to look elsewhere, expect single-tenant / working-renter base with shorter leases.
- Market conditions: Rents rising (+3.7%/yr); 357 active listings in the ZIP; 1 comparable units currently listed for rent nearby; solid renter incomes; 167 units permitted in Niagara County in 2024 (0 in 5+ unit buildings).
Forward outlook
- Local home prices are declining (-3.0%/yr); year-one equity from $532 of loan paydown is wiped out by about $2k of value loss. Plan a longer hold.
- Niagara County population projected at -19% by 2050 — secular population decline; favor cash flow + early exit over multi-decade hold.
- At projected returns (-3.0% appreciation + 3.7% rent growth), your $22k cash investment doubles in ~4 years — after that, you're playing with house money.
Negotiation context
- It's been on market 71 days — a 6% lower offer ($115k) is reasonable based on typical stale-listing flexibility.
Risks & watch-outs
- Climate carrying-cost: major flood risk — expect insurance premiums to compound above CPI over the hold.
Questions for the listing agent
- It's been on market 71 days. Have you received any prior offers? Is the seller open to a 6% concession, seller financing, or rate buy-down credit?
- Why hasn't it sold? Are there any deal-killer items the seller is aware of (foundation, flood, title, zoning, code violations)?
- Is there a deadline driving the sale (1031 exchange, divorce, estate, relocation)? That informs how much negotiation room exists.
- Schools are F-rated, which usually means shorter tenancies and higher turnover. Who's the typical renter profile here, and what's been the actual vacancy rate?
- Crime grade is F in this area — have there been break-ins, vandalism, or insurance claims at this property in the last 3 years? What carrier currently insures it and at what premium?
- What's the average days-on-market for RENTAL listings here right now (not sales)? A rising rental-DOM trend means longer vacancies and softer asking-rent achievability than the comps imply.
- What's the recent tenant-quality profile in this submarket — average credit score on applications, eviction rate, late-payment / NSF rate, and stable-employment percentage? A property-management company in the area should have these aggregated.
- How much new for-sale + rental construction is in the pipeline within 1–3 miles? Heavy new supply typically softens prices + rents 12–24 months out; constrained supply supports both.
Investment metrics
- 1% rule
- 1.94% ✓
- Cap rate
- 16.42%
- Cash-on-cash
- 36.18%
- DSCR
- 2.61
- GRM
- 4.3
CMA / ARV
- ARV (on-the-fly)
- $76,908
- Comps found
- 12
Show comp detail 12 sales within ~0.75 mi
| Address | Dist | Beds/Ba | Sqft | Sold | Price | $/sf | Match |
|---|---|---|---|---|---|---|---|
| 519 Applewood Dr #519 | 0.08mi | 4/2.0 (+1) | 1,456 (-3%) | 5mo | $42,500 | $29 | 81 |
| 901 Hollywood Dr | 0.30mi | 3/2.0 | 1,456 (-3%) | 2mo | $82,000 | $56 | 79 |
| 1009 Ridgewood | 0.34mi | 3/2.0 | 1,461 (-3%) | 1mo | $50,000 | $34 | 78 |
| 472 Chestnut Dr | 0.20mi | 3/2.0 | 1,456 (-3%) | 8mo | $75,000 | $52 | 78 |
| 1172 Underwood Ct | 0.31mi | 3/2.0 | 1,568 (+4%) | 5mo | $80,000 | $51 | 74 |
| 525 Applewood Dr | 0.09mi | 2/2.0 (-1) | 1,400 (-7%) | 6mo | $50,000 | $36 | 74 |
| 1218 Maplewood Dr | 0.50mi | 3/2.0 | 1,568 (+4%) | 0mo | $70,000 | $45 | 70 |
| 643 Birchwood Dr | 0.23mi | 3/2.0 | 1,366 (-9%) | 6mo | $69,000 | $51 | 69 |
| 909 Hollywood Dr | 0.28mi | 3/2.0 | 1,400 (-7%) | 8mo | $80,000 | $57 | 69 |
| 433 Chestnut Dr | 0.22mi | 3/2.0 | 1,344 (-11%) | 5mo | $55,000 | $41 | 68 |
| 1070 Fernwood Dr | 0.43mi | 3/2.0 | 1,344 (-11%) | 5mo | $72,000 | $54 | 58 |
| 807 Fernwood Dr | 0.34mi | 3/2.0 | 1,730 (+15%) | 5mo | $82,000 | $47 | 56 |
Match score weights: distance 35% · size 25% · config 20% · recency 20%. Top-matched comps best support the ARV.
Projected returns pro-forma
-3.0% appreciation · 3.67% rent growth · sell at horizon
- IRR
- 32.7%
- Equity multiple
- 2.39×
- Total profit
- $29,930
- Equity at exit
- $11,467
- IRR
- 40.1%
- Equity multiple
- 4.88×
- Total profit
- $83,625
- Equity at exit
- $6,650
Cash invested: $21,534 (down + closing). Projections, not guarantees.
Landlord ↔ Tenant lean methodology
- Overall (STATE)
- 15 Strongly Tenant-Friendly
- State New York
- 15 Strongly Tenant-Friendly · D+10
- County
- — inherits STATE
- City
- — inherits STATE
ZIP-level market 14094
- Rents YoY
- 3.7%
- Active inventory
- 357
- Price-to-rent
- 6.8×
Monthly cashflow live
- Estimated rent
- $1,495 medium interval (Pro) →
- Mortgage (P&I)
- −$403
- Tax est. 1.5%
- −$96 /mo · $1,154/yr
- Insurance
- −$32
- HOA
- −$0
- Vacancy / Maint / Mgmt
- −$314
- Net cashflow
- $649
Break-even live
UW: 25.0% down · 7.5% · 30yr · 1.5% tax · 5.0% vac · 8.0% maint · 8.0% mgmt
Financing live
Cash to close
- Down payment
- $19,227
- Closing costs
- $2,307
- Reserves months
- —
- Total cash needed
- —
Loan-product check · same deal, 3 products live
Conventional
25% down · 7.5% · 30yr
- Down + closing
- —
- Monthly P&I
- —
- Monthly cashflow
- —
- DSCR
- —
- Eligible?
- —
Personal DTI + credit; lowest rate.
DSCR
20% down · 8.5% · 30yr
- Down + closing
- —
- Monthly P&I
- —
- Monthly cashflow
- —
- DSCR
- —
- Eligible?
- —
No personal income docs; deal must DSCR.
Hard money
10% down · 12.0% · 12mo
- Down + closing
- —
- Monthly P&I
- —
- Monthly cashflow
- —
- DSCR
- —
- Eligible?
- —
Short-term bridge; refi at stabilization.
Rent comps 1 comps
| Address | Beds | Baths | Sqft | Rent | $/sqft | DOM | Units | Dist |
|---|---|---|---|---|---|---|---|---|
| 5834 S Transit Rd Lockport, NY | 2.0 | 1.0 | 1200 | $1,600 | $1.33 | 2d | 1 | 1.38mi |
Listing history 15 events
-
2026-06-18days on market $122,000 Active 71 DOM
-
2026-06-17days on market $122,000 Active 70 DOM
-
2026-06-16days on market $122,000 Active 69 DOM
-
2026-06-15days on market $122,000 Active 68 DOM
-
2026-06-13days on market $122,000 Active 66 DOM
-
2026-06-13days on market $122,000 Active 65 DOM
-
2026-06-10days on market $122,000 Active 63 DOM
-
2026-06-09days on market $122,000 Active 62 DOM
-
2026-06-08days on market $122,000 Active 61 DOM
-
2026-06-07days on market $122,000 Active 60 DOM
-
2026-06-05days on market $122,000 Active 57 DOM
-
2026-06-03days on market $122,000 Active 56 DOM
-
2026-06-02days on market $122,000 Active 55 DOM
-
2026-06-01days on market $122,000 Active 54 DOM
-
2026-05-31days on market $122,000 Active 53 DOM
ⓘ Source: listings_history table (triggers on properties + properties_extension) + one-shot
backfill from property_details.listing_events for pre-trigger history.
Climate risk First Street
- Flood 6/10 Major FEMA zone X (unshaded) · 72% chance over 30 yrs
- Wildfire 3/10 Moderate
- Heat 2/10 Low 7 d/yr ≥94°F today · 15 d/yr by 30 yrs out
- Wind 1/10 Low
- Air quality 2/10 Low 2 unhealthy d/yr today · 2 by 30 yrs out
Nearby sold comps map
Loading sold comps map…
Walkable amenities ~0.75 mi
Loading nearby amenities…
Taxation est. · year 1
- Rental income
- $17,936
- − Mortgage interest
- −$4,308
- − Property taxes
- −$1,154
- − Insurance
- −$385
- − Repairs & maintenance
- −$1,435
- − Management
- −$1,435
- − Depreciation
- −$2,237
- Taxable income
- $6,983
- Est. tax owed @ 24.0%
- −$1,676
- After-tax cash flow
- $6,116/yr
For passive investors: Depreciation is non-cash, so a rental often shows a tax loss while cash-flowing — sheltering income. Rental losses are passive: they offset passive income freely, and up to $25,000/yr can offset ordinary (W-2) income if you actively participate and your MAGI is under $100k (phasing out to $0 by $150k); unused losses carry forward. On sale, claimed depreciation is recaptured at up to 25%, and gains may owe capital-gains tax (a 1031 exchange can defer both). Figures are a year-1 estimate at your 24.0% rate — not tax advice; consult a CPA.
Condition & rehab AI · 12 photos
This manufactured home is in good condition with a good condition score of 75. It has a good kitchen, bathrooms, and exterior. The flooring and paint could be updated to increase its value. The home is move-in ready and has a spacious interior.
Value-add opportunities
- Resale Paint touch-ups — Enhances curb appeal and interior aesthetics
- Both Replace outdated flooring — Improves both resale and rental value
- Resale Update kitchen appliances — Modernizes the kitchen and attracts buyers
- Resale Replace dated cabinetry — Modernizes the kitchen and attracts buyers
- Both Replace dated flooring — Improves both resale and rental value
- Both Replace dated paint — Improves both resale and rental value
Renovation cost estimate screening
Value-add ROI direction
- Resale Paint touch-ups — Enhances curb appeal and interior aesthetics ↑
- Both Replace outdated flooring — Improves both resale and rental value ↑
- Resale Update kitchen appliances — Modernizes the kitchen and attracts buyers ↑
- Resale Replace dated cabinetry — Modernizes the kitchen and attracts buyers ↑
- Both Replace dated flooring — Improves both resale and rental value ↑
- Both Replace dated paint — Improves both resale and rental value ↑
ⓘ Cost ranges are severity-bucket heuristics (US national rule-of-thumb). Get contractor quotes + a written scope before underwriting a rehab budget.
Schools (NCES district)
- District
- Lockport City School District
- NCES district ID
- 3617670
- Math proficiency
- 44% ▼ -7.00%
- Reading proficiency
- 49% ▲ 3.00%
- Median HH income
- $43,793
- Composite
- 39.28/100
- National rank
- #3997
- State rank
- #452 of 590 in NY
Livability — South Lockport
- Score
- 66/100
- State rank
- #633
- US rank
- #11642
Category grades
Schools grade is shown separately in the Schools card above.
Census & demographics
- Census place
- South Lockport, NY
- County
- Niagara County · 157,377 people
- Metro
- Buffalo-Cheektowaga, NY
- Population (ZIP)
- 50,153
- Household income
- $75,427
- Rent vs Own
- Severe rent burden
- 1112.0
Population outlook (Niagara County) Hauer SSP2
- Today (2025)
- 204,149 people
- By 2030
- 197,900 · -3.1%
- By 2040
- 182,239 · -10.7%
- By 2050
- 165,198 · -19.1%
- By 2075
- 129,416 · -36.6%
- By 2100
- 96,222 · -52.9%
Race, ethnicity, and origin ACS 2023
- Neighborhood character
- Predominantly White (84%)
- Race & ethnicity
- White 84% Two or more races 6% Black 6% Hispanic / Latino 3%
- Common ancestry
- Romanian 9% Slovak 2% Lithuanian 2%
- Foreign-born
- 3% · Canada
- Languages at home
- 96% English-only · Spanish 1% Russian/Polish/Slavic 1% Other Indo-European 1%
Political lean MEDSL · Niagara
- 2024 margin
- R (+14.9) · D 42.5% · R 57.5%
- 2008→2024 swing
- -15.9pp toward R · 2008: 1.0pp · 2024: -14.9pp
- All cycles
- 2024: R+14.9 2020: R+9.7 2016: R+19.0 2012: D+0.6 2008: D+1.0
Not yet ingested
- Civics
- —
Market trends
- HPI YoY
- ▼ -262.57%
- Current HPI
- 303.6109
- Rent YoY
- ▲ 3.67%
- Metro
- Buffalo-Cheektowaga, NY
- State GDP YoY
- ▲ 2.60%
- F500 in state
- 92
Industry mix (Fortune 500 HQ in NY)
| Industry | F500 HQs | Revenue |
|---|---|---|
| Financial Services | 10 | $950B |
|
||
| Consumer Goods | 9 | $162B |
|
||
| Insurance | 4 | $225B |
|
||
| Telecommunications | 2 | $144B |
|
||
| Pharmaceuticals | 2 | $112B |
|
||
| Media / Entertainment | 2 | $69B |
|
||
Cash-flow waterfall
monthlySold comps — $/sqft
last 12 mo · ≤1 miLoading sold comps…