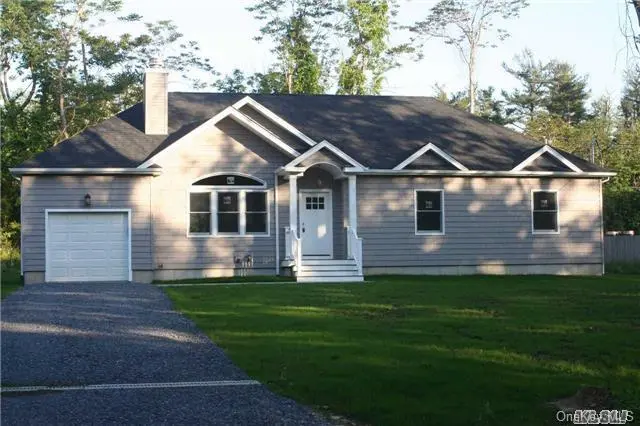
380 Homestead Way · Greenport West, NY
Flood risk 4/10 · Minor
- FEMA flood zone
- X (unshaded)
- Chance of flooding over 30 yrs
- 0.22%
- Est. flood insurance / yr
- $507 – $1,088
Fire risk 2/10 · Minimal
- Est. fire insurance / yr
- $691 – $1,283
Heat risk 5/10 · Moderate
- Hot days now (above 90°F)
- 7 days/yr
- Hot days in 30 yrs
- 19 days/yr
Wind risk 8/10 · Major
- Chance of severe wind over 30 yrs
- 80.0%
Air-quality risk 3/10 · Minor
- Unhealthy air days now
- 3 days/yr
- Unhealthy air days in 30 yrs
- 4 days/yr
Risk factors via First Street. Map © Google.
Why this score? — see what drove the C grade
The composite is a weighted blend of 9 inputs, each scored 0–100. Each bar is that input's sub-score; the figure is the points it added to the 100-point composite (weight × sub-score).
- Cash flow +29.1/30.0
- DSCR +10.0/10.0
- 1% rule +7.4/10.0
- Schools +4.5/10.0
- Livability +2.9/5.0
- Rent growth +2.5/5.0
- Condition / age +2.5/5.0
- ARV discount +0.9/15.0
- Appreciation +0.0/10.0
$1,149,900
🖨 Deal sheet (PDF) 📄 Offer letter ✓ Due diligence
Listing remarks MLS
Brand New 3/2 Ranch In Gpo, Deeded Eastern Stirling Shores Beach, Town A Mile Away . Nearby Wineries. Year Round Or Investment Property On The North Fork ! Room For Pool, Fire Pit And Deck. All The North Fork Has To Offer Right In Greenport .Priced To Sell * True Taxes Cannot Be Determined Until Purchase., Additional information: Appearance:New Constr,Interior Features:Lr/Dr
Key facts
- Gourmet kitchen
- Updated bathrooms
- Cozy fireplace
Tags
Neighborhood map
What this means for you Summary
Snapshot
- This is a 3-bed/2.0-bath single-family listed at $1.15M.
Deal economics
- At list price, monthly cash flow is $4k ($48k/yr) — positive.
- The deal already cash-flows at list — no discount required.
- Meets the 1% rule at list price ($14k rent vs $1.15M).
- Recommended offer: $1.01M (12.0% below list) — sets the bar for market timing.
- Cap rate 10.4% vs local median 8.1% in Greenport West — meaningfully above typical; check what's discounted (condition, days-on-market, listing class) to confirm the premium yield is real.
Location & tenants
- Location reads 58/100 on livability (#1,073 in NY) — a working-class tenant base; expect higher turnover. Strengths: crime A+, employment A+; Watch: amenities F, commute F, cost of living F.
- Greenport Union Free School District (town): math 55% / reading 45% proficiency, ranked #450 of 755 in NY (top 60%) — acceptable for families but not a draw, mixed tenant base, ~2y average lease.
- Zoned schools: Greenport Elementary School (math 47% / reading 62%, grade C, #908 of 2,108 statewide, top 46%, 339 students, 61% FRL); Greenport High School (math 52% / reading 54%, grade C-, #934 of 1,100 statewide, top 86%, 356 students, 63% FRL).
- Market conditions: 69 active listings in the ZIP; 10 comparable units currently listed for rent nearby; rentals lingering (median 45d on market — plan ~5-8 weeks vacancy on turnover, expect pricing pressure); 60% of comp listings sitting > 30 days — soft ceiling on asking rent; 1,366 units permitted in Suffolk County in 2024 (216 in 5+ unit buildings).
Forward outlook
- Local home prices are declining (-3.0%/yr); year-one equity from $8k of loan paydown is wiped out by about $34k of value loss. Plan a longer hold.
- Suffolk County population projected to shrink 5% by 2050 — rents likely to lag national; underwrite the cash flow, not the appreciation.
- At projected returns (-3.0% appreciation + 3.0% rent growth), your $322k cash investment doubles in ~8 years — after that, you're playing with house money.
Negotiation context
- It's been on market 250 days — a 12% lower offer ($1.01M) is reasonable based on typical stale-listing flexibility.
- 2 sale attempts since 9y ago with the ask held roughly flat each time — persistent listings suggest the price (not the market) is what's stuck; bring a comps-based counter.
- Current owner paid $760k; list at $1.15M implies a 51% gain — meaningful room to come down on a strong offer.
Risks & watch-outs
- Climate carrying-cost: severe wind risk, 80% chance of damaging wind over 30y; extreme-heat days projected 7→19/yr by 2055 (HVAC capex compounding) — expect insurance premiums to compound above CPI over the hold.
Questions for the listing agent
- It's been on market 250 days. Have you received any prior offers? Is the seller open to a 12% concession, seller financing, or rate buy-down credit?
- Why hasn't it sold? Are there any deal-killer items the seller is aware of (foundation, flood, title, zoning, code violations)?
- Is there a deadline driving the sale (1031 exchange, divorce, estate, relocation)? That informs how much negotiation room exists.
- Schools are D-rated, which usually means shorter tenancies and higher turnover. Who's the typical renter profile here, and what's been the actual vacancy rate?
- What's the average days-on-market for RENTAL listings here right now (not sales)? A rising rental-DOM trend means longer vacancies and softer asking-rent achievability than the comps imply.
- What's the recent tenant-quality profile in this submarket — average credit score on applications, eviction rate, late-payment / NSF rate, and stable-employment percentage? A property-management company in the area should have these aggregated.
- How much new for-sale + rental construction is in the pipeline within 1–3 miles? Heavy new supply typically softens prices + rents 12–24 months out; constrained supply supports both.
Investment metrics
- 1% rule
- 1.24% ✓
- Cap rate
- 10.43%
- Cash-on-cash
- 14.79%
- DSCR
- 1.66
- GRM
- 6.7
CMA / ARV
- ARV (median comp)
- $1,003,282
- List price
- $1,149,900
- Delta
- 14.61%
- Verdict
- OVERPRICED
- Comps
- 20 within 1.0 mi
Show comp detail 7 sales within ~0.75 mi
| Address | Dist | Beds/Ba | Sqft | Sold | Price | $/sf | Match |
|---|---|---|---|---|---|---|---|
| 795 Westwood Ln | 0.18mi | 3/2.0 | 1,500 (-9%) | 10mo | $1,230,000 | $820 | 68 |
| 1605 Washington Ave | 0.33mi | 4/3.0 (+1) | 1,740 (+6%) | 6mo | $1,295,000 | $744 | 61 |
| 3400 & 3500 Sound Dr | 0.36mi | 3/2.0 | 1,500 (-9%) | 8mo | $4,600,000 | $3,067 | 61 |
| 57 (aka 400) Wilmarth Ave | 0.42mi | 3/1.0 | 1,500 (-9%) | 4mo | $585,000 | $390 | 58 |
| 1295 Washington Ave | 0.38mi | 2/1.5 (-1) | 1,500 (-9%) | 3mo | $630,000 | $420 | 57 |
| 216 North St | 0.73mi | 3/3.5 | 1,724 (+4%) | 0mo | $999,000 | $579 | 52 |
| 16 Washington Ave | 0.56mi | 3/1.5 | 1,550 (-6%) | 12mo | $979,000 | $632 | 52 |
Match score weights: distance 35% · size 25% · config 20% · recency 20%. Top-matched comps best support the ARV.
Projected returns pro-forma
-3.0% appreciation · 3.0% rent growth · sell at horizon
- IRR
- 5.3%
- Equity multiple
- 1.21×
- Total profit
- $66,277
- Equity at exit
- $171,454
- IRR
- 14.7%
- Equity multiple
- 2.19×
- Total profit
- $382,546
- Equity at exit
- $99,422
Cash invested: $321,972 (down + closing). Projections, not guarantees.
Landlord ↔ Tenant lean methodology
- Overall (STATE)
- 15 Strongly Tenant-Friendly
- State New York
- 15 Strongly Tenant-Friendly · D+10
- County
- — inherits STATE
- City
- — inherits STATE
ZIP-level market 11944
- Home prices YoY
- -23.7%
- Active inventory
- 69
- Price-to-rent
- 6.7×
Monthly cashflow live
- Estimated rent
- $14,310 high interval (Pro) →
- Mortgage (P&I)
- −$6,030
- Tax from tax record
- −$827 /mo · $9,920/yr
- Insurance
- −$479
- HOA
- −$0
- Vacancy / Maint / Mgmt
- −$3,005
- Net cashflow
- $3,969
Break-even live
Sensitivity live
| Price | -10% $4,620 | -5% $4,294 | +0% $3,969 | +5% $3,643 | +10% $3,318 |
|---|---|---|---|---|---|
| Rent | -10% $2,838 | -5% $3,403 | +0% $3,969 | +5% $4,534 | +10% $5,099 |
| Rate | -1.0pp $4,548 | -0.5pp $4,261 | base $3,969 | +0.5pp $3,671 | +1.0pp $3,368 |
UW: 25.0% down · 7.5% · 30yr · 1.5% tax · 5.0% vac · 8.0% maint · 8.0% mgmt
Financing live
Cash to close
- Down payment
- $287,475
- Closing costs
- $34,497
- Reserves months
- —
- Total cash needed
- —
Loan-product check · same deal, 3 products live
Conventional
25% down · 7.5% · 30yr
- Down + closing
- —
- Monthly P&I
- —
- Monthly cashflow
- —
- DSCR
- —
- Eligible?
- —
Personal DTI + credit; lowest rate.
DSCR
20% down · 8.5% · 30yr
- Down + closing
- —
- Monthly P&I
- —
- Monthly cashflow
- —
- DSCR
- —
- Eligible?
- —
No personal income docs; deal must DSCR.
Hard money
10% down · 12.0% · 12mo
- Down + closing
- —
- Monthly P&I
- —
- Monthly cashflow
- —
- DSCR
- —
- Eligible?
- —
Short-term bridge; refi at stabilization.
Rent comps 10 comps
| Address | Beds | Baths | Sqft | Rent | $/sqft | DOM | Units | Dist |
|---|---|---|---|---|---|---|---|---|
| 485 Sutton Pl Greenport, NY | 4.0 | 2.5 | 2026 | $20,000 | $9.87 | 45d | 1 | 0.42mi |
| 744 Main St Unit 2 Greenport, NY | 2.0 | 2.0 | 1200 | $3,400 | $2.83 | 45d | 1 | 0.74mi |
| 312 5th Ave Greenport, NY | 4.0 | 2.0 | 1900 | $12,000 | $6.32 | 45d | 1 | 0.79mi |
| 248 5th Ave Greenport, NY | 2.0 | 1.0 | 1306 | $3,500 | $2.68 | 45d | 1 | 0.82mi |
| 123 Sterling Ave #2 Greenport, NY | 3.0 | 3.0 | 1528 | $45,000 | $29.45 | 45d | 1 | 1.03mi |
| 517 Flint St Greenport, NY | 2.0 | 1.0 | 1100 | $3,500 | $3.18 | 45d | 1 | 1.07mi |
| 237 6th St Greenport, NY | 2.0 | 2.5 | 1452 | $14,000 | $9.64 | 13d | 1 | 1.11mi |
| 134 6th St Greenport, NY | 3.0 | 2.0 | 1560 | $18,500 | $11.86 | 20d | 1 | 1.27mi |
| 131 6th St Unit G Greenport, NY | 3.0 | 2.5 | 2238 | $5,000 | $2.23 | 26d | 1 | 1.28mi |
| 8 Oyster Pt Greenport, NY | 2.0 | 2.0 | 1190 | $5,500 | $4.62 | 5d | 1 | 1.39mi |
Listing history 24 events
-
2026-06-21days on market $1,149,900 Active 250 DOM
-
2026-06-21days on market $1,149,900 Active 249 DOM
-
2026-06-18days on market $1,149,900 Active 247 DOM
-
2026-06-17days on market $1,149,900 Active 246 DOM
-
2026-06-16days on market $1,149,900 Active 245 DOM
-
2026-06-15days on market $1,149,900 Active 244 DOM
-
2026-06-13days on market $1,149,900 Active 242 DOM
-
2026-06-12days on market $1,149,900 Active 241 DOM
-
2026-06-09days on market $1,149,900 Active 238 DOM
-
2026-06-08days on market $1,149,900 Active 237 DOM
-
2026-06-07days on market $1,149,900 Active 236 DOM
-
2026-06-05days on market $1,149,900 Active 234 DOM
-
2026-06-04days on market $1,149,900 Active 232 DOM
-
2026-06-02days on market $1,149,900 Active 231 DOM
-
2026-06-01days on market $1,149,900 Active 230 DOM
-
2026-05-31days on market $1,149,900 Active 229 DOM
-
2025-10-06$1,200,000 Active
-
2021-10-22soldstatus $760,000
-
2017-12-07soldstatus $522,500 Closed 380-char remark
Show marketing remark (380 chars)
Brand New 3/2 Ranch In Gpo, Deeded Eastern Stirling Shores Beach, Town A Mile Away . Nearby Wineries. Year Round Or Investment Property On The North Fork ! Room For Pool, Fire Pit And Deck. All The North Fork Has To Offer Right In Greenport .Priced To Sell * True Taxes Cannot Be Determined Until Purchase., Additional information: Appearance:New Constr,Interior Features:Lr/Dr
-
2017-10-07status Under Contract 380-char remark
Show marketing remark (380 chars)
Brand New 3/2 Ranch In Gpo, Deeded Eastern Stirling Shores Beach, Town A Mile Away . Nearby Wineries. Year Round Or Investment Property On The North Fork ! Room For Pool, Fire Pit And Deck. All The North Fork Has To Offer Right In Greenport .Priced To Sell * True Taxes Cannot Be Determined Until Purchase., Additional information: Appearance:New Constr,Interior Features:Lr/Dr
-
2017-08-21price $534,000 380-char remark
Show marketing remark (380 chars)
Brand New 3/2 Ranch In Gpo, Deeded Eastern Stirling Shores Beach, Town A Mile Away . Nearby Wineries. Year Round Or Investment Property On The North Fork ! Room For Pool, Fire Pit And Deck. All The North Fork Has To Offer Right In Greenport .Priced To Sell * True Taxes Cannot Be Determined Until Purchase., Additional information: Appearance:New Constr,Interior Features:Lr/Dr
-
2017-06-15price $549,000 380-char remark
Show marketing remark (380 chars)
Brand New 3/2 Ranch In Gpo, Deeded Eastern Stirling Shores Beach, Town A Mile Away . Nearby Wineries. Year Round Or Investment Property On The North Fork ! Room For Pool, Fire Pit And Deck. All The North Fork Has To Offer Right In Greenport .Priced To Sell * True Taxes Cannot Be Determined Until Purchase., Additional information: Appearance:New Constr,Interior Features:Lr/Dr
-
2017-06-05price $574,000 380-char remark
Show marketing remark (380 chars)
Brand New 3/2 Ranch In Gpo, Deeded Eastern Stirling Shores Beach, Town A Mile Away . Nearby Wineries. Year Round Or Investment Property On The North Fork ! Room For Pool, Fire Pit And Deck. All The North Fork Has To Offer Right In Greenport .Priced To Sell * True Taxes Cannot Be Determined Until Purchase., Additional information: Appearance:New Constr,Interior Features:Lr/Dr
-
2017-05-04$599,000 New 380-char remark
Show marketing remark (380 chars)
Brand New 3/2 Ranch In Gpo, Deeded Eastern Stirling Shores Beach, Town A Mile Away . Nearby Wineries. Year Round Or Investment Property On The North Fork ! Room For Pool, Fire Pit And Deck. All The North Fork Has To Offer Right In Greenport .Priced To Sell * True Taxes Cannot Be Determined Until Purchase., Additional information: Appearance:New Constr,Interior Features:Lr/Dr
ⓘ Source: listings_history table (triggers on properties + properties_extension) + one-shot
backfill from property_details.listing_events for pre-trigger history.
Tax reassessment forecast NY · Partial reset (capped growth)
- Current annual tax
- $9,920 · $827/mo
- Projected year-2 tax
- $14,677 · $1,223/mo
- Expected delta
- +$4,757/yr (+$396/mo · 48.0%)
ⓘ Screening estimate from a state-policy table — verify with the county assessor before closing.
Climate risk First Street
- Flood 4/10 Moderate FEMA zone X (unshaded) · 22% chance over 30 yrs
- Wildfire 2/10 Low
- Heat 5/10 Major 7 d/yr ≥90°F today · 19 d/yr by 30 yrs out
- Wind 8/10 Severe 80% chance of damaging wind over 30 yrs
- Air quality 3/10 Moderate 3 unhealthy d/yr today · 4 by 30 yrs out
Nearby sold comps map
Loading sold comps map…
Walkable amenities ~0.75 mi
Loading nearby amenities…
Taxation est. · year 1
- Rental income
- $171,717
- − Mortgage interest
- −$64,412
- − Property taxes
- −$9,920
- − Insurance
- −$5,750
- − Repairs & maintenance
- −$13,737
- − Management
- −$13,737
- − Depreciation
- −$33,452
- Taxable income
- $30,709
- Est. tax owed @ 24.0%
- −$7,370
- After-tax cash flow
- $40,254/yr
For passive investors: Depreciation is non-cash, so a rental often shows a tax loss while cash-flowing — sheltering income. Rental losses are passive: they offset passive income freely, and up to $25,000/yr can offset ordinary (W-2) income if you actively participate and your MAGI is under $100k (phasing out to $0 by $150k); unused losses carry forward. On sale, claimed depreciation is recaptured at up to 25%, and gains may owe capital-gains tax (a 1031 exchange can defer both). Figures are a year-1 estimate at your 24.0% rate — not tax advice; consult a CPA.
Schools (NCES district)
- District
- Greenport Union Free School District
- NCES district ID
- 3612840
- Math proficiency
- 55% ▲ 5.00%
- Reading proficiency
- 45% ▼ -5.00%
- Median HH income
- $54,490
- Composite
- 45.25/100
- National rank
- #5759
- State rank
- #450 of 755 in NY
Livability — Greenport West
- Score
- 58/100
- State rank
- #1073
- US rank
- #21520
Category grades
Schools grade is shown separately in the Schools card above.
Census & demographics
- Census place
- Greenport West, NY
- Population (ZIP)
- 4,744
Population outlook (Suffolk County) Hauer SSP2
- Today (2025)
- 1,505,262 people
- By 2030
- 1,498,318 · -0.5%
- By 2040
- 1,471,101 · -2.3%
- By 2050
- 1,424,848 · -5.3%
- By 2075
- 1,337,157 · -11.2%
- By 2100
- 1,217,720 · -19.1%
Race, ethnicity, and origin ACS 2023
- Neighborhood character
- Predominantly White (69%)
- Race & ethnicity
- White 69% Hispanic / Latino 23% Two or more races 6% Black 4% Asian 2%
- Hispanic origin (detail)
- Mexican 5% Puerto Rican 2%
- Common ancestry
- Romanian 6% Lithuanian 2% Subsaharan African 2%
- Foreign-born
- 19% · Canada, China
- Languages at home
- 69% English-only · Spanish 22% German/W. Germanic 3% Russian/Polish/Slavic 2%
Political lean MEDSL · Suffolk
- 2024 margin
- Lean R (+10.0) · D 45.0% · R 55.0%
- 2008→2024 swing
- -16.0pp toward R · 2008: 6.0pp · 2024: -10.0pp
- All cycles
- 2024: R+10.0 2020: R+0.0 2016: R+8.2 2012: D+2.9 2008: D+6.0
Not yet ingested
- Civics
- —
Market trends
- HPI YoY
- ▼ -143.97%
- Current HPI
- 462.3431
- Rent YoY
- —
- Metro
- —
- State GDP YoY
- ▲ 2.60%
- F500 in state
- 92
Industry mix (Fortune 500 HQ in NY)
| Industry | F500 HQs | Revenue |
|---|---|---|
| Financial Services | 10 | $950B |
|
||
| Consumer Goods | 9 | $162B |
|
||
| Insurance | 4 | $225B |
|
||
| Telecommunications | 2 | $144B |
|
||
| Pharmaceuticals | 2 | $112B |
|
||
| Media / Entertainment | 2 | $69B |
|
||
Price history
+100.3% since first listed8 events — show timeline
- 2025-10-06 Listed $1,200,000 OneKey® MLS as Distributed by MLS Grid
- 2021-10-22 Sold (Public Records) $760,000 Public Records
- 2017-12-07 Sold (MLS) $522,500 OneKey® MLS as Distributed by MLS Grid
- 2017-10-07 Pending — OneKey® MLS as Distributed by MLS Grid
- 2017-08-21 Price Changed $534,000 OneKey® MLS as Distributed by MLS Grid
- 2017-06-15 Price Changed $549,000 OneKey® MLS as Distributed by MLS Grid
- 2017-06-05 Price Changed $574,000 OneKey® MLS as Distributed by MLS Grid
- 2017-05-04 Listed $599,000 OneKey® MLS as Distributed by MLS Grid
Property tax history
+16.5%/yrLatest (2025): $9,920 · +0.0% YoY. Source: county tax records.
Cash-flow waterfall
monthlySold comps — $/sqft
last 12 mo · ≤1 miLoading sold comps…