 Fourplex
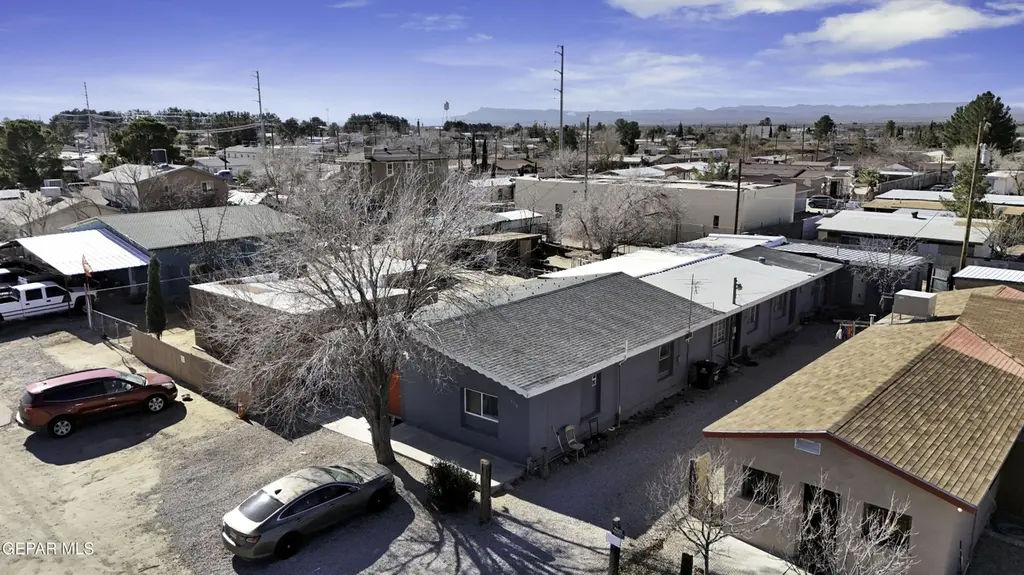
218 NW I Ave Unit ABCD · Fabens, TX
Flood risk 1/10 · Minimal
- FEMA flood zone
- —
- Chance of flooding over 30 yrs
- 0.0%
- Est. flood insurance / yr
- —
Fire risk 3/10 · Minor
- Est. fire insurance / yr
- $1,222 – $2,270
Heat risk 6/10 · Moderate
- Hot days now (above 100°F)
- 7 days/yr
- Hot days in 30 yrs
- 25 days/yr
Wind risk 1/10 · Minimal
- Chance of severe wind over 30 yrs
- —
Air-quality risk 2/10 · Minimal
- Unhealthy air days now
- 1 days/yr
- Unhealthy air days in 30 yrs
- 1 days/yr
Risk factors via First Street. Map © Google.
Why this score? — see what drove the B+ grade
The composite is a weighted blend of 9 inputs, each scored 0–100. Each bar is that input's sub-score; the figure is the points it added to the 100-point composite (weight × sub-score).
- Cash flow +30.0/30.0
- 1% rule +10.0/10.0
- DSCR +10.0/10.0
- Appreciation +9.9/10.0
- ARV discount +7.5/15.0
- Livability +2.7/5.0
- Rent growth +2.5/5.0
- Condition / age +2.2/5.0
- Schools +1.3/10.0
$194,950
🖨 Deal sheet 📄 Offer letter ✓ Due diligence
Multi-family units
County records classify this as Multi-Family (2-4 Unit). Listing-text estimate: 4 units. confirmed
Listing remarks
Investment Opportunity in Fabens, TX! This affordable quadruplex offers a rare chance to stop paying rent and start investing smart. This multi-unit property features four units, ALL UNITS currently rented, providing immediate rental income from day one. This property presents a strong opportunity to offset your mortgage with rental revenue. Ideal for first-time investors, or anyone looking to build long-term wealth or expand their investment portfolio. Conveniently located in Fabens with easy access to surrounding areas.
Key facts
- Four units
- Quadruplex
- Rental income
Tags
Property features AI
Finance
- Other: Four total units; Special listing conditions: Lead paint hazard, Owner is agent
Exterior
- Parking: On-street parking; Unassigned parking; Unpaved parking
- Home design: Quadruplex; Total building area about 3540; Lot around 0.14 acres
- Construction: Stucco construction; Metal and mixed roofing
- Exterior features: Metal and mixed roof; Stucco exterior
Interior
- Heating & cooling: Heating details available — see remarks; Has cooling
- Interior features: Appliances and interior details available — see remarks
Neighborhood map
What this means for you Summary
Snapshot
- This is a 4 × 2-bed/1-bath units multifamily listed at $195k. Condition is rated fair.
Deal economics
- At list price, monthly cash flow is $1k ($17k/yr) — positive. Per door: $350/mo.
- The deal already cash-flows at list — no discount required.
- Meets the 1% rule at list price ($3k rent vs $195k).
- Recommended offer: $192k (1.5% below list) — sets the bar for market timing.
Location & tenants
- Location reads 54/100 on livability (#1,383 in TX) — a working-class tenant base; expect higher turnover. Strengths: cost of living A+, housing A; Watch: crime D+, amenities F, commute F.
- Fabens ISD (town): math 13% / reading 21% proficiency, ranked #809 of 826 in TX (top 98%) — low school quality limits family demand, transient renter base, plan for 1-2y turnover.
- Zoned schools: Fabens El (math 22% / reading 22%, grade F, #3,333 of 4,322 statewide, top 80%, 623 students, 94% FRL); Fabens Middle (math 10% / reading 19%, grade F, #1,583 of 1,662 statewide, top 96%, 432 students, 94% FRL); Fabens H S (math 12% / reading 25%, grade F, #1,436 of 1,632 statewide, top 88%, 623 students, 89% FRL) — zoned schools average 92% FRL vs 49% district-wide (43 pts higher); higher-poverty schools than district average — tighter screening recommended.
- Market conditions: 28 active listings in the ZIP; 2,196 units permitted in El Paso County in 2024 (143 in 5+ unit buildings).
Forward outlook
- In year one you build about $21k of equity ($1k loan paydown + $19k appreciation (9.9% local appreciation)).
- El Paso County population projected at +10% by 2050 — modest demand growth; plan on rents tracking national, not racing it.
- At projected returns (9.9% appreciation + 3.0% rent growth), your $55k cash investment doubles in ~2 years — after that, you're playing with house money.
- By year 2, paydown + projected appreciation supports a ~$33k cash-out refi (75% LTV) — recoverable capital for the next deal without selling this one.
Negotiation context
- It's been on market 28 days — a 2% lower offer ($192k) is reasonable based on typical stale-listing flexibility.
Risks & watch-outs
- Climate carrying-cost: extreme-heat days projected 7→25/yr by 2055 (HVAC capex compounding) — expect insurance premiums to compound above CPI over the hold.
Questions for the listing agent
- Can we see the unit-by-unit rent roll, current vacancy, and any below-market leases? What's the average tenancy length?
- What capital expenditures (roof, boiler, parking lot, exteriors) have been made in the last 5 years, and what's planned in the next 2?
- Have any recent inspections been done? Can we get a copy of the seller's disclosures and any deferred-maintenance estimates?
- Built in 1977 — when were the roof, HVAC, electrical panel, plumbing, and water heater last replaced?
- Is there a deadline driving the sale (1031 exchange, divorce, estate, relocation)? That informs how much negotiation room exists.
- Schools are F-rated, which usually means shorter tenancies and higher turnover. Who's the typical renter profile here, and what's been the actual vacancy rate?
- Crime grade is D in this area — have there been break-ins, vandalism, or insurance claims at this property in the last 3 years? What carrier currently insures it and at what premium?
- What's the average days-on-market for RENTAL listings here right now (not sales)? A rising rental-DOM trend means longer vacancies and softer asking-rent achievability than the comps imply.
- What's the recent tenant-quality profile in this submarket — average credit score on applications, eviction rate, late-payment / NSF rate, and stable-employment percentage? A property-management company in the area should have these aggregated.
- How much new apartment / multifamily construction is in the pipeline within 1–3 miles? Heavy new supply (>2% of stock underway) typically softens rents 12–24 months out; light construction supports rent growth.
Investment metrics
- 1% rule
- 1.78% ✓
- Cap rate
- 14.91%
- Cash-on-cash
- 30.77%
- DSCR
- 2.37
- GRM
- 4.7
CMA / ARV
No comps found within radius.
Projected returns pro-forma
9.89% appreciation · 3.0% rent growth · sell at horizon
- IRR
- 47.5%
- Equity multiple
- 4.55×
- Total profit
- $193,846
- Equity at exit
- $174,009
- IRR
- 41.4%
- Equity multiple
- 10.17×
- Total profit
- $500,443
- Equity at exit
- $373,547
Cash invested: $54,586 (down + closing). Projections, not guarantees.
Landlord ↔ Tenant lean methodology
- Overall (STATE)
- 87 Strongly Landlord-Friendly
- State Texas
- 87 Strongly Landlord-Friendly · R+5
- County
- — inherits STATE
- City
- — inherits STATE
ZIP-level market 79838
- Home prices YoY
- 5.5%
- Active inventory
- 28
- Price-to-rent
- 18.7×
Monthly cashflow live
- Estimated rent
- $3,477 medium interval (Pro) →
- Mortgage (P&I)
- −$1,022
- Tax est. 1.5%
- −$244 /mo · $2,924/yr
- Insurance
- −$81
- HOA
- −$0
- Vacancy / Maint / Mgmt
- −$730
- Net cashflow
- $1,400
Break-even live
4-unit breakdown (identical units grouped — click to expand)
| Units | Beds | Baths | Est. rent |
|---|---|---|---|
| 4× units | 2 | 1 | $3,476 |
| #1 | 2 | 1 | $869 |
| #2 | 2 | 1 | $869 |
| #3 | 2 | 1 | $869 |
| #4 | 2 | 1 | $869 |
| Total (4 units) | $3,477 | ||
UW: 25.0% down · 7.5% · 30yr · 1.5% tax · 5.0% vac · 8.0% maint · 8.0% mgmt
Financing live
Cash to close
- Down payment
- $48,738
- Closing costs
- $5,848
- Reserves months
- —
- Total cash needed
- —
Loan-product check · same deal, 3 products live
Conventional
25% down · 7.5% · 30yr
- Down + closing
- —
- Monthly P&I
- —
- Monthly cashflow
- —
- DSCR
- —
- Eligible?
- —
Personal DTI + credit; lowest rate.
DSCR
20% down · 8.5% · 30yr
- Down + closing
- —
- Monthly P&I
- —
- Monthly cashflow
- —
- DSCR
- —
- Eligible?
- —
No personal income docs; deal must DSCR.
Hard money
10% down · 12.0% · 12mo
- Down + closing
- —
- Monthly P&I
- —
- Monthly cashflow
- —
- DSCR
- —
- Eligible?
- —
Short-term bridge; refi at stabilization.
Listing history 16 events
-
2026-06-18days on market $194,950 Active 28 DOM
-
2026-06-17days on market $194,950 Active 27 DOM
-
2026-06-16days on market $194,950 Active 26 DOM
-
2026-06-15days on market $194,950 Active 25 DOM
-
2026-06-13days on market $194,950 Active 23 DOM
-
2026-06-13days on market $194,950 Active 22 DOM
-
2026-06-10days on market $194,950 Active 20 DOM
-
2026-06-09days on market $194,950 Active 19 DOM
-
2026-06-08days on market $194,950 Active 18 DOM
-
2026-06-07days on market $194,950 Active 17 DOM
-
2026-06-05days on market $194,950 Active 14 DOM
-
2026-06-03days on market $194,950 Active 13 DOM
-
2026-06-03days on market $194,950 Active 12 DOM
-
2026-06-01days on market $194,950 Active 11 DOM
-
2026-05-31days on market $194,950 Active 10 DOM
-
2026-04-30$194,950 Active
ⓘ Source: listings_history table (triggers on properties + properties_extension) + one-shot
backfill from property_details.listing_events for pre-trigger history.
Climate risk First Street
- Flood 1/10 Low 0% chance over 30 yrs
- Wildfire 3/10 Moderate
- Heat 6/10 Major 7 d/yr ≥100°F today · 25 d/yr by 30 yrs out
- Wind 1/10 Low
- Air quality 2/10 Low 1 unhealthy d/yr today · 1 by 30 yrs out
Nearby sold comps map
Loading sold comps map…
Walkable amenities ~0.75 mi
Loading nearby amenities…
Taxation est. · year 1
- Rental income
- $41,724
- − Mortgage interest
- −$10,920
- − Property taxes
- −$2,924
- − Insurance
- −$975
- − Repairs & maintenance
- −$3,338
- − Management
- −$3,338
- − Depreciation
- −$5,671
- Taxable income
- $14,558
- Est. tax owed @ 24.0%
- −$3,494
- After-tax cash flow
- $13,301/yr
For passive investors: Depreciation is non-cash, so a rental often shows a tax loss while cash-flowing — sheltering income. Rental losses are passive: they offset passive income freely, and up to $25,000/yr can offset ordinary (W-2) income if you actively participate and your MAGI is under $100k (phasing out to $0 by $150k); unused losses carry forward. On sale, claimed depreciation is recaptured at up to 25%, and gains may owe capital-gains tax (a 1031 exchange can defer both). Figures are a year-1 estimate at your 24.0% rate — not tax advice; consult a CPA.
Condition & rehab AI · 12 photos
This quadruplex presents a moderate rehab opportunity with significant potential for increased value through cosmetic and moderate repairs.
Repairs flagged
- Minor Kitchen cabinets — Light wear and tear.
- Minor Bathroom fixtures — Light wear and tear.
- Moderate Exterior paint — Significant discoloration and wear.
- Moderate Carpeting — Significant wear and tear.
- Moderate Interior paint — Significant chipping and wear.
- Moderate Windows — Significant wear and tear.
- Moderate HVAC units — Significant wear and tear.
- Moderate Landscaping — Minimal landscaping and overgrown areas.
- Moderate Foundation cracks — Visible cracks in the foundation.
Value-add opportunities
- Both Painting exterior walls — Enhances curb appeal and property value.
- Both Re-carpeting bedrooms — Improves comfort and aesthetics, attracting more tenants.
- Both Re-painting interior walls — Enhances aesthetics and attracts more tenants.
- Both Reconditioning HVAC units — Improves comfort and energy efficiency, attracting more tenants.
- Both Landscaping and maintaining yard — Enhances curb appeal and attracts more tenants.
Renovation cost estimate screening
| Repair item | Severity | Est. cost |
|---|---|---|
| Kitchen cabinets · Light wear and tear. | Minor | $500–3,000 |
| Bathroom fixtures · Light wear and tear. | Minor | $500–3,000 |
| Exterior paint · Significant discoloration and wear. | Moderate | $3,000–15,000 |
| Carpeting · Significant wear and tear. | Moderate | $3,000–15,000 |
| Interior paint · Significant chipping and wear. | Moderate | $3,000–15,000 |
| Windows · Significant wear and tear. | Moderate | $3,000–15,000 |
| HVAC units · Significant wear and tear. | Moderate | $3,000–15,000 |
| Landscaping · Minimal landscaping and overgrown areas. | Moderate | $3,000–15,000 |
| Foundation cracks · Visible cracks in the foundation. | Moderate | $3,000–15,000 |
| Total estimated repair cost · 9 items | $22,000–111,000 |
Value-add ROI direction
- Both Painting exterior walls — Enhances curb appeal and property value. ↑
- Both Re-carpeting bedrooms — Improves comfort and aesthetics, attracting more tenants. ↑
- Both Re-painting interior walls — Enhances aesthetics and attracts more tenants. ↑
- Both Reconditioning HVAC units — Improves comfort and energy efficiency, attracting more tenants. ↑
- Both Landscaping and maintaining yard — Enhances curb appeal and attracts more tenants. ↑
ⓘ Cost ranges are severity-bucket heuristics (US national rule-of-thumb). Get contractor quotes + a written scope before underwriting a rehab budget.
Schools (NCES district)
- District
- Fabens ISD
- NCES district ID
- 4818900
- Math proficiency
- 13% ▼ -40.00%
- Reading proficiency
- 21% ▼ -17.00%
- Median HH income
- $26,215
- Composite
- 13.13/100
- National rank
- #9559
- State rank
- #809 of 826 in TX
Livability — Fabens
- Score
- 54/100
- State rank
- #1383
- US rank
- #23757
Category grades
Schools grade is shown separately in the Schools card above.
Census & demographics
- Census place
- Fabens, TX
- Population (ZIP)
- 4,813
Population outlook (El Paso County) Hauer SSP2
- Today (2025)
- 897,899 people
- By 2030
- 922,694 · +2.8%
- By 2040
- 960,492 · +7.0%
- By 2050
- 982,919 · +9.5%
- By 2075
- 997,266 · +11.1%
- By 2100
- 900,630 · +0.3%
Race, ethnicity, and origin ACS 2023
- Neighborhood character
- Predominantly Hispanic (97%)
- Race & ethnicity
- Hispanic / Latino 97% Two or more races 51% White 2%
- Hispanic origin (detail)
- Mexican 95%
- Foreign-born
- 38% · Canada
- Languages at home
- 15% English-only · Spanish 85%
Political lean MEDSL · El Paso
- 2024 margin
- D (+15.1) · D 57.0% · R 41.8% · Other 1.2%
- 2008→2024 swing
- -17.4pp toward R · 2008: 32.5pp · 2024: 15.1pp
- All cycles
- 2024: D+15.1 2020: D+35.1 2016: D+43.2 2012: D+32.6 2008: D+32.5
Not yet ingested
- Civics
- —
Market trends
- HPI YoY
- ▲ 9.89%
- Current HPI
- 187.9522
- Rent YoY
- —
- Metro
- —
- State GDP YoY
- ▲ 3.95%
- F500 in state
- 110
Industry mix (Fortune 500 HQ in TX)
| Industry | F500 HQs | Revenue |
|---|---|---|
| Energy | 16 | $1,198B |
|
||
| Technology | 5 | $198B |
|
||
| Engineering / Construction | 4 | $72B |
|
||
| Energy Services | 3 | $60B |
|
||
| Utilities | 3 | $41B |
|
||
| Healthcare | 2 | $330B |
|
||
Price history
1 event — show timeline
- 2026-04-30 Listed $194,950 GEPARMLS
Cash-flow waterfall
monthlySold comps — $/sqft
last 12 mo · ≤1 miLoading sold comps…