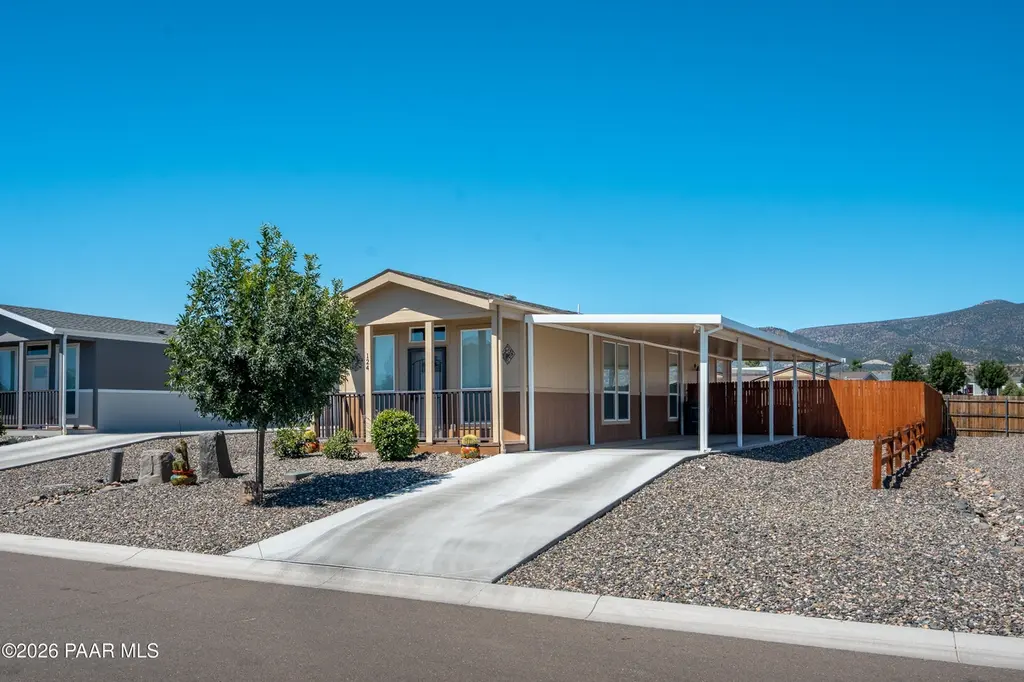
124 S Copper Canyon Loop · Camp Verde, AZ
Flood risk 1/10 · Minimal
- FEMA flood zone
- X (unshaded)
- Chance of flooding over 30 yrs
- 0.0%
- Est. flood insurance / yr
- $507 – $1,088
Fire risk 5/10 · Moderate
- Est. fire insurance / yr
- $610 – $1,132
Heat risk 7/10 · Major
- Hot days now (above 104°F)
- 7 days/yr
- Hot days in 30 yrs
- 20 days/yr
Wind risk 1/10 · Minimal
- Chance of severe wind over 30 yrs
- —
Air-quality risk 1/10 · Minimal
- Unhealthy air days now
- 0 days/yr
- Unhealthy air days in 30 yrs
- 0 days/yr
Risk factors via First Street. Map © Google.
Why this score? — see what drove the C grade
The composite is a weighted blend of 9 inputs, each scored 0–100. Each bar is that input's sub-score; the figure is the points it added to the 100-point composite (weight × sub-score).
- Cash flow +21.5/30.0
- ARV discount +11.3/15.0
- DSCR +6.9/10.0
- 1% rule +5.6/10.0
- Livability +3.3/5.0
- Rent growth +2.5/5.0
- Condition / age +2.5/5.0
- Schools +1.9/10.0
- Appreciation +0.0/10.0
$160,000
🖨 Deal sheet 📄 Offer letter ✓ Due diligence
Listing remarks MLS
Welcome to Verde Ranch Estates, a gated all-ages community offering resort-style amenities and carefree living! This charming 2 bedroom, 2 bathroom home features 920 sq ft with an inviting open-concept layout, laminate flooring, abundant natural light, and a stylish kitchen with stainless steel appliances and a convenient island. The spacious primary suite provides comfort and privacy, while the stacked washer/dryer adds everyday convenience. Outside, enjoy mountain views from the covered patio, a fenced backyard with low-maintenance turf, storage shed, and covered carport. Residents enjoy an impressive clubhouse with a pool, hot tub, fitness center, BBQ pavilion, putting green, pickleball court, horseshoe pit, dog park, and more. Experience the best of Verde Valley living!2 pet allowance. Lot lease is $585 monthly. Back ground check required on all residents. Please use Verde Ranch Estates website to apply and do background check within the inspection period: verderanchestates.comLending through 21st Mortgage Corporation or see list in documents tab.
Key facts
- Gated community
- Fenced backyard
- Open concept layout
Tags
Property features AI
Finance
- Other: Road maintenance agreement
- HOA & community: Land lease: $583 monthly; No association fees included; Community amenities: pool, spa, fitness center, pickleball courts
Exterior
- Parking: 2 covered parking spaces; 2 open parking spaces; 2 carport spaces
- Security: Gated community
- Utilities: City water; Public sewer
- Home design: Manufactured / mobile home; Fee simple ownership; Desert, red rocks/boulders, river and mountain views
- Construction: Wood frame construction; Composition (shingle) roof; Home warranty included
- Exterior features: Gravel/stone front yard; Gravel/stone backyard; Synthetic grass in back; Wood fencing; Shed(s)
Interior
- Kitchen: Refrigerator; Dishwasher; Disposal
- Bedrooms: 2 possible bedrooms
- Flooring: Laminate flooring
- Bathrooms: 2 full bathrooms
- Heating & cooling: Heat pump heating; Electric heating; Central air conditioning; Ceiling fans
- Interior features: Kitchen island; 3/4 bath in primary bedroom; Dual-pane windows; Zero‑grade entry (accessible)
Neighborhood map
What this means for you Summary
Snapshot
- This is a 2-bed/2.0-bath manufactured listed at $160k.
Deal economics
- At list price, monthly cash flow is $240 ($3k/yr) — positive.
- The deal already cash-flows at list — no discount required.
- Meets the 1% rule at list price ($2k rent vs $160k).
- Cap rate 8.1% vs local median 2.8% in Camp Verde — top-decile yield for the area; either an underpriced asset or a hidden risk that comps aren't pricing in. Stress-test before assuming the spread holds.
Location & tenants
- Location reads 66/100 on livability (#77 in AZ) — a middle-class / working-renter tenant base. Strengths: cost of living A, housing A, crime A-; Watch: amenities F, commute F, employment D-.
- Camp Verde Unified District (4470) (rural): math 20% / reading 25% proficiency, ranked #176 of 249 in AZ (top 71%) — low school quality limits family demand, transient renter base, plan for 1-2y turnover; 63% free/reduced lunch — lower-income household profile, screen leases tightly.
- Zoned schools: Camp Verde Elementary School (math 24% / reading 31%, grade F, #592 of 1,109 statewide, top 54%, 679 students, 61% FRL); Camp Verde Middle School (math 21% / reading 27%, grade F, #109 of 218 statewide, top 51%, 365 students, 60% FRL) — zoned schools at 61% FRL track the district average.
- Market conditions: 140 active listings in the ZIP; 5 comparable units currently listed for rent nearby; rentals lingering (median 44d on market — plan ~5-8 weeks vacancy on turnover, expect pricing pressure); 60% of comp listings sitting > 30 days — soft ceiling on asking rent; 2,062 units permitted in Yavapai County in 2024 (98 in 5+ unit buildings).
Forward outlook
- Local home prices are declining (-3.0%/yr); year-one equity from $1k of loan paydown is wiped out by about $5k of value loss. Plan a longer hold.
- Yavapai County population projected at +10% by 2050 — modest demand growth; plan on rents tracking national, not racing it.
Negotiation context
- Only 6 days on market — expect competitive offers; lowballing is unlikely to land.
- 2 sale attempts with the ask held roughly flat each time — persistent listings suggest the price (not the market) is what's stuck; bring a comps-based counter.
Risks & watch-outs
- Climate carrying-cost: moderate wildfire risk; extreme-heat days projected 7→20/yr by 2055 (HVAC capex compounding) — expect insurance premiums to compound above CPI over the hold.
Questions for the listing agent
- Is there a deadline driving the sale (1031 exchange, divorce, estate, relocation)? That informs how much negotiation room exists.
- Schools are D-rated, which usually means shorter tenancies and higher turnover. Who's the typical renter profile here, and what's been the actual vacancy rate?
- What's the average days-on-market for RENTAL listings here right now (not sales)? A rising rental-DOM trend means longer vacancies and softer asking-rent achievability than the comps imply.
- What's the recent tenant-quality profile in this submarket — average credit score on applications, eviction rate, late-payment / NSF rate, and stable-employment percentage? A property-management company in the area should have these aggregated.
- How much new for-sale + rental construction is in the pipeline within 1–3 miles? Heavy new supply typically softens prices + rents 12–24 months out; constrained supply supports both.
Investment metrics
- 1% rule
- 1.06% ✓
- Cap rate
- 8.10%
- Cash-on-cash
- 6.44%
- DSCR
- 1.29
- GRM
- 7.8
CMA / ARV
- ARV (on-the-fly)
- $174,800
- Comps found
- 9
Show comp detail 9 sales within ~0.75 mi
| Address | Dist | Beds/Ba | Sqft | Sold | Price | $/sf | Match |
|---|---|---|---|---|---|---|---|
| 1078 W Rustic Pine Rd | 0.05mi | 2/2.0 | 920 (0%) | 0mo | $198,327 | $216 | 97 |
| 983 W Thorton Rd | 0.09mi | 2/2.0 | 920 (0%) | 8mo | $215,000 | $234 | 89 |
| 1145 Thorton Rd | 0.10mi | 2/2.0 | 920 (0%) | 8mo | $164,000 | $178 | 88 |
| 1072 W Rustic Pine Rd | 0.03mi | 2/2.0 | 920 (0%) | 14mo | $188,009 | $204 | 87 |
| 1007 W Thorton Rd | 0.15mi | 2/2.0 | 920 (0%) | 11mo | $166,000 | $180 | 84 |
| 1082 W Rustic Pine Rd | 0.03mi | 2/2.0 | 920 (0%) | 22mo | $175,230 | $190 | 80 |
| 999 Thorton Rd #21 | 0.13mi | 2/2.0 | 920 (0%) | 22mo | $191,000 | $208 | 76 |
| 723 W Finnie Flat Rd #65 | 0.25mi | 2/2.0 | 896 (-3%) | 18mo | $49,500 | $55 | 70 |
| 723 Finnie Flat Rd | 0.31mi | 3/2.0 (+1) | 1,056 (+15%) | 20mo | $100,000 | $95 | 39 |
Match score weights: distance 35% · size 25% · config 20% · recency 20%. Top-matched comps best support the ARV.
Projected returns pro-forma
-3.0% appreciation · 3.0% rent growth · sell at horizon
- IRR
- -6.4%
- Equity multiple
- 0.76×
- Total profit
- $-10,597
- Equity at exit
- $23,857
- IRR
- 3.3%
- Equity multiple
- 1.24×
- Total profit
- $10,584
- Equity at exit
- $13,834
Cash invested: $44,800 (down + closing). Projections, not guarantees.
Landlord ↔ Tenant lean methodology
- Overall (STATE)
- 87 Strongly Landlord-Friendly
- State Arizona
- 87 Strongly Landlord-Friendly · R+3
- County
- — inherits STATE
- City
- — inherits STATE
ZIP-level market 86322
- Home prices YoY
- -8.6%
- Active inventory
- 140
- Price-to-rent
- 7.8×
Monthly cashflow live
- Estimated rent
- $1,704 high interval (Pro) →
- Mortgage (P&I)
- −$839
- Tax est. 1.5%
- −$200 /mo · $2,400/yr
- Insurance
- −$67
- HOA
- −$0
- Vacancy / Maint / Mgmt
- −$358
- Net cashflow
- $240
Break-even live
UW: 25.0% down · 7.5% · 30yr · 1.5% tax · 5.0% vac · 8.0% maint · 8.0% mgmt
Financing live
Cash to close
- Down payment
- $40,000
- Closing costs
- $4,800
- Reserves months
- —
- Total cash needed
- —
Loan-product check · same deal, 3 products live
Conventional
25% down · 7.5% · 30yr
- Down + closing
- —
- Monthly P&I
- —
- Monthly cashflow
- —
- DSCR
- —
- Eligible?
- —
Personal DTI + credit; lowest rate.
DSCR
20% down · 8.5% · 30yr
- Down + closing
- —
- Monthly P&I
- —
- Monthly cashflow
- —
- DSCR
- —
- Eligible?
- —
No personal income docs; deal must DSCR.
Hard money
10% down · 12.0% · 12mo
- Down + closing
- —
- Monthly P&I
- —
- Monthly cashflow
- —
- DSCR
- —
- Eligible?
- —
Short-term bridge; refi at stabilization.
Rent comps 5 comps
| Address | Beds | Baths | Sqft | Rent | $/sqft | DOM | Units | Dist |
|---|---|---|---|---|---|---|---|---|
| 1064 W Rustic Pine Rd Camp Verde, AZ | 2.0 | 2.0 | 937 | $1,783 | $1.90 | 43d | 1 | 0.07mi |
| 365 N Homestead Pkwy Camp Verde, AZ | 1.0–3.0 | 1.0–2.0 | 1070 | $2,175 | $2.03 | 13d | 1 | 0.49mi |
| 357 Cliffs Pkwy Apt J Camp Verde, AZ | 2.0 | 1.0 | 898 | $1,455 | $1.62 | 43d | 1 | 0.58mi |
| 142 W Maryvale Dr Camp Verde, AZ | 2.0 | 2.0 | 890 | $1,405 | $1.58 | 43d | 1 | 0.91mi |
| 499 S 2nd St Camp Verde, AZ | 2.0 | 1.0 | 950 | $1,505 | $1.58 | 13d | 1 | 1.00mi |
Listing history 6 events
-
2026-06-18days on market $160,000 Active 6 DOM
-
2026-06-17days on market $160,000 Active 5 DOM
-
2026-06-16days on market $160,000 Active 4 DOM
-
2026-06-15days on market $160,000 Active 3 DOM
-
2026-06-13remarks 699-char remark
-
2026-06-13$160,000 Active 1 DOM
ⓘ Source: listings_history table (triggers on properties + properties_extension) + one-shot
backfill from property_details.listing_events for pre-trigger history.
Climate risk First Street
- Flood 1/10 Low FEMA zone X (unshaded) · 0% chance over 30 yrs
- Wildfire 5/10 Major
- Heat 7/10 Severe 7 d/yr ≥104°F today · 20 d/yr by 30 yrs out
- Wind 1/10 Low
- Air quality 1/10 Low 0 unhealthy d/yr today · 0 by 30 yrs out
Nearby sold comps map
Loading sold comps map…
Walkable amenities ~0.75 mi
Loading nearby amenities…
Taxation est. · year 1
- Rental income
- $20,446
- − Mortgage interest
- −$8,962
- − Property taxes
- −$2,400
- − Insurance
- −$800
- − Repairs & maintenance
- −$1,636
- − Management
- −$1,636
- − Depreciation
- −$4,655
- Taxable income
- $357
- Est. tax owed @ 24.0%
- −$86
- After-tax cash flow
- $2,798/yr
For passive investors: Depreciation is non-cash, so a rental often shows a tax loss while cash-flowing — sheltering income. Rental losses are passive: they offset passive income freely, and up to $25,000/yr can offset ordinary (W-2) income if you actively participate and your MAGI is under $100k (phasing out to $0 by $150k); unused losses carry forward. On sale, claimed depreciation is recaptured at up to 25%, and gains may owe capital-gains tax (a 1031 exchange can defer both). Figures are a year-1 estimate at your 24.0% rate — not tax advice; consult a CPA.
Schools (NCES district)
- District
- Camp Verde Unified District (4470)
- NCES district ID
- 0401600
- Math proficiency
- 20% ▼ -6.00%
- Reading proficiency
- 25% ▼ -5.00%
- Median HH income
- $39,042
- Composite
- 18.92/100
- National rank
- #8856
- State rank
- #176 of 249 in AZ
Livability — Camp Verde
- Score
- 66/100
- State rank
- #77
- US rank
- #12185
Category grades
Schools grade is shown separately in the Schools card above.
Census & demographics
- Census place
- Camp Verde, AZ
- County
- Yavapai County · 190,406 people
- City population
- 13,020
- Metro
- Prescott Valley-Prescott, AZ
- Population (ZIP)
- 13,020
- Household income
- $69,411
- Rent vs Own
- Severe rent burden
- 215.0
Population outlook (Yavapai County) Hauer SSP2
- Today (2025)
- 241,389 people
- By 2030
- 249,523 · +3.4%
- By 2040
- 259,966 · +7.7%
- By 2050
- 264,736 · +9.7%
- By 2075
- 269,334 · +11.6%
- By 2100
- 256,505 · +6.3%
Race, ethnicity, and origin ACS 2023
- Neighborhood character
- Predominantly White (72%)
- Race & ethnicity
- White 72% Hispanic / Latino 16% Native American 9% Two or more races 6%
- Hispanic origin (detail)
- Mexican 12%
- Common ancestry
- Portuguese 4% Serbian 3% Slovak 3%
- Foreign-born
- 5% · Canada
- Languages at home
- 88% English-only · Spanish 10%
Political lean MEDSL · Yavapai
- 2024 margin
- Solid R (+33.9) · D 32.6% · R 66.5%
- 2008→2024 swing
- -9.5pp toward R · 2008: -24.4pp · 2024: -33.9pp
- All cycles
- 2024: R+33.9 2020: R+29.3 2016: R+31.4 2012: R+30.7 2008: R+24.4
Not yet ingested
- Civics
- —
Market trends
- HPI YoY
- ▼ -39.38%
- Current HPI
- 419.2107
- Rent YoY
- —
- Metro
- Prescott Valley-Prescott, AZ
- State GDP YoY
- ▲ 4.54%
- F500 in state
- 20
Industry mix (Fortune 500 HQ in AZ)
| Industry | F500 HQs | Revenue |
|---|---|---|
| Technology | 2 | $13B |
|
||
| Mining / Metals | 1 | $23B |
|
||
| Environmental Services | 1 | $16B |
|
||
| Metals / Steel | 1 | $14B |
|
||
| Technology Distribution | 1 | $9B |
|
||
| Homebuilding | 1 | $8B |
|
||
Price history
+0.0% since first listed2 events — show timeline
- 2026-06-12 Listed $160,000 PAARMLS as Distributed by MLS Grid
- 2026-06-12 Listed $160,000 ARMLS
Cash-flow waterfall
monthlySold comps — $/sqft
last 12 mo · ≤1 miLoading sold comps…