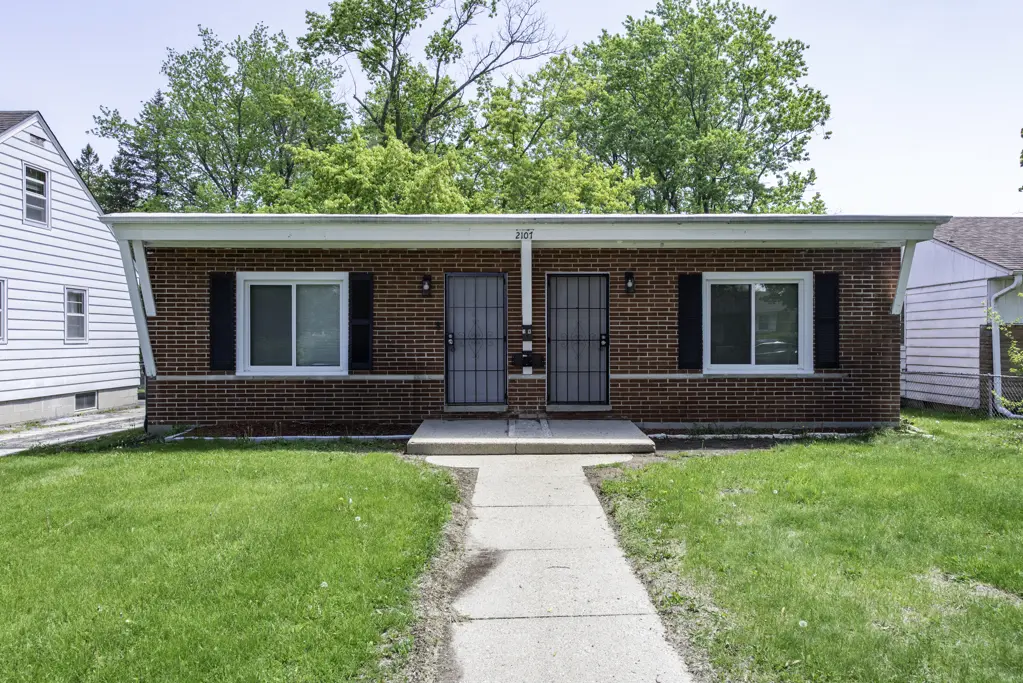
 Duplex
2107 Elim Ave · Zion, IL
Flood risk 1/10 · Minimal
- FEMA flood zone
- X (unshaded)
- Chance of flooding over 30 yrs
- 0.0%
- Est. flood insurance / yr
- $507 – $1,088
Fire risk 3/10 · Minor
- Est. fire insurance / yr
- $804 – $1,492
Heat risk 2/10 · Minimal
- Hot days now (above 95°F)
- 7 days/yr
- Hot days in 30 yrs
- 13 days/yr
Wind risk 2/10 · Minimal
- Chance of severe wind over 30 yrs
- —
Air-quality risk 3/10 · Minor
- Unhealthy air days now
- 3 days/yr
- Unhealthy air days in 30 yrs
- 3 days/yr
Risk factors via First Street. Map © Google.
Why this score? — see what drove the D- grade
The composite is a weighted blend of 9 inputs, each scored 0–100. Each bar is that input's sub-score; the figure is the points it added to the 100-point composite (weight × sub-score).
- Cash flow +12.4/30.0
- ARV discount +7.5/15.0
- 1% rule +4.3/10.0
- DSCR +3.7/10.0
- Livability +3.6/5.0
- Rent growth +2.5/5.0
- Condition / age +2.5/5.0
- Schools +1.2/10.0
- Appreciation +0.0/10.0
$239,000
🖨 Deal sheet 📄 Offer letter ✓ Due diligence
Multi-family units
County records classify this as Multi-Family (2-4 Unit). Listing-text estimate: 2 units. confirmed
Listing remarks
Welcome to this beautifully maintained side by side brick duplex perfectly situated in a desirable neighborhood. each unit features a comfortable one bedroom layout complete with cozy living room and inviting eating space ideal for entertaining or relaxing after a long day unit 1 showcasing elegant brown laminate wood flooring that add warm character to the space. Unit 2 featuring sleek gray laminate flooring throughout, offering a modern touch and easy maintenance. Both units benefit from abundant natural light, creating a bright and airy atmosphere. The spacious backyard is a standout feature providing ample room for entertaining outdoor activities gardening or simply enjoying the fr
Key facts
- Cozy living room
- One bedroom layout
- 6 parking spots
Tags
Property features AI
Finance
- Financial info: Special service area: No; Property listed as income-producing with two rented units (each unit rents for $1,000/month); Security deposit listed as $1,000 per unit; Current leases through July 1, 2026 and August 1, 2026
Exterior
- Parking: Off-street parking (off alley); 6 total parking spaces
- Utilities: Water from Lake Michigan and public supply; Public sewer
- Home design: Two-to-four unit building (2 units total); Fee simple ownership; One story (each unit located on first floor); Brick construction
- Construction: Built approximately 61–70 years ago; Built before 1978; Brick construction
- Exterior features: Access to commuter bus and train, interstate access; School bus service
Interior
- Kitchen: Each unit includes a stove and refrigerator
- Bedrooms: Two 1-bedroom units (each unit on first floor)
- Bathrooms: Each unit has 1 full bathroom (2 full baths total)
- Heating & cooling: Natural gas forced-air heating
- Interior features: 8 total rooms; Crawl space basement
- Laundry & utility: Tenants responsible for electric, gas, and heat
Neighborhood map
What this means for you Summary
Snapshot
- This is a 2 × 1-bed/1.0-bath units multifamily listed at $239k.
Deal economics
- At list price, monthly cash flow is $-38 ($-460/yr) — negative. Per door: $-19/mo.
- To cash-flow at today's rent, offer at most $232k (2.8% below list).
- To meet the 1% rule (rent ≥ 1% of price), the offer needs to be $223k (6.9% below list).
- Recommended offer: $223k (6.9% below list) — sets the bar for 1% rule.
- Cap rate 6.1% vs local median 3.8% in Zion — top-decile yield for the area; either an underpriced asset or a hidden risk that comps aren't pricing in. Stress-test before assuming the spread holds.
Location & tenants
- Location reads 71/100 on livability (#353 in IL) — a middle-class / working-renter tenant base. Strengths: cost of living A+, housing A+, health & safety A+; Watch: crime C-, employment C-, commute D+.
- Zion-Benton Twp Hsd 126 (suburban): math 9% / reading 16% proficiency, ranked #531 of 620 in IL (top 86%) — low school quality limits family demand, transient renter base, plan for 1-2y turnover.
- Market conditions: 64 active listings in the ZIP; 7 comparable units currently listed for rent nearby; rentals at typical pace (median 15d on market — plan ~3-4 weeks tenant-placement turnaround); 948 units permitted in Lake County in 2024 (424 in 5+ unit buildings).
- This rent runs 40% of the median local income ($66k/yr) — at the standard rent-burdened threshold; future hikes will face affordability resistance.
Forward outlook
- Local home prices are declining (-3.0%/yr); year-one equity from $2k of loan paydown is wiped out by about $7k of value loss. Plan a longer hold.
- Lake County population projected to shrink 8% by 2050 — rents likely to lag national; underwrite the cash flow, not the appreciation.
Negotiation context
- Only 8 days on market — expect competitive offers; lowballing is unlikely to land.
- Current owner paid $130k; list at $239k implies a 84% gain — meaningful room to come down on a strong offer.
Risks & watch-outs
- Watch-outs: built in 1956 — expect roof / HVAC / electrical / plumbing capex.
Questions for the listing agent
- What do current leases actually rent for vs. the listed asking? Can we see a recent rent roll and the last 12 months of T-12 income?
- Can we see the unit-by-unit rent roll, current vacancy, and any below-market leases? What's the average tenancy length?
- What capital expenditures (roof, boiler, parking lot, exteriors) have been made in the last 5 years, and what's planned in the next 2?
- Built in 1956 — when were the roof, HVAC, electrical panel, plumbing, and water heater last replaced?
- Is there a deadline driving the sale (1031 exchange, divorce, estate, relocation)? That informs how much negotiation room exists.
- Schools are F-rated, which usually means shorter tenancies and higher turnover. Who's the typical renter profile here, and what's been the actual vacancy rate?
- The area grade is low — what's the realistic commute time and amenity access for the typical tenant pool here? Any planned neighborhood developments (good or bad) we should know about?
- What's the average days-on-market for RENTAL listings here right now (not sales)? A rising rental-DOM trend means longer vacancies and softer asking-rent achievability than the comps imply.
- What's the recent tenant-quality profile in this submarket — average credit score on applications, eviction rate, late-payment / NSF rate, and stable-employment percentage? A property-management company in the area should have these aggregated.
- How much new apartment / multifamily construction is in the pipeline within 1–3 miles? Heavy new supply (>2% of stock underway) typically softens rents 12–24 months out; light construction supports rent growth.
Investment metrics
- 1% rule
- 0.93% ✗
- Cap rate
- 6.10%
- Cash-on-cash
- -0.69%
- DSCR
- 0.97
- GRM
- 8.9
CMA / ARV
No comps found within radius.
Projected returns pro-forma
-3.0% appreciation · 3.0% rent growth · sell at horizon
- IRR
- -17.4%
- Equity multiple
- 0.39×
- Total profit
- $-41,045
- Equity at exit
- $35,636
- IRR
- -9.3%
- Equity multiple
- 0.43×
- Total profit
- $-38,383
- Equity at exit
- $20,664
Cash invested: $66,920 (down + closing). Projections, not guarantees.
Landlord ↔ Tenant lean methodology
- Overall (STATE)
- 43 Moderately Tenant-Leaning
- State Illinois
- 43 Moderately Tenant-Leaning · D+7
- County
- — inherits STATE
- City
- — inherits STATE
ZIP-level market 60099
- Home prices YoY
- -32.5%
- Active inventory
- 64
- Price-to-rent
- 17.9×
Monthly cashflow live
- Estimated rent
- $2,226 medium interval (Pro) →
- Mortgage (P&I)
- −$1,253
- Tax from tax record
- −$444 /mo · $5,327/yr
- Insurance
- −$100
- HOA
- −$0
- Vacancy / Maint / Mgmt
- −$467
- Net cashflow
- $-38
Break-even live
2-unit breakdown (identical units grouped — click to expand)
| Units | Beds | Baths | Est. rent |
|---|---|---|---|
| 2× units | 1 | 1 | $2,226 |
| #1 | 1 | 1 | $1,113 |
| #2 | 1 | 1 | $1,113 |
| Total (2 units) | $2,226 | ||
UW: 25.0% down · 7.5% · 30yr · 1.5% tax · 5.0% vac · 8.0% maint · 8.0% mgmt
Financing live
Cash to close
- Down payment
- $59,750
- Closing costs
- $7,170
- Reserves months
- —
- Total cash needed
- —
Loan-product check · same deal, 3 products live
Conventional
25% down · 7.5% · 30yr
- Down + closing
- —
- Monthly P&I
- —
- Monthly cashflow
- —
- DSCR
- —
- Eligible?
- —
Personal DTI + credit; lowest rate.
DSCR
20% down · 8.5% · 30yr
- Down + closing
- —
- Monthly P&I
- —
- Monthly cashflow
- —
- DSCR
- —
- Eligible?
- —
No personal income docs; deal must DSCR.
Hard money
10% down · 12.0% · 12mo
- Down + closing
- —
- Monthly P&I
- —
- Monthly cashflow
- —
- DSCR
- —
- Eligible?
- —
Short-term bridge; refi at stabilization.
Rent comps 7 comps
| Address | Beds | Baths | Sqft | Rent | $/sqft | DOM | Units | Dist |
|---|---|---|---|---|---|---|---|---|
| 2101 Eshcol Ave Zion, IL | 3.0 | 2.0 | 1268 | $2,300 | $1.81 | 1d | 1 | 0.41mi |
| 2024 20th St Zion, IL | 3.0 | 1.0 | 1053 | $2,250 | $2.14 | 20d | 1 | 0.90mi |
| 2200 Hebron Ave Unit D Zion, IL | 3.0 | 1.5 | 1268 | $1,700 | $1.34 | 15d | 1 | 1.22mi |
| 2200 Hebron Ave Zion, IL | 3.0 | 1.0 | 1268 | $1,700 | $1.34 | 15d | 1 | 1.22mi |
| 2204 Hebron Ave Unit B Zion, IL | 3.0 | 1.0 | 1268 | $1,700 | $1.34 | 15d | 1 | 1.22mi |
| 2932 Bethel Blvd Zion, IL | 3.0 | 2.0 | 1240 | $2,100 | $1.69 | 16d | 1 | 1.23mi |
| 3004 Ezra Ave Zion, IL | 3.0 | 1.0 | 1000 | $2,340 | $2.34 | 1d | 1 | 1.37mi |
Listing history 7 events
-
2026-06-18days on market $239,000 Active 8 DOM
-
2026-06-17days on market $239,000 Active 7 DOM
-
2026-06-16days on market $239,000 Active 6 DOM
-
2026-06-15days on market $239,000 Active 5 DOM
-
2026-06-13days on market $239,000 Active 3 DOM
-
2026-06-13remarks 699-char remark
-
2026-06-13$239,000 Active 2 DOM
ⓘ Source: listings_history table (triggers on properties + properties_extension) + one-shot
backfill from property_details.listing_events for pre-trigger history.
Tax reassessment forecast IL · Partial reset (capped growth)
- Current annual tax
- $5,327 · $444/mo
- Projected year-2 tax
- $5,376 · $448/mo
- Expected delta
- +$49/yr (+$4/mo · 0.9%)
ⓘ Screening estimate from a state-policy table — verify with the county assessor before closing.
Climate risk First Street
- Flood 1/10 Low FEMA zone X (unshaded) · 0% chance over 30 yrs
- Wildfire 3/10 Moderate
- Heat 2/10 Low 7 d/yr ≥95°F today · 13 d/yr by 30 yrs out
- Wind 2/10 Low
- Air quality 3/10 Moderate 3 unhealthy d/yr today · 3 by 30 yrs out
Nearby sold comps map
Loading sold comps map…
Walkable amenities ~0.75 mi
Loading nearby amenities…
Taxation est. · year 1
- Rental income
- $26,712
- − Mortgage interest
- −$13,388
- − Property taxes
- −$5,327
- − Insurance
- −$1,195
- − Repairs & maintenance
- −$2,137
- − Management
- −$2,137
- − Depreciation
- −$6,953
- Taxable loss
- −$4,424
- Est. tax savings @ 24.0%
- +$1,062
- After-tax cash flow
- $602/yr
For passive investors: Depreciation is non-cash, so a rental often shows a tax loss while cash-flowing — sheltering income. Rental losses are passive: they offset passive income freely, and up to $25,000/yr can offset ordinary (W-2) income if you actively participate and your MAGI is under $100k (phasing out to $0 by $150k); unused losses carry forward. On sale, claimed depreciation is recaptured at up to 25%, and gains may owe capital-gains tax (a 1031 exchange can defer both). Figures are a year-1 estimate at your 24.0% rate — not tax advice; consult a CPA.
Schools (NCES district)
- District
- Zion-Benton Twp Hsd 126
- NCES district ID
- 1743890
- Math proficiency
- 9% ▼ -6.00%
- Reading proficiency
- 16% ▼ -8.00%
- Median HH income
- $56,473
- Composite
- 12.29/100
- National rank
- #9644
- State rank
- #531 of 620 in IL
Livability — Zion
- Score
- 71/100
- State rank
- #353
- US rank
- #7264
Category grades
Schools grade is shown separately in the Schools card above.
Census & demographics
- Census place
- Zion, IL
- County
- Lake County · 591,991 people
- City population
- 30,881
- Metro
- Chicago-Naperville-Elgin, IL-IN-WI
- Population (ZIP)
- 30,881
- Household income
- $66,109
- Rent vs Own
- Severe rent burden
- 1009.0
Population outlook (Lake County) Hauer SSP2
- Today (2025)
- 700,217 people
- By 2030
- 693,290 · -1.0%
- By 2040
- 673,588 · -3.8%
- By 2050
- 643,556 · -8.1%
- By 2075
- 562,792 · -19.6%
- By 2100
- 457,715 · -34.6%
Race, ethnicity, and origin ACS 2023
- Neighborhood character
- Diverse neighborhood (Simpson 0.70)
- Race & ethnicity
- Hispanic / Latino 40% White 29% Black 23% Two or more races 17% Asian 2% Native American 1%
- Hispanic origin (detail)
- Mexican 30% Puerto Rican 4% Dominican 2%
- Common ancestry
- Romanian 2% Lithuanian 2% Portuguese 1%
- Foreign-born
- 17% · Canada
- Languages at home
- 66% English-only · Spanish 30% Tagalog/Filipino 2%
Political lean MEDSL · Lake
- 2024 margin
- Strong D (+20.8) · D 59.7% · R 38.9% · Other 1.4%
- 2008→2024 swing
- +1.1pp toward D · 2008: 19.6pp · 2024: 20.8pp
- All cycles
- 2024: D+20.8 2020: D+24.1 2016: D+20.3 2012: D+8.1 2008: D+19.6
Not yet ingested
- Civics
- —
Market trends
- HPI YoY
- ▼ -106.90%
- Current HPI
- 222.3484
- Rent YoY
- —
- Metro
- Chicago-Naperville-Elgin, IL-IN-WI
- State GDP YoY
- ▲ 1.59%
- F500 in state
- 60
Industry mix (Fortune 500 HQ in IL)
| Industry | F500 HQs | Revenue |
|---|---|---|
| Insurance | 4 | $201B |
|
||
| Consumer Goods | 4 | $87B |
|
||
| Industrial Machinery | 3 | $64B |
|
||
| Healthcare | 2 | $55B |
|
||
| Retail / Pharmacy | 1 | $148B |
|
||
| Agriculture / Food | 1 | $86B |
|
||
Price history
+83.8% since first listed2 events — show timeline
- 2026-06-09 Listed $239,000 MRED as Distributed by MLS Grid
- 2006-11-28 Sold (Public Records) $130,000 Public Records
Property tax history
+1.6%/yrLatest (2024): $5,327 · +2.9% YoY. Source: county tax records.
Cash-flow waterfall
monthlySold comps — $/sqft
last 12 mo · ≤1 miLoading sold comps…