323 Oldfield Dr · Charlottesville, VA
Flood risk No data
- FEMA flood zone
- —
- Chance of flooding over 30 yrs
- —
- Est. flood insurance / yr
- —
Fire risk No data
- Est. fire insurance / yr
- —
Heat risk No data
- Hot days now (above threshold)
- —
- Hot days in 30 yrs
- —
Wind risk No data
- Chance of severe wind over 30 yrs
- —
Air-quality risk No data
- Unhealthy air days now
- —
- Unhealthy air days in 30 yrs
- —
Risk factors via First Street. Map © Google.
Why this score? — see what drove the D grade
The composite is a weighted blend of 9 inputs, each scored 0–100. Each bar is that input's sub-score; the figure is the points it added to the 100-point composite (weight × sub-score).
- Cash flow +11.7/30.0
- Schools +5.8/10.0
- ARV discount +4.8/15.0
- Livability +4.2/5.0
- Condition / age +4.0/5.0
- 1% rule +3.4/10.0
- DSCR +3.4/10.0
- Rent growth +3.1/5.0
- Appreciation +0.0/10.0
$320,840
🖨 Deal sheet (PDF) 📄 Offer letter ✓ Due diligence
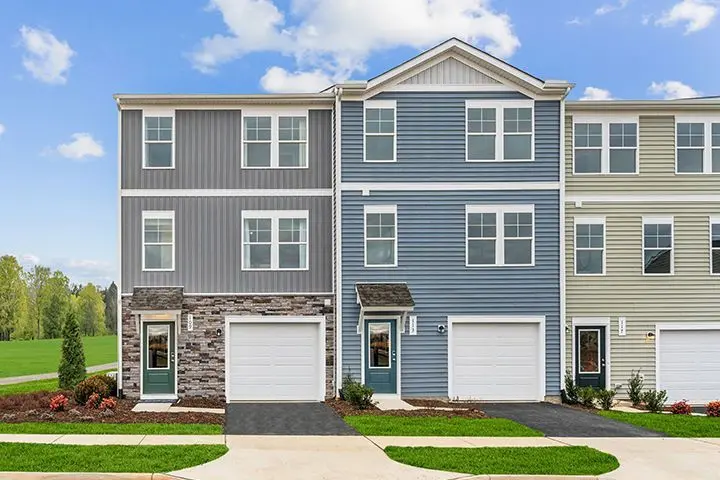
Listing remarks
Discover the Piper at Essence at Colonial Circle Townhomes, a new townhome neighborhood with walking trails, recreation fields, and low-maintenance living near outdoor recreation. This move-in ready Piper spans 1,800 square feet across three levels, with three bedrooms, two full baths, a powder room, and a one-car front-load garage. The main living level brings the kitchen, dining, and living areas together in one open run, finished with linen cabinetry, Frost White quartz countertops, a four-inch backsplash, and stainless GE appliances. Upstairs, two bedrooms share a full bath, while the primary suite sits at the back of the level with a walk-in closet and its own bath. A deck off the main
Key facts
- Privacy fence
- Composite deck
- Garage
Tags
Property features AI
Finance
- Financial info: List price $320,840
Exterior
- Parking: 1-car garage (1 parking space total)
- Home design: Single-family property (Spec); Active listing
- Exterior features: Address: 323 Oldfield Dr, Charlottesville, VA 22902
Interior
- Bedrooms: 4 bedrooms
- Bathrooms: 3 full bathrooms and 1 half bathroom (3.5 total)
- Interior features: Spec home built as The Piper plan; Living area approximately 1,800
Neighborhood map
What this means for you Summary
Snapshot
- This is a 4-bed/3.5-bath townhouse listed at $321k. Condition is rated good.
Deal economics
- At list price, monthly cash flow is $-96 ($-1k/yr) — negative.
- To cash-flow at today's rent, offer at most $307k (4.3% below list).
- To meet the 1% rule (rent ≥ 1% of price), the offer needs to be $269k (16.3% below list).
- Recommended offer: $269k (16.3% below list) — sets the bar for 1% rule.
- Cap rate 5.9% vs local median 2.9% in Charlottesville — top-decile yield for the area; either an underpriced asset or a hidden risk that comps aren't pricing in. Stress-test before assuming the spread holds.
Location & tenants
- Location reads 84/100 on livability (#27 in VA, #707 nationally) — a professional / high-income tenant draw. Strengths: amenities A+, commute A+, health & safety A+; Watch: cost of living D, crime D-.
- Fluvanna County Public School District (rural): math 61% / reading 71% proficiency, ranked #34 of 131 in VA (top 26%) — acceptable for families but not a draw, mixed tenant base, ~2y average lease.
- Zoned schools: Central Elementary (715 students, 52% FRL); Fluvanna Middle (math 65% / reading 70%, grade A-, #98 of 342 statewide, top 30%, 763 students, 42% FRL); Fluvanna County High (math 60% / reading 76%, grade B, #180 of 319 statewide, top 57%, 1,488 students, 37% FRL) — zoned schools average 44% FRL vs 23% district-wide (21 pts higher); higher-poverty schools than district average — tighter screening recommended.
- Market conditions: Rents rising (+2.5%/yr); 278 active listings in the ZIP; 1 comparable units currently listed for rent nearby; solid renter incomes; 138 units permitted in Fluvanna County in 2024 (6 in 5+ unit buildings).
- This rent runs 34% of the median local income ($93k/yr) — at the standard rent-burdened threshold; future hikes will face affordability resistance.
Forward outlook
- Local home prices are declining (-3.0%/yr); year-one equity from $2k of loan paydown is wiped out by about $10k of value loss. Plan a longer hold.
Negotiation context
- Only 11 days on market — expect competitive offers; lowballing is unlikely to land.
Questions for the listing agent
- What do current leases actually rent for vs. the listed asking? Can we see a recent rent roll and the last 12 months of T-12 income?
- Is there a deadline driving the sale (1031 exchange, divorce, estate, relocation)? That informs how much negotiation room exists.
- Schools are A-rated — typically a magnet for longer-tenancy family renters. What's the average tenant stay here, and is there a school-zone premium baked into asking?
- Crime grade is D in this area — have there been break-ins, vandalism, or insurance claims at this property in the last 3 years? What carrier currently insures it and at what premium?
- The area grade is low — what's the realistic commute time and amenity access for the typical tenant pool here? Any planned neighborhood developments (good or bad) we should know about?
- What's the average days-on-market for RENTAL listings here right now (not sales)? A rising rental-DOM trend means longer vacancies and softer asking-rent achievability than the comps imply.
- What's the recent tenant-quality profile in this submarket — average credit score on applications, eviction rate, late-payment / NSF rate, and stable-employment percentage? A property-management company in the area should have these aggregated.
- How much new for-sale + rental construction is in the pipeline within 1–3 miles? Heavy new supply typically softens prices + rents 12–24 months out; constrained supply supports both.
Investment metrics
- 1% rule
- 0.84% ✗
- Cap rate
- 5.94%
- Cash-on-cash
- -1.28%
- DSCR
- 0.94
- GRM
- 10.0
CMA / ARV
- ARV (on-the-fly)
- $302,400
- Comps found
- 12
Show comp detail 12 sales within ~0.75 mi
| Address | Dist | Beds/Ba | Sqft | Sold | Price | $/sf | Match |
|---|---|---|---|---|---|---|---|
| 99 Oldfield Dr | 0.18mi | 4/3.5 | 1,800 (0%) | 3mo | $297,490 | $165 | 89 |
| 55 Laurin St #32 | 0.11mi | 4/3.5 | 1,866 (+4%) | 0mo | $315,585 | $169 | 89 |
| 103 Oldfield Dr | 0.18mi | 4/3.5 | 1,814 (+1%) | 3mo | $299,990 | $165 | 88 |
| 97 Oldfield Dr | 0.19mi | 4/3.5 | 1,814 (+1%) | 3mo | $314,035 | $173 | 87 |
| 130 Saxon St Lot 73 | 0.13mi | 4/3.5 | 1,866 (+4%) | 1mo | $312,590 | $168 | 87 |
| 43 Laurin St Lot 30 | 0.13mi | 4/3.5 | 1,866 (+4%) | 2mo | $311,990 | $167 | 86 |
| 120 Saxon St | 0.16mi | 4/3.5 | 1,866 (+4%) | 1mo | $328,830 | $176 | 85 |
| 47 Laurin St #31 | 0.10mi | 3/2.5 (-1) | 1,800 (0%) | 2mo | $314,990 | $175 | 85 |
| 106 Saxon St #106 | 0.11mi | 3/3.0 (-1) | 1,833 (+2%) | 1mo | $299,990 | $164 | 84 |
| 114 Saxon St | 0.12mi | 3/2.5 (-1) | 1,800 (0%) | 4mo | $312,000 | $173 | 83 |
| 41 Laurin St #29 | 0.17mi | 3/3.0 (-1) | 1,833 (+2%) | 1mo | $289,990 | $158 | 82 |
| 110 Saxon St | 0.16mi | 3/3.0 (-1) | 1,866 (+4%) | 2mo | $299,000 | $160 | 78 |
Match score weights: distance 35% · size 25% · config 20% · recency 20%. Top-matched comps best support the ARV.
Projected returns pro-forma
-3.0% appreciation · 2.47% rent growth · sell at horizon
- IRR
- -19.0%
- Equity multiple
- 0.34×
- Total profit
- $-59,465
- Equity at exit
- $47,838
- IRR
- -12.6%
- Equity multiple
- 0.27×
- Total profit
- $-65,244
- Equity at exit
- $27,740
Cash invested: $89,835 (down + closing). Projections, not guarantees.
Landlord ↔ Tenant lean methodology
- Overall (STATE)
- 55 Moderately Landlord-Leaning
- State Virginia
- 55 Moderately Landlord-Leaning · D+2
- County
- — inherits STATE
- City
- — inherits STATE
ZIP-level market 22902
- Rents YoY
- 2.5%
- Active inventory
- 278
- Price-to-rent
- 10.0×
Monthly cashflow live
- Estimated rent
- $2,686 medium interval (Pro) →
- Mortgage (P&I)
- −$1,683
- Tax est. 1.5%
- −$401 /mo · $4,813/yr
- Insurance
- −$134
- HOA
- −$0
- Vacancy / Maint / Mgmt
- −$564
- Net cashflow
- $-96
Break-even live
Sensitivity live
| Price | -10% $126 | -5% $15 | +0% $-96 | +5% $-206 | +10% $-317 |
|---|---|---|---|---|---|
| Rent | -10% $-308 | -5% $-202 | +0% $-96 | +5% $10 | +10% $117 |
| Rate | -1.0pp $66 | -0.5pp $-14 | base $-96 | +0.5pp $-179 | +1.0pp $-263 |
UW: 25.0% down · 7.5% · 30yr · 1.5% tax · 5.0% vac · 8.0% maint · 8.0% mgmt
Financing live
Cash to close
- Down payment
- $80,210
- Closing costs
- $9,625
- Reserves months
- —
- Total cash needed
- —
Loan-product check · same deal, 3 products live
Conventional
25% down · 7.5% · 30yr
- Down + closing
- —
- Monthly P&I
- —
- Monthly cashflow
- —
- DSCR
- —
- Eligible?
- —
Personal DTI + credit; lowest rate.
DSCR
20% down · 8.5% · 30yr
- Down + closing
- —
- Monthly P&I
- —
- Monthly cashflow
- —
- DSCR
- —
- Eligible?
- —
No personal income docs; deal must DSCR.
Hard money
10% down · 12.0% · 12mo
- Down + closing
- —
- Monthly P&I
- —
- Monthly cashflow
- —
- DSCR
- —
- Eligible?
- —
Short-term bridge; refi at stabilization.
Rent comps 1 comps
| Address | Beds | Baths | Sqft | Rent | $/sqft | DOM | Units | Dist |
|---|---|---|---|---|---|---|---|---|
| 37 Laurin St Cunningham, VA | 4.0 | 3.5 | 1800 | $2,350 | $1.31 | 15d | 1 | 0.15mi |
Listing history 9 events
-
2026-06-21days on market $320,840 Active 11 DOM
-
2026-06-19days on market $320,840 Active 9 DOM
-
2026-06-18days on market $320,840 Active 8 DOM
-
2026-06-17days on market $320,840 Active 7 DOM
-
2026-06-16days on market $320,840 Active 6 DOM
-
2026-06-15days on market $320,840 Active 5 DOM
-
2026-06-14days on market $320,840 Active 3 DOM
-
2026-06-13remarks 699-char remark
-
2026-06-13$320,840 Active 2 DOM
ⓘ Source: listings_history table (triggers on properties + properties_extension) + one-shot
backfill from property_details.listing_events for pre-trigger history.
Nearby sold comps map
Loading sold comps map…
Walkable amenities ~0.75 mi
Loading nearby amenities…
Taxation est. · year 1
- Rental income
- $32,227
- − Mortgage interest
- −$17,972
- − Property taxes
- −$4,813
- − Insurance
- −$1,604
- − Repairs & maintenance
- −$2,578
- − Management
- −$2,578
- − Depreciation
- −$9,334
- Taxable loss
- −$6,652
- Est. tax savings @ 24.0%
- +$1,596
- After-tax cash flow
- $449/yr
For passive investors: Depreciation is non-cash, so a rental often shows a tax loss while cash-flowing — sheltering income. Rental losses are passive: they offset passive income freely, and up to $25,000/yr can offset ordinary (W-2) income if you actively participate and your MAGI is under $100k (phasing out to $0 by $150k); unused losses carry forward. On sale, claimed depreciation is recaptured at up to 25%, and gains may owe capital-gains tax (a 1031 exchange can defer both). Figures are a year-1 estimate at your 24.0% rate — not tax advice; consult a CPA.
Condition & rehab AI · 13 photos
This move-in ready townhome is in good condition with modern finishes and a well-maintained exterior. Minor updates to the exterior and interior could further enhance its value.
Value-add opportunities
- Both Painting exterior siding — Enhances curb appeal and value
- Both Landscaping improvements — Enhances curb appeal and value
- Both New flooring in bathrooms — Improves aesthetics and functionality
- Both New kitchen backsplash — Enhances aesthetics and functionality
Renovation cost estimate screening
Value-add ROI direction
- Both Painting exterior siding — Enhances curb appeal and value ↑
- Both Landscaping improvements — Enhances curb appeal and value ↑
- Both New flooring in bathrooms — Improves aesthetics and functionality ↑
- Both New kitchen backsplash — Enhances aesthetics and functionality ↑
ⓘ Cost ranges are severity-bucket heuristics (US national rule-of-thumb). Get contractor quotes + a written scope before underwriting a rehab budget.
Schools (NCES district)
- District
- Fluvanna County Public School District
- NCES district ID
- 5101380
- Math proficiency
- 61% ▼ -23.00%
- Reading proficiency
- 71% ▼ -4.00%
- Median HH income
- $66,601
- Composite
- 57.6/100
- National rank
- #1065
- State rank
- #34 of 131 in VA
Livability — Charlottesville
- Score
- 84/100
- State rank
- #27
- US rank
- #707
Category grades
Schools grade is shown separately in the Schools card above.
Census & demographics
- County
- Albemarle County · 129,350 people
- City population
- 120,202
- Metro
- Charlottesville, VA
- Population (ZIP)
- 23,486
- Household income
- $93,463
- Rent vs Own
- Severe rent burden
- 894.0
Population outlook (Fluvanna County) Hauer SSP2
- Today (2025)
- 27,237 people
- By 2030
- 27,607 · +1.4%
- By 2040
- 28,075 · +3.1%
- By 2050
- 28,019 · +2.9%
- By 2075
- 28,058 · +3.0%
- By 2100
- 26,124 · -4.1%
Race, ethnicity, and origin ACS 2023
- Neighborhood character
- Predominantly White (69%)
- Race & ethnicity
- White 69% Black 11% Hispanic / Latino 11% Two or more races 6% Asian 5%
- Hispanic origin (detail)
- Mexican 7%
- Common ancestry
- Italian 5% Lithuanian 3% Slovak 2%
- Foreign-born
- 12% · Canada, China
- Languages at home
- 84% English-only · Spanish 8% Other Indo-European 3% Other Asian/Pacific 1%
Political lean MEDSL · Fluvanna
- 2024 margin
- Lean R (+6.3) · D 46.4% · R 52.6% · Other 1.0%
- 2008→2024 swing
- -4.4pp toward R · 2008: -1.8pp · 2024: -6.3pp
- All cycles
- 2024: R+6.3 2020: R+4.7 2016: R+9.4 2012: R+6.2 2008: R+1.8
Not yet ingested
- Civics
- —
Market trends
- HPI YoY
- ▼ -372.57%
- Current HPI
- 295.9918
- Rent YoY
- ▲ 2.47%
- Metro
- Charlottesville, VA
- State GDP YoY
- ▲ 2.40%
- F500 in state
- 50
Industry mix (Fortune 500 HQ in VA)
| Industry | F500 HQs | Revenue |
|---|---|---|
| Aerospace / Defense | 4 | $236B |
|
||
| Technology / Defense | 3 | $32B |
|
||
| Financial Services | 2 | $176B |
|
||
| Utilities | 2 | $27B |
|
||
| Insurance | 2 | $25B |
|
||
| Technology | 2 | $15B |
|
||
Cash-flow waterfall
monthlySold comps — $/sqft
last 12 mo · ≤1 miLoading sold comps…