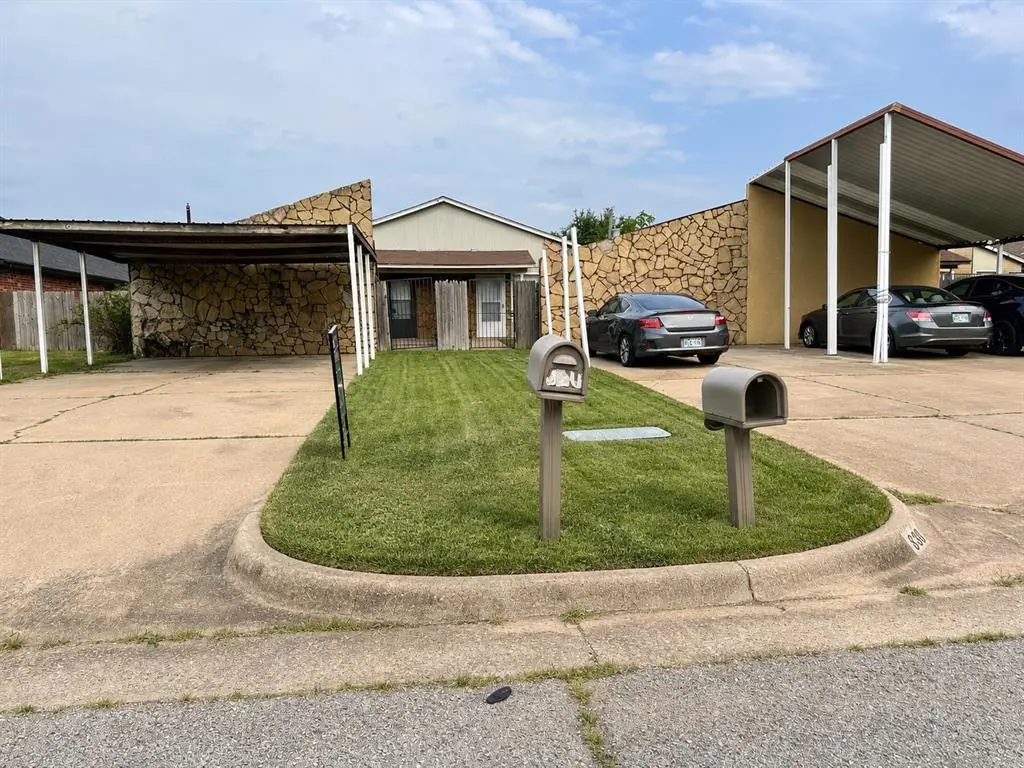
 Duplex
828 NW 113th St · Oklahoma City, OK
Flood risk 1/10 · Minimal
- FEMA flood zone
- X (unshaded)
- Chance of flooding over 30 yrs
- 0.0%
- Est. flood insurance / yr
- $507 – $1,088
Fire risk 3/10 · Minor
- Est. fire insurance / yr
- $2,463 – $4,575
Heat risk 6/10 · Moderate
- Hot days now (above 107°F)
- 7 days/yr
- Hot days in 30 yrs
- 19 days/yr
Wind risk 2/10 · Minimal
- Chance of severe wind over 30 yrs
- 4.0%
Air-quality risk 2/10 · Minimal
- Unhealthy air days now
- 2 days/yr
- Unhealthy air days in 30 yrs
- 2 days/yr
Risk factors via First Street. Map © Google.
Why this score? — see what drove the C- grade
The composite is a weighted blend of 9 inputs, each scored 0–100. Each bar is that input's sub-score; the figure is the points it added to the 100-point composite (weight × sub-score).
- Cash flow +22.7/30.0
- ARV discount +7.5/15.0
- DSCR +7.3/10.0
- 1% rule +4.8/10.0
- Livability +4.0/5.0
- Rent growth +3.4/5.0
- Condition / age +2.5/5.0
- Schools +0.7/10.0
- Appreciation +0.0/10.0
$215,000
🖨 Deal sheet 📄 Offer letter ✓ Due diligence
Multi-family units
County records classify this as Multi-Family (2-4 Unit). Listing-text estimate: 2 units. confirmed
Listing remarks
Income-producing duplex in a convenient, high-demand location with excellent long-term investment potential. This full duplex is being sold as one property and offers an outstanding opportunity for investors seeking cash flow and future appreciation. Each unit features approximately 904 square feet of living space, a functional floor plan, designated laundry room, and private outdoor storage. Residents enjoy central heat and air, dedicated parking with one assigned space per unit, plus additional guest parking. The property is built with a durable slab foundation and frame construction and has been recently painted. With strategic updates and value-add improvements, this duplex offers the p
Key facts
- High demand location
- Central heat and air
- 3,498 sq ft lot
Tags
Property features AI
Finance
- Other: Owner-occupied/occupied; Homestead indicated
- Financial info: Listed as a residential income property (duplex)
- HOA & community: No mandatory association dues
Exterior
- Parking: 1 parking space
- Utilities: Manual geocode/directions recorded
- Home design: Residential income property (duplex); One-level; Existing property
- Construction: Frame construction; Composition roof; Built on a slab foundation; Handicap accessible
- Exterior features: Interior lot; Not in a flood zone
Interior
- Bedrooms: 2 bedrooms (property is a duplex with 2 units)
- Bathrooms: 2 full bathrooms
- Heating & cooling: Electric heating
- Interior features: Accessible common areas; No fireplace
- Laundry & utility: Washer and dryer included; Slab foundation
Neighborhood map
What this means for you Summary
Snapshot
- This is a 2 × 2-bed/2.0-bath units multifamily listed at $215k.
Deal economics
- At list price, monthly cash flow is $368 ($4k/yr) — positive. Per door: $184/mo.
- The deal already cash-flows at list — no discount required.
- To meet the 1% rule (rent ≥ 1% of price), the offer needs to be $210k (2.1% below list).
- Recommended offer: $210k (2.1% below list) — sets the bar for 1% rule.
- Cap rate 8.3% vs local median 3.7% in Oklahoma City — top-decile yield for the area; either an underpriced asset or a hidden risk that comps aren't pricing in. Stress-test before assuming the spread holds.
Location & tenants
- Location reads 80/100 on livability (#3 in OK, #1,635 nationally) — a professional / high-income tenant draw. Strengths: amenities A+, commute A+, cost of living A+; Watch: crime F.
- Oklahoma City (urban): math 7% / reading 10% proficiency, ranked #254 of 270 in OK (top 94%) — low school quality limits family demand, transient renter base, plan for 1-2y turnover; 82% free/reduced lunch — lower-income household profile, screen leases tightly.
- Zoned schools: John Marshall Hs (math 2% / reading 8%, grade F, #430 of 447 statewide, top 99%, 829 students, 0% FRL) — zoned schools average 0% FRL vs 82% district-wide (82 pts lower); this property's tenant base skews higher-income than the district average.
- Market conditions: Rents rising (+3.5%/yr); 145 active listings in the ZIP; 39 comparable units currently listed for rent nearby; rentals at typical pace (median 24d on market — plan ~3-4 weeks tenant-placement turnaround); 5,365 units permitted in Oklahoma County in 2024 (569 in 5+ unit buildings).
- At $2,105/mo this rent would consume 46% of the median local household income ($55k/yr) (locally 1035% of renters already pay >50% of income on rent) — very limited rent-growth headroom before tenants either downsize or default.
Forward outlook
- Local home prices are declining (-3.0%/yr); year-one equity from $1k of loan paydown is wiped out by about $6k of value loss. Plan a longer hold.
- Oklahoma County population projected at +41% by 2050 — long-run rental-demand tailwind backs the buy-and-hold thesis.
Negotiation context
- Only 12 days on market — expect competitive offers; lowballing is unlikely to land.
Risks & watch-outs
- Climate carrying-cost: extreme-heat days projected 7→19/yr by 2055 (HVAC capex compounding) — expect insurance premiums to compound above CPI over the hold.
Questions for the listing agent
- Can we see the unit-by-unit rent roll, current vacancy, and any below-market leases? What's the average tenancy length?
- What capital expenditures (roof, boiler, parking lot, exteriors) have been made in the last 5 years, and what's planned in the next 2?
- Is there a deadline driving the sale (1031 exchange, divorce, estate, relocation)? That informs how much negotiation room exists.
- Schools are F-rated, which usually means shorter tenancies and higher turnover. Who's the typical renter profile here, and what's been the actual vacancy rate?
- Crime grade is F in this area — have there been break-ins, vandalism, or insurance claims at this property in the last 3 years? What carrier currently insures it and at what premium?
- What's the average days-on-market for RENTAL listings here right now (not sales)? A rising rental-DOM trend means longer vacancies and softer asking-rent achievability than the comps imply.
- What's the recent tenant-quality profile in this submarket — average credit score on applications, eviction rate, late-payment / NSF rate, and stable-employment percentage? A property-management company in the area should have these aggregated.
- How much new apartment / multifamily construction is in the pipeline within 1–3 miles? Heavy new supply (>2% of stock underway) typically softens rents 12–24 months out; light construction supports rent growth.
Investment metrics
- 1% rule
- 0.98% ✗
- Cap rate
- 8.35%
- Cash-on-cash
- 7.34%
- DSCR
- 1.33
- GRM
- 8.5
CMA / ARV
No comps found within radius.
Projected returns pro-forma
-3.0% appreciation · 3.47% rent growth · sell at horizon
- IRR
- -4.6%
- Equity multiple
- 0.83×
- Total profit
- $-10,470
- Equity at exit
- $32,057
- IRR
- 5.5%
- Equity multiple
- 1.41×
- Total profit
- $24,880
- Equity at exit
- $18,589
Cash invested: $60,200 (down + closing). Projections, not guarantees.
Landlord ↔ Tenant lean methodology
- Overall (STATE)
- 83 Strongly Landlord-Friendly
- State Oklahoma
- 83 Strongly Landlord-Friendly · R+20
- County
- — inherits STATE
- City
- — inherits STATE
ZIP-level market 73114
- Home prices YoY
- -12.5%
- Rents YoY
- 3.5%
- Active inventory
- 145
- Price-to-rent
- 17.0×
Monthly cashflow live
- Estimated rent
- $2,105 medium interval (Pro) →
- Mortgage (P&I)
- −$1,127
- Tax from tax record
- −$78 /mo · $931/yr
- Insurance
- −$90
- HOA
- −$0
- Vacancy / Maint / Mgmt
- −$442
- Net cashflow
- $368
Break-even live
2-unit breakdown (identical units grouped — click to expand)
| Units | Beds | Baths | Est. rent |
|---|---|---|---|
| 2× units | 2 | 2 | $2,104 |
| #1 | 2 | 2 | $1,052 |
| #2 | 2 | 2 | $1,052 |
| Total (2 units) | $2,105 | ||
UW: 25.0% down · 7.5% · 30yr · 1.5% tax · 5.0% vac · 8.0% maint · 8.0% mgmt
Financing live
Cash to close
- Down payment
- $53,750
- Closing costs
- $6,450
- Reserves months
- —
- Total cash needed
- —
Loan-product check · same deal, 3 products live
Conventional
25% down · 7.5% · 30yr
- Down + closing
- —
- Monthly P&I
- —
- Monthly cashflow
- —
- DSCR
- —
- Eligible?
- —
Personal DTI + credit; lowest rate.
DSCR
20% down · 8.5% · 30yr
- Down + closing
- —
- Monthly P&I
- —
- Monthly cashflow
- —
- DSCR
- —
- Eligible?
- —
No personal income docs; deal must DSCR.
Hard money
10% down · 12.0% · 12mo
- Down + closing
- —
- Monthly P&I
- —
- Monthly cashflow
- —
- DSCR
- —
- Eligible?
- —
Short-term bridge; refi at stabilization.
Rent comps 39 comps
| Address | Beds | Baths | Sqft | Rent | $/sqft | DOM | Units | Dist |
|---|---|---|---|---|---|---|---|---|
| 839 NW 111th St Unit 839 Oklahoma City, OK | 1.0 | 1.5 | 1121 | $1,075 | $0.96 | 23d | 1 | 0.11mi |
| 1209 W Hefner Rd Oklahoma City, OK | 1.0–2.0 | 1.0–1.5 | 852 | $1,029 | $1.21 | 23d | 3 | 0.32mi |
| 11800 N Western Ave Unit 302 Oklahoma City, OK | 2.0 | 2.0 | 960 | $1,006 | $1.05 | 4d | 1 | 0.33mi |
| 11800 N Western Ave Unit 210 Oklahoma City, OK | 3.0 | 2.0 | 1120 | $1,160 | $1.04 | 4d | 1 | 0.33mi |
| 11800 N Western Ave Apt 919 Oklahoma City, OK | 3.0 | 2.0 | 1120 | $1,160 | $1.04 | 43d | 1 | 0.33mi |
| 11800 N Western Ave Apt 205 Oklahoma City, OK | 3.0 | 2.0 | 1120 | $1,100 | $0.98 | 43d | 1 | 0.33mi |
| 11800 N Western Ave Apt 601 Oklahoma City, OK | 2.0 | 2.0 | 960 | $1,006 | $1.05 | 43d | 1 | 0.33mi |
| 11800 N Western Ave Oklahoma City, OK | 3.0 | 2.0 | 1120 | $1,160 | $1.04 | 43d | 1 | 0.33mi |
| 1301 W Hefner Rd Oklahoma City, OK | 1.0–2.0 | 1.0–2.0 | 898 | $1,310 | $1.46 | 2d | 14 | 0.43mi |
| 10735 N Western Ave Oklahoma City, OK | 1.0 | 1.0 | 740 | $799 | $1.08 | 20d | 1 | 0.44mi |
| 10735 N Western Ave Oklahoma City, OK | 1.0–3.0 | 1.0–2.5 | 995 | $974 | $0.98 | 43d | 64 | 0.44mi |
| 10735 N Western Ave Unit 10727H Oklahoma City, OK | 2.0 | 2.0 | 935 | $949 | $1.01 | 23d | 1 | 0.44mi |
| 10735 N Western Ave Oklahoma City, OK | 1.0 | 1.0 | 740 | $799 | $1.08 | 23d | 1 | 0.44mi |
| 10735 N Western Ave Unit 10743C Oklahoma City, OK | 2.0 | 2.0 | 935 | $949 | $1.01 | 3d | 1 | 0.44mi |
| 820 NW 122nd St Oklahoma City, OK | 2.0 | 2.0 | 920 | $1,217 | $1.32 | 4d | 4 | 0.67mi |
| 1800 NW 115th St Oklahoma City, OK | 1.0–3.0 | 1.0–2.0 | 1019 | $1,705 | $1.67 | 2d | 8 | 0.73mi |
| 405 NW 119th St Oklahoma City, OK | 2.0 | 1.0 | 950 | $1,050 | $1.11 | 43d | 1 | 0.74mi |
| 910 NW 101st St Oklahoma City, OK | 3.0 | 1.0 | 1100 | $1,400 | $1.27 | 2d | 1 | 0.79mi |
| 329 NW 120th St Oklahoma City, OK | 3.0 | 2.0 | 1077 | $1,250 | $1.16 | 43d | 1 | 0.83mi |
| 911 NW 98th St Oklahoma City, OK | 3.0 | 1.0 | 1122 | $1,100 | $0.98 | 2d | 1 | 0.99mi |
| 912 NW 98th St Oklahoma City, OK | 1.0 | 1.0 | 560 | $850 | $1.52 | 2d | 1 | 1.01mi |
| 201 NW 121st St Oklahoma City, OK | 3.0 | 1.5 | 986 | $1,120 | $1.14 | 43d | 1 | 1.03mi |
| 11239 N Pennsylvania Ave Oklahoma City, OK | 1.0–2.0 | 1.0–2.0 | 850 | $1,155 | $1.36 | 4d | 30 | 1.14mi |
| 11130 Stratford Dr Oklahoma City, OK | 1.0 | 1.0 | 625 | $975 | $1.56 | 43d | 1 | 1.22mi |
| 1417 NW 95th St Oklahoma City, OK | 2.0 | 1.0 | 916 | $1,085 | $1.18 | 23d | 1 | 1.27mi |
| 411 Summit Ridge Dr Oklahoma City, OK | 2.0 | 2.0 | 1089 | $1,295 | $1.19 | 11d | 1 | 1.32mi |
| 411 Summit Ridge Dr Oklahoma City, OK | 2.0 | 2.0 | 1089 | $1,295 | $1.19 | 43d | 1 | 1.32mi |
| 408 Summit Ridge Dr Oklahoma City, OK | 1.0–2.0 | 1.0–1.5 | 697 | $1,169 | $1.68 | 2d | 8 | 1.33mi |
| 130 Trail Ridge Rd Oklahoma City, OK | 2.0 | 2.0 | 933 | $1,395 | $1.50 | 43d | 1 | 1.34mi |
| 412 Vail Cir Oklahoma City, OK | 2.0 | 2.0 | 995 | $1,295 | $1.30 | 16d | 1 | 1.34mi |
| 1425 NW 94th St Oklahoma City, OK | 2.0 | 1.0 | 816 | $795 | $0.97 | 21d | 1 | 1.34mi |
| 413 W Britton Rd Oklahoma City, OK | 2.0 | 1.0 | 912 | $840 | $0.92 | 20d | 1 | 1.38mi |
| 413 W Britton Rd Oklahoma City, OK | 2.0 | 1.0 | 912 | $840 | $0.92 | 23d | 1 | 1.38mi |
| 11412 Keystone Cir Oklahoma City, OK | 2.0 | 2.0 | 1050 | $1,345 | $1.28 | 23d | 1 | 1.41mi |
| 704 NW 92nd St Oklahoma City, OK | 1.0 | 1.0 | 616 | $799 | $1.30 | 2d | 1 | 1.46mi |
| 11402 N Lincoln Blvd Oklahoma City, OK | 2.0 | 1.0 | 1070 | $1,425 | $1.33 | 23d | 1 | 1.47mi |
| 11508 N Lincoln Blvd Oklahoma City, OK | 2.0 | 2.0 | 1050 | $1,345 | $1.28 | 23d | 1 | 1.47mi |
| 11528 N Lincoln Blvd Oklahoma City, OK | 2.0 | 2.0 | 1125 | $1,375 | $1.22 | 43d | 1 | 1.47mi |
| 1441 NW 92nd St Oklahoma City, OK | 1.0–2.0 | 1.0 | 725 | $850 | $1.17 | 43d | 1 | 1.49mi |
Listing history 9 events
-
2026-06-18days on market $215,000 Active 12 DOM
-
2026-06-17days on market $215,000 Active 11 DOM
-
2026-06-16days on market $215,000 Active 10 DOM
-
2026-06-15days on market $215,000 Active 9 DOM
-
2026-06-13days on market $215,000 Active 7 DOM
-
2026-06-09days on market $215,000 Active 3 DOM
-
2026-06-08days on market $215,000 Active 2 DOM
-
2026-06-07remarks 699-char remark
-
2026-06-07$215,000 Active 1 DOM
ⓘ Source: listings_history table (triggers on properties + properties_extension) + one-shot
backfill from property_details.listing_events for pre-trigger history.
Tax reassessment forecast OK · Resets to sale price
- Current annual tax
- $931 · $78/mo
- Projected year-2 tax
- $1,935 · $161/mo
- Expected delta
- +$1,004/yr (+$84/mo · 107.7%)
ⓘ Screening estimate from a state-policy table — verify with the county assessor before closing.
Climate risk First Street
- Flood 1/10 Low FEMA zone X (unshaded) · 0% chance over 30 yrs
- Wildfire 3/10 Moderate
- Heat 6/10 Major 7 d/yr ≥107°F today · 19 d/yr by 30 yrs out
- Wind 2/10 Low 4% chance of damaging wind over 30 yrs
- Air quality 2/10 Low 2 unhealthy d/yr today · 2 by 30 yrs out
Nearby sold comps map
Loading sold comps map…
Walkable amenities ~0.75 mi
Loading nearby amenities…
Taxation est. · year 1
- Rental income
- $25,260
- − Mortgage interest
- −$12,043
- − Property taxes
- −$931
- − Insurance
- −$1,075
- − Repairs & maintenance
- −$2,021
- − Management
- −$2,021
- − Depreciation
- −$6,255
- Taxable income
- $914
- Est. tax owed @ 24.0%
- −$219
- After-tax cash flow
- $4,200/yr
For passive investors: Depreciation is non-cash, so a rental often shows a tax loss while cash-flowing — sheltering income. Rental losses are passive: they offset passive income freely, and up to $25,000/yr can offset ordinary (W-2) income if you actively participate and your MAGI is under $100k (phasing out to $0 by $150k); unused losses carry forward. On sale, claimed depreciation is recaptured at up to 25%, and gains may owe capital-gains tax (a 1031 exchange can defer both). Figures are a year-1 estimate at your 24.0% rate — not tax advice; consult a CPA.
Schools (NCES district)
- District
- Oklahoma City
- NCES district ID
- 4022770
- Math proficiency
- 7% ▼ -5.00%
- Reading proficiency
- 10% ▼ -6.00%
- Median HH income
- $35,606
- Composite
- 7.0/100
- National rank
- #9970
- State rank
- #254 of 270 in OK
Livability — Oklahoma City
- Score
- 80/100
- State rank
- #3
- US rank
- #1635
Category grades
Schools grade is shown separately in the Schools card above.
Census & demographics
- Census place
- Oklahoma City, OK
- County
- Oklahoma County · 771,644 people
- City population
- 498,656
- Metro
- Oklahoma City, OK
- Population (ZIP)
- 17,656
- Household income
- $54,936
- Rent vs Own
- Severe rent burden
- 1035.0
Population outlook (Oklahoma County) Hauer SSP2
- Today (2025)
- 911,875 people
- By 2030
- 982,413 · +7.7%
- By 2040
- 1,130,468 · +24.0%
- By 2050
- 1,288,422 · +41.3%
- By 2075
- 1,711,482 · +87.7%
- By 2100
- 2,088,448 · +129.0%
Race, ethnicity, and origin ACS 2023
- Neighborhood character
- Highly diverse neighborhood (Simpson 0.71)
- Race & ethnicity
- Black 41% White 29% Hispanic / Latino 20% Two or more races 12% Native American 3%
- Hispanic origin (detail)
- Mexican 16% Puerto Rican 1%
- Common ancestry
- Russian 1% Slovak 1% Italian 1%
- Foreign-born
- 12% · Canada, Jamaica
- Languages at home
- 78% English-only · Spanish 18%
Political lean MEDSL · Oklahoma
- 2024 margin
- Toss-up / Even · D 48.0% · R 49.7% · Other 2.3%
- 2008→2024 swing
- +15.1pp toward D · 2008: -16.8pp · 2024: -1.7pp
- All cycles
- 2024: R+1.7 2020: R+1.1 2016: R+10.5 2012: R+16.7 2008: R+16.8
Not yet ingested
- Civics
- —
Market trends
- HPI YoY
- ▼ -44.26%
- Current HPI
- 310.4705
- Rent YoY
- ▲ 3.47%
- Metro
- Oklahoma City, OK
- State GDP YoY
- ▲ 1.55%
- F500 in state
- 6
Industry mix (Fortune 500 HQ in OK)
| Industry | F500 HQs | Revenue |
|---|---|---|
| Energy | 3 | $48B |
|
||
Price history
1 event — show timeline
- 2026-06-05 Listed $215,000 MLSOK
Property tax history
+4.9%/yrLatest (2025): $931 · +4.1% YoY. Source: county tax records.
Cash-flow waterfall
monthlySold comps — $/sqft
last 12 mo · ≤1 miLoading sold comps…