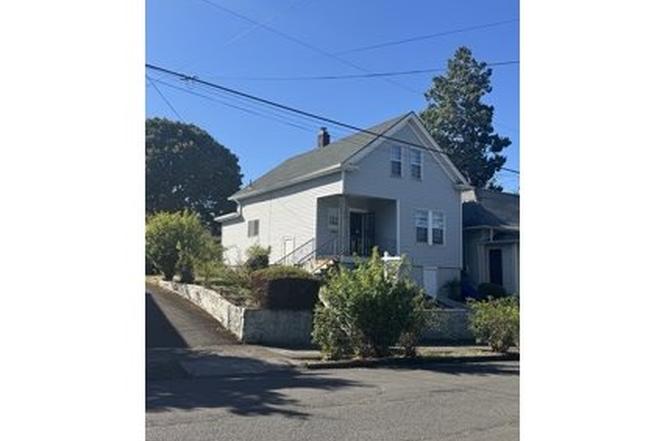
3627 NE 9th Ave · Portland, OR
Flood risk 1/10 · Minimal
- FEMA flood zone
- X (unshaded)
- Chance of flooding over 30 yrs
- 0.0%
- Est. flood insurance / yr
- $507 – $1,088
Fire risk 1/10 · Minimal
- Est. fire insurance / yr
- $498 – $926
Heat risk 3/10 · Minor
- Hot days now (above 92°F)
- 7 days/yr
- Hot days in 30 yrs
- 14 days/yr
Wind risk 1/10 · Minimal
- Chance of severe wind over 30 yrs
- —
Air-quality risk 10/10 · Severe
- Unhealthy air days now
- 19 days/yr
- Unhealthy air days in 30 yrs
- 20 days/yr
Risk factors via First Street. Map © Google.
Why this score? — see what drove the C- grade
The composite is a weighted blend of 9 inputs, each scored 0–100. Each bar is that input's sub-score; the figure is the points it added to the 100-point composite (weight × sub-score).
- ARV discount +15.0/15.0
- Cash flow +13.7/30.0
- Schools +4.7/10.0
- DSCR +4.2/10.0
- Livability +3.9/5.0
- Rent growth +3.4/5.0
- 1% rule +2.7/10.0
- Condition / age +2.5/5.0
- Appreciation +0.0/10.0
$500,000
🖨 Deal sheet 📄 Offer letter ✓ Due diligence
Key facts
- 5,227 sq ft lot
- Built 1913
- Listed 124 days
Neighborhood map
What this means for you Summary
Snapshot
- This is a 4-bed/1.5-bath single-family listed at $500k.
Deal economics
- At list price, monthly cash flow is $41 ($490/yr) — positive.
- The deal already cash-flows at list — no discount required.
- To meet the 1% rule (rent ≥ 1% of price), the offer needs to be $387k (22.7% below list).
- Recommended offer: $387k (22.7% below list) — sets the bar for 1% rule.
- Cap rate 6.4% vs local median 2.2% in Portland — top-decile yield for the area; either an underpriced asset or a hidden risk that comps aren't pricing in. Stress-test before assuming the spread holds.
Location & tenants
- Location reads 77/100 on livability (#72 in OR, #3,256 nationally) — a middle-class / working-renter tenant base. Strengths: amenities A+, commute A+, health & safety A+; Watch: crime F, cost of living F.
- Portland SD 1J (urban): math 46% / reading 58% proficiency, ranked #23 of 183 in OR (top 13%) — acceptable for families but not a draw, mixed tenant base, ~2y average lease.
- Zoned schools: Sabin Elementary School (312 students, 25% FRL); Harriet Tubman Middle School (360 students, 65% FRL); Jefferson High School (606 students, 64% FRL).
- Market conditions: Rents rising (+3.5%/yr); 128 active listings in the ZIP; 19 comparable units currently listed for rent nearby; rentals at typical pace (median 21d on market — plan ~3-4 weeks tenant-placement turnaround); high-income renter base; 2,041 units permitted in Multnomah County in 2024 (905 in 5+ unit buildings).
- This rent runs 35% of the median local income ($132k/yr) — at the standard rent-burdened threshold; future hikes will face affordability resistance.
Forward outlook
- Local home prices are declining (-3.0%/yr); year-one equity from $3k of loan paydown is wiped out by about $15k of value loss. Plan a longer hold.
- Multnomah County population projected at +33% by 2050 — long-run rental-demand tailwind backs the buy-and-hold thesis.
Negotiation context
- It's been on market 124 days — a 12% lower offer ($440k) is reasonable based on typical stale-listing flexibility.
- 2 sale attempts with the ask held roughly flat each time — persistent listings suggest the price (not the market) is what's stuck; bring a comps-based counter.
Risks & watch-outs
- Watch-outs: built in 1913 — expect roof / HVAC / electrical / plumbing capex.
Questions for the listing agent
- It's been on market 124 days. Have you received any prior offers? Is the seller open to a 23% concession, seller financing, or rate buy-down credit?
- Built in 1913 — when were the roof, HVAC, electrical panel, plumbing, and water heater last replaced?
- Why hasn't it sold? Are there any deal-killer items the seller is aware of (foundation, flood, title, zoning, code violations)?
- Is there a deadline driving the sale (1031 exchange, divorce, estate, relocation)? That informs how much negotiation room exists.
- Crime grade is F in this area — have there been break-ins, vandalism, or insurance claims at this property in the last 3 years? What carrier currently insures it and at what premium?
- What's the average days-on-market for RENTAL listings here right now (not sales)? A rising rental-DOM trend means longer vacancies and softer asking-rent achievability than the comps imply.
- What's the recent tenant-quality profile in this submarket — average credit score on applications, eviction rate, late-payment / NSF rate, and stable-employment percentage? A property-management company in the area should have these aggregated.
- How much new for-sale + rental construction is in the pipeline within 1–3 miles? Heavy new supply typically softens prices + rents 12–24 months out; constrained supply supports both.
Investment metrics
- 1% rule
- 0.77% ✗
- Cap rate
- 6.39%
- Cash-on-cash
- 0.35%
- DSCR
- 1.02
- GRM
- 10.8
CMA / ARV
- ARV (on-the-fly)
- $617,956
- Comps found
- 12
Show comp detail 12 sales within ~0.75 mi
| Address | Dist | Beds/Ba | Sqft | Sold | Price | $/sf | Match |
|---|---|---|---|---|---|---|---|
| 3626 NE 8th Ave | 0.02mi | 3/2.0 (-1) | 1,813 (+2%) | 7mo | $599,900 | $331 | 83 |
| 4037 NE 8th Ave | 0.24mi | 3/2.0 (-1) | 1,950 (+9%) | 3mo | $695,000 | $356 | 64 |
| 4113 NE 8th Ave | 0.29mi | 3/3.0 (-1) | 1,890 (+6%) | 6mo | $565,000 | $299 | 61 |
| 4044 NE 6th Ave | 0.27mi | 3/2.0 (-1) | 1,973 (+10%) | 3mo | $430,000 | $218 | 60 |
| 4037 NE Garfield Ave | 0.37mi | 4/2.0 | 1,992 (+12%) | 3mo | $600,000 | $301 | 59 |
| 4017 NE 15th Ave | 0.37mi | 3/1.0 (-1) | 1,940 (+9%) | 5mo | $507,000 | $261 | 57 |
| 1406 NE Failing St | 0.28mi | 3/2.0 (-1) | 1,537 (-14%) | 0mo | $590,000 | $384 | 57 |
| 2722 NE 9th Ave | 0.46mi | 3/3.0 (-1) | 1,622 (-9%) | 3mo | $850,000 | $524 | 49 |
| 78 NE Ivy St | 0.39mi | 3/2.0 (-1) | 1,998 (+12%) | 7mo | $539,000 | $270 | 49 |
| 4615 NE Rodney Ave | 0.64mi | 3/2.0 (-1) | 1,720 (-4%) | 9mo | $600,000 | $349 | 49 |
| 4406 NE 14th Ave | 0.48mi | 4/3.0 | 2,040 (+14%) | 2mo | $705,000 | $346 | 46 |
| 2437 NE 10th Ave | 0.62mi | 3/3.0 (-1) | 2,007 (+12%) | 6mo | $787,000 | $392 | 34 |
Match score weights: distance 35% · size 25% · config 20% · recency 20%. Top-matched comps best support the ARV.
Projected returns pro-forma
-3.0% appreciation · 3.49% rent growth · sell at horizon
- IRR
- -15.3%
- Equity multiple
- 0.45×
- Total profit
- $-76,720
- Equity at exit
- $74,552
- IRR
- -6.1%
- Equity multiple
- 0.60×
- Total profit
- $-56,388
- Equity at exit
- $43,231
Cash invested: $140,000 (down + closing). Projections, not guarantees.
Landlord ↔ Tenant lean methodology
- Overall (CITY)
- 0 Strongly Tenant-Friendly
- State Oregon
- 28 Tenant-Leaning · D+6
- County
- — inherits STATE
- City Portland
- 0 Strongly Tenant-Friendly · D+39
ZIP-level market 97212
- Rents YoY
- 3.5%
- Active inventory
- 128
- Price-to-rent
- 10.8×
Monthly cashflow live
- Estimated rent
- $3,866 high interval (Pro) →
- Mortgage (P&I)
- −$2,622
- Tax from tax record
- −$183 /mo · $2,197/yr
- Insurance
- −$208
- HOA
- −$0
- Vacancy / Maint / Mgmt
- −$812
- Net cashflow
- $41
Break-even live
UW: 25.0% down · 7.5% · 30yr · 1.5% tax · 5.0% vac · 8.0% maint · 8.0% mgmt
Financing live
Cash to close
- Down payment
- $125,000
- Closing costs
- $15,000
- Reserves months
- —
- Total cash needed
- —
Loan-product check · same deal, 3 products live
Conventional
25% down · 7.5% · 30yr
- Down + closing
- —
- Monthly P&I
- —
- Monthly cashflow
- —
- DSCR
- —
- Eligible?
- —
Personal DTI + credit; lowest rate.
DSCR
20% down · 8.5% · 30yr
- Down + closing
- —
- Monthly P&I
- —
- Monthly cashflow
- —
- DSCR
- —
- Eligible?
- —
No personal income docs; deal must DSCR.
Hard money
10% down · 12.0% · 12mo
- Down + closing
- —
- Monthly P&I
- —
- Monthly cashflow
- —
- DSCR
- —
- Eligible?
- —
Short-term bridge; refi at stabilization.
Rent comps 19 comps
| Address | Beds | Baths | Sqft | Rent | $/sqft | DOM | Units | Dist |
|---|---|---|---|---|---|---|---|---|
| 3938 NE 6th Ave Portland, OR | 3.0 | 2.0 | 1568 | $2,395 | $1.53 | 4d | 1 | 0.20mi |
| 317 NE Beech St Unit 1309851P Portland, OR | 3.0 | 1.0 | 1453 | $6,108 | $4.20 | 15d | 1 | 0.25mi |
| 315-317 NE Beech St Unit 1309843P Portland, OR | 3.0 | 1.0 | 1453 | $6,040 | $4.16 | 2d | 1 | 0.26mi |
| 4412 NE Grand Ave Portland, OR | 3.0 | 2.5 | 1376 | $3,095 | $2.25 | 11d | 1 | 0.46mi |
| 2605 NE 9th Ave Portland, OR | 3.0 | 2.0 | 2537 | $3,435 | $1.35 | 24d | 1 | 0.53mi |
| 4622 NE Garfield Ave Unit 1309897P Portland, OR | 4.0 | 3.0 | 2497 | $13,231 | $5.30 | 44d | 1 | 0.60mi |
| 4413 N Vancouver Ave Portland, OR | 3.0 | 3.5 | 1633 | $2,995 | $1.83 | 22d | 2 | 0.69mi |
| 140 NE Sacramento St Portland, OR | 3.0–5.0 | 3.5–5.0 | 2223 | $3,950 | $1.78 | 20d | 2 | 0.71mi |
| 5177 NE 14th Pl Unit 1271934P Portland, OR | 2.0–4.0 | 1.0–2.5 | 1764 | $11,904 | $6.75 | 10d | 2 | 0.83mi |
| 4313 N Kerby Ave Portland, OR | 5.0 | 2.5 | 2000 | $3,950 | $1.98 | 44d | 1 | 0.86mi |
| 4980 N Vancouver Ave Unit 1309893P Portland, OR | 4.0 | 2.0 | 1313 | $7,883 | $6.00 | 20d | 1 | 0.87mi |
| 5040 NE 18th Ave Unit 1309833P Portland, OR | 3.0 | 1.5 | 1248 | $7,242 | $5.80 | 8d | 1 | 0.89mi |
| 4124 N Mississippi Ave Portland, OR | 3.0 | 2.0 | 1300 | $4,000 | $3.08 | 11d | 1 | 0.95mi |
| 1820 NE Killingsworth St Unit 1824 Portland, OR | 3.0 | 2.0 | 1445 | $2,995 | $2.07 | 44d | 1 | 1.07mi |
| 5530 N Haight Ave Portland, OR | 3.0 | 2.0 | 1472 | $2,595 | $1.76 | 44d | 1 | 1.16mi |
| 1235 N Prescott St Unit 1309834P Portland, OR | 4.0 | 2.0 | 1991 | $9,061 | $4.55 | 22d | 1 | 1.19mi |
| 5016 NE 29th Ave Unit 1309850P Portland, OR | 4.0 | 1.0 | 2325 | $7,622 | $3.28 | 2d | 1 | 1.26mi |
| 5032 N Montana Ave Unit A Portland, OR | 4.0 | 2.0 | 1705 | $2,900 | $1.70 | 44d | 1 | 1.33mi |
| 6227 NE 15th Ave Portland, OR | 4.0 | 2.0 | 2033 | $3,150 | $1.55 | 44d | 1 | 1.35mi |
Listing history 3 events
-
2026-01-28status Pending
-
2025-12-03status Active
-
2025-09-23$500,000 Active
ⓘ Source: listings_history table (triggers on properties + properties_extension) + one-shot
backfill from property_details.listing_events for pre-trigger history.
Tax reassessment forecast OR · Resets to sale price
- Current annual tax
- $2,197 · $183/mo
- Projected year-2 tax
- $4,850 · $404/mo
- Expected delta
- +$2,653/yr (+$221/mo · 120.8%)
ⓘ Screening estimate from a state-policy table — verify with the county assessor before closing.
Climate risk First Street
- Flood 1/10 Low FEMA zone X (unshaded) · 0% chance over 30 yrs
- Wildfire 1/10 Low
- Heat 3/10 Moderate 7 d/yr ≥92°F today · 14 d/yr by 30 yrs out
- Wind 1/10 Low
- Air quality 10/10 Extreme 19 unhealthy d/yr today · 20 by 30 yrs out
Nearby sold comps map
Loading sold comps map…
Walkable amenities ~0.75 mi
Loading nearby amenities…
Taxation est. · year 1
- Rental income
- $46,394
- − Mortgage interest
- −$28,008
- − Property taxes
- −$2,197
- − Insurance
- −$2,500
- − Repairs & maintenance
- −$3,711
- − Management
- −$3,711
- − Depreciation
- −$14,545
- Taxable loss
- −$8,279
- Est. tax savings @ 24.0%
- +$1,987
- After-tax cash flow
- $2,477/yr
For passive investors: Depreciation is non-cash, so a rental often shows a tax loss while cash-flowing — sheltering income. Rental losses are passive: they offset passive income freely, and up to $25,000/yr can offset ordinary (W-2) income if you actively participate and your MAGI is under $100k (phasing out to $0 by $150k); unused losses carry forward. On sale, claimed depreciation is recaptured at up to 25%, and gains may owe capital-gains tax (a 1031 exchange can defer both). Figures are a year-1 estimate at your 24.0% rate — not tax advice; consult a CPA.
Schools (NCES district)
- District
- Portland SD 1J
- NCES district ID
- 4110040
- Math proficiency
- 46% ▼ -2.00%
- Reading proficiency
- 58% ▼ -3.00%
- Median HH income
- $57,851
- Composite
- 47.1/100
- National rank
- #5112
- State rank
- #23 of 183 in OR
Livability — Portland
- Score
- 77/100
- State rank
- #72
- US rank
- #3256
Category grades
Schools grade is shown separately in the Schools card above.
Census & demographics
- Census place
- Portland, OR
- County
- Multnomah County · 786,692 people
- City population
- 774,334
- Metro
- Portland-Vancouver-Hillsboro, OR-WA
- Population (ZIP)
- 28,042
- Household income
- $131,932
- Rent vs Own
- Severe rent burden
- 1001.0
Population outlook (Multnomah County) Hauer SSP2
- Today (2025)
- 930,825 people
- By 2030
- 996,904 · +7.1%
- By 2040
- 1,121,379 · +20.5%
- By 2050
- 1,242,124 · +33.4%
- By 2075
- 1,464,431 · +57.3%
- By 2100
- 1,576,181 · +69.3%
Race, ethnicity, and origin ACS 2023
- Neighborhood character
- Predominantly White (76%)
- Race & ethnicity
- White 76% Two or more races 11% Hispanic / Latino 9% Black 6% Asian 3%
- Hispanic origin (detail)
- Mexican 5%
- Common ancestry
- Italian 4% Slovak 4% Lithuanian 3%
- Foreign-born
- 7% · Canada, China
- Languages at home
- 88% English-only · Spanish 5% Other Indo-European 2% French/Haitian/Cajun 1%
Political lean MEDSL · Multnomah
- 2024 margin
- Solid D (+62.1) · D 79.3% · R 17.2% · Other 3.5%
- 2008→2024 swing
- +6.0pp toward D · 2008: 56.1pp · 2024: 62.1pp
- All cycles
- 2024: D+62.1 2020: D+61.3 2016: D+58.3 2012: D+54.9 2008: D+56.1
Not yet ingested
- Civics
- —
Market trends
- HPI YoY
- ▼ -1048.78%
- Current HPI
- 312.3989
- Rent YoY
- ▲ 3.49%
- Metro
- Portland-Vancouver-Hillsboro, OR-WA
- State GDP YoY
- ▲ 2.05%
- F500 in state
- 2
Industry mix (Fortune 500 HQ in OR)
| Industry | F500 HQs | Revenue |
|---|---|---|
| Consumer Goods | 1 | $51B |
|
||
Price history
3 events — show timeline
- 2026-01-28 Pending — RMLS
- 2025-12-03 Relisted — RMLS
- 2025-09-23 Listed $500,000 RMLS
Property tax history
+4.4%/yrLatest (2025): $2,197 · +3.7% YoY. Source: county tax records.
Cash-flow waterfall
monthlySold comps — $/sqft
last 12 mo · ≤1 miLoading sold comps…