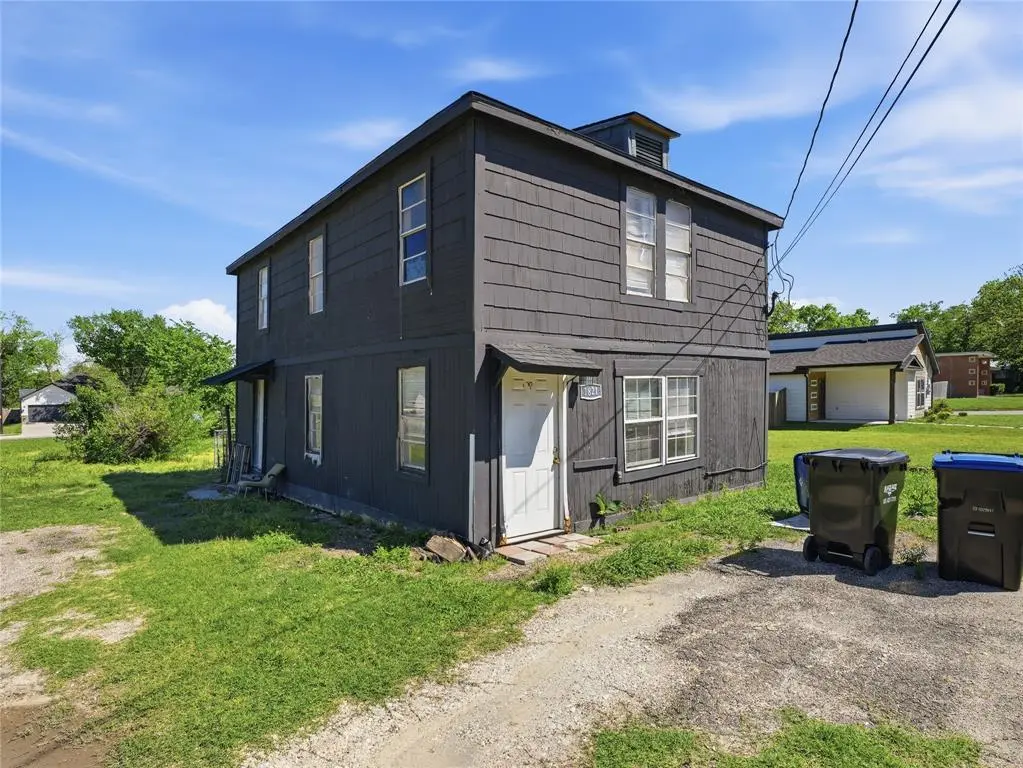
1821 Johnson St · Greenville, TX
Flood risk 1/10 · Minimal
- FEMA flood zone
- X (unshaded)
- Chance of flooding over 30 yrs
- 0.0%
- Est. flood insurance / yr
- $507 – $1,088
Fire risk 5/10 · Moderate
- Est. fire insurance / yr
- $1,222 – $2,270
Heat risk 7/10 · Major
- Hot days now (above 110°F)
- 7 days/yr
- Hot days in 30 yrs
- 23 days/yr
Wind risk 6/10 · Moderate
- Chance of severe wind over 30 yrs
- 27.0%
Air-quality risk 2/10 · Minimal
- Unhealthy air days now
- 1 days/yr
- Unhealthy air days in 30 yrs
- 1 days/yr
Risk factors via First Street. Map © Google.
Why this score? — see what drove the B- grade
The composite is a weighted blend of 9 inputs, each scored 0–100. Each bar is that input's sub-score; the figure is the points it added to the 100-point composite (weight × sub-score).
- Cash flow +30.0/30.0
- 1% rule +10.0/10.0
- DSCR +10.0/10.0
- ARV discount +7.5/15.0
- Livability +3.9/5.0
- Rent growth +2.7/5.0
- Condition / age +2.5/5.0
- Schools +2.0/10.0
- Appreciation +0.0/10.0
$106,000
🖨 Deal sheet 📄 Offer letter ✓ Due diligence
Listing remarks MLS
5-bedroom, 2-bath SFR on a 0.27-acre lot in Greenville with main street visibility and 4 off-street parking spaces. Built in 1955, the home offers 1,452 sq ft of livable space with a functional floor plan and solid frame construction. Property needs cosmetic and systemic updates - priced to reflect condition. The high bedroom count creates flexibility for maximizing rental income or repositioning for retail resale. Comparable updated homes on the same street are trading well above ask. Ideal for investors seeking a value-add opportunity with clear upside. Cash or hard money preferred. Sold as-is.
Key facts
- 0.27 acre lot
- Built 1955
- Listed 63 days
Tags
Neighborhood map
What this means for you Summary
Snapshot
- This is a 5-bed/3.0-bath single-family listed at $106k.
Deal economics
- At list price, monthly cash flow is $800 ($10k/yr) — positive.
- The deal already cash-flows at list — no discount required.
- Meets the 1% rule at list price ($2k rent vs $106k).
- Recommended offer: $100k (6.0% below list) — sets the bar for market timing.
- Cap rate 15.4% vs local median 4.1% in Greenville — top-decile yield for the area; either an underpriced asset or a hidden risk that comps aren't pricing in. Stress-test before assuming the spread holds.
Location & tenants
- Location reads 77/100 on livability (#78 in TX, #2,719 nationally) — a middle-class / working-renter tenant base. Strengths: cost of living A+, housing A+, health & safety A; Watch: employment D, schools D-, commute F.
- Greenville ISD (town): math 20% / reading 26% proficiency, ranked #743 of 826 in TX (top 90%) — low school quality limits family demand, transient renter base, plan for 1-2y turnover.
- Market conditions: Rents flat; 396 active listings in the ZIP; 5 comparable units currently listed for rent nearby; rentals lingering (median 44d on market — plan ~5-8 weeks vacancy on turnover, expect pricing pressure); 100% of comp listings sitting > 30 days — soft ceiling on asking rent; 1,289 units permitted in Hunt County in 2024 (527 in 5+ unit buildings).
- This rent runs 41% of the median local income ($60k/yr) — at the standard rent-burdened threshold; future hikes will face affordability resistance.
Forward outlook
- Local home prices are declining (-3.0%/yr); year-one equity from $733 of loan paydown is wiped out by about $3k of value loss. Plan a longer hold.
- Hunt County population projected at +15% by 2050 — modest demand growth; plan on rents tracking national, not racing it.
- At projected returns (-3.0% appreciation + 0.6% rent growth), your $30k cash investment doubles in ~4 years — after that, you're playing with house money.
Negotiation context
- It's been on market 64 days — a 6% lower offer ($100k) is reasonable based on typical stale-listing flexibility.
Risks & watch-outs
- Watch-outs: built in 1955 — expect roof / HVAC / electrical / plumbing capex.
- Climate carrying-cost: major wind risk, 27% chance of damaging wind over 30y; moderate wildfire risk; extreme-heat days projected 7→23/yr by 2055 (HVAC capex compounding) — expect insurance premiums to compound above CPI over the hold.
Questions for the listing agent
- It's been on market 64 days. Have you received any prior offers? Is the seller open to a 6% concession, seller financing, or rate buy-down credit?
- Built in 1955 — when were the roof, HVAC, electrical panel, plumbing, and water heater last replaced?
- Why hasn't it sold? Are there any deal-killer items the seller is aware of (foundation, flood, title, zoning, code violations)?
- Is there a deadline driving the sale (1031 exchange, divorce, estate, relocation)? That informs how much negotiation room exists.
- Schools are D-rated, which usually means shorter tenancies and higher turnover. Who's the typical renter profile here, and what's been the actual vacancy rate?
- What's the average days-on-market for RENTAL listings here right now (not sales)? A rising rental-DOM trend means longer vacancies and softer asking-rent achievability than the comps imply.
- What's the recent tenant-quality profile in this submarket — average credit score on applications, eviction rate, late-payment / NSF rate, and stable-employment percentage? A property-management company in the area should have these aggregated.
- How much new for-sale + rental construction is in the pipeline within 1–3 miles? Heavy new supply typically softens prices + rents 12–24 months out; constrained supply supports both.
Investment metrics
- 1% rule
- 1.91% ✓
- Cap rate
- 15.35%
- Cash-on-cash
- 32.35%
- DSCR
- 2.44
- GRM
- 4.4
CMA / ARV
- ARV (median comp)
- $265,448
- List price
- $106,000
- Delta
- -60.07%
- Verdict
- UNDERPRICED
- Comps
- 20 within 1.0 mi
Show comp detail 2 sales within ~0.75 mi
| Address | Dist | Beds/Ba | Sqft | Sold | Price | $/sf | Match |
|---|---|---|---|---|---|---|---|
| 1602 Fuller St | 0.30mi | 4/2.0 (-1) | 1,524 (+5%) | 22mo | $210,000 | $138 | 51 |
| 3100 Polk St | 0.36mi | 4/2.0 (-1) | 1,632 (+12%) | 13mo | $120,000 | $74 | 43 |
Match score weights: distance 35% · size 25% · config 20% · recency 20%. Top-matched comps best support the ARV.
Projected returns pro-forma
-3.0% appreciation · 0.62% rent growth · sell at horizon
- IRR
- 24.6%
- Equity multiple
- 1.98×
- Total profit
- $29,115
- Equity at exit
- $15,805
- IRR
- 30.8%
- Equity multiple
- 3.45×
- Total profit
- $72,721
- Equity at exit
- $9,165
Cash invested: $29,680 (down + closing). Projections, not guarantees.
Landlord ↔ Tenant lean methodology
- Overall (STATE)
- 87 Strongly Landlord-Friendly
- State Texas
- 87 Strongly Landlord-Friendly · R+5
- County
- — inherits STATE
- City
- — inherits STATE
ZIP-level market 75401
- Home prices YoY
- -20.7%
- Rents YoY
- 0.6%
- Active inventory
- 396
- Price-to-rent
- 4.4×
Monthly cashflow live
- Estimated rent
- $2,026 high interval (Pro) →
- Mortgage (P&I)
- −$556
- Tax from tax record
- −$201 /mo · $2,408/yr
- Insurance
- −$44
- HOA
- −$0
- Vacancy / Maint / Mgmt
- −$426
- Net cashflow
- $800
Break-even live
UW: 25.0% down · 7.5% · 30yr · 1.5% tax · 5.0% vac · 8.0% maint · 8.0% mgmt
Financing live
Cash to close
- Down payment
- $26,500
- Closing costs
- $3,180
- Reserves months
- —
- Total cash needed
- —
Loan-product check · same deal, 3 products live
Conventional
25% down · 7.5% · 30yr
- Down + closing
- —
- Monthly P&I
- —
- Monthly cashflow
- —
- DSCR
- —
- Eligible?
- —
Personal DTI + credit; lowest rate.
DSCR
20% down · 8.5% · 30yr
- Down + closing
- —
- Monthly P&I
- —
- Monthly cashflow
- —
- DSCR
- —
- Eligible?
- —
No personal income docs; deal must DSCR.
Hard money
10% down · 12.0% · 12mo
- Down + closing
- —
- Monthly P&I
- —
- Monthly cashflow
- —
- DSCR
- —
- Eligible?
- —
Short-term bridge; refi at stabilization.
Rent comps 5 comps
| Address | Beds | Baths | Sqft | Rent | $/sqft | DOM | Units | Dist |
|---|---|---|---|---|---|---|---|---|
| 3603 McDougal St Greenville, TX | 5.0 | 2.0 | 1472 | $1,850 | $1.26 | 44d | 1 | 0.63mi |
| 1008 Commerce Dr Greenville, TX | 4.0 | 2.0 | 1590 | $1,795 | $1.13 | 44d | 1 | 0.94mi |
| 1103 Bell Dr Greenville, TX | 4.0 | 2.0 | 1478 | $2,195 | $1.49 | 44d | 1 | 0.98mi |
| 2210 Langford St Greenville, TX | 4.0 | 2.0 | 1510 | $1,595 | $1.06 | 44d | 1 | 1.07mi |
| 2225 College St Greenville, TX | 4.0 | 2.5 | 1832 | $2,000 | $1.09 | 44d | 1 | 1.10mi |
Listing history 13 events
-
2026-06-13pricedays on market $106,000 Active 64 DOM
-
2026-06-09days on market $108,000 Active 60 DOM
-
2026-06-08days on market $108,000 Active 59 DOM
-
2026-06-07days on market $108,000 Active 58 DOM
-
2026-06-04days on market $108,000 Active 55 DOM
-
2026-06-03pricedays on market $108,000 Active 54 DOM
-
2026-06-02days on market $109,999 Active 53 DOM
-
2026-06-01days on market $109,999 Active 52 DOM
-
2026-05-31days on market $109,999 Active 51 DOM
-
2026-05-11price $110,000 603-char remark
Show marketing remark (603 chars)
5-bedroom, 2-bath SFR on a 0.27-acre lot in Greenville with main street visibility and 4 off-street parking spaces. Built in 1955, the home offers 1,452 sq ft of livable space with a functional floor plan and solid frame construction. Property needs cosmetic and systemic updates - priced to reflect condition. The high bedroom count creates flexibility for maximizing rental income or repositioning for retail resale. Comparable updated homes on the same street are trading well above ask. Ideal for investors seeking a value-add opportunity with clear upside. Cash or hard money preferred. Sold as-is.
-
2026-05-05price $120,000 603-char remark
Show marketing remark (603 chars)
5-bedroom, 2-bath SFR on a 0.27-acre lot in Greenville with main street visibility and 4 off-street parking spaces. Built in 1955, the home offers 1,452 sq ft of livable space with a functional floor plan and solid frame construction. Property needs cosmetic and systemic updates - priced to reflect condition. The high bedroom count creates flexibility for maximizing rental income or repositioning for retail resale. Comparable updated homes on the same street are trading well above ask. Ideal for investors seeking a value-add opportunity with clear upside. Cash or hard money preferred. Sold as-is.
-
2026-04-28price $121,500 603-char remark
Show marketing remark (603 chars)
5-bedroom, 2-bath SFR on a 0.27-acre lot in Greenville with main street visibility and 4 off-street parking spaces. Built in 1955, the home offers 1,452 sq ft of livable space with a functional floor plan and solid frame construction. Property needs cosmetic and systemic updates - priced to reflect condition. The high bedroom count creates flexibility for maximizing rental income or repositioning for retail resale. Comparable updated homes on the same street are trading well above ask. Ideal for investors seeking a value-add opportunity with clear upside. Cash or hard money preferred. Sold as-is.
-
2026-04-09$123,947 Active 603-char remark
Show marketing remark (603 chars)
5-bedroom, 2-bath SFR on a 0.27-acre lot in Greenville with main street visibility and 4 off-street parking spaces. Built in 1955, the home offers 1,452 sq ft of livable space with a functional floor plan and solid frame construction. Property needs cosmetic and systemic updates - priced to reflect condition. The high bedroom count creates flexibility for maximizing rental income or repositioning for retail resale. Comparable updated homes on the same street are trading well above ask. Ideal for investors seeking a value-add opportunity with clear upside. Cash or hard money preferred. Sold as-is.
ⓘ Source: listings_history table (triggers on properties + properties_extension) + one-shot
backfill from property_details.listing_events for pre-trigger history.
Tax reassessment forecast TX · Resets to sale price
- Current annual tax
- $2,408 · $201/mo
- Projected year-2 tax
- $2,408 · $201/mo
- Expected delta
- $0/yr ($0/mo · 0.0%)
ⓘ Screening estimate from a state-policy table — verify with the county assessor before closing.
Climate risk First Street
- Flood 1/10 Low FEMA zone X (unshaded) · 0% chance over 30 yrs
- Wildfire 5/10 Major
- Heat 7/10 Severe 7 d/yr ≥110°F today · 23 d/yr by 30 yrs out
- Wind 6/10 Major 27% chance of damaging wind over 30 yrs
- Air quality 2/10 Low 1 unhealthy d/yr today · 1 by 30 yrs out
Nearby sold comps map
Loading sold comps map…
Walkable amenities ~0.75 mi
Loading nearby amenities…
Taxation est. · year 1
- Rental income
- $24,316
- − Mortgage interest
- −$5,938
- − Property taxes
- −$2,408
- − Insurance
- −$530
- − Repairs & maintenance
- −$1,945
- − Management
- −$1,945
- − Depreciation
- −$3,084
- Taxable income
- $8,466
- Est. tax owed @ 24.0%
- −$2,032
- After-tax cash flow
- $7,569/yr
For passive investors: Depreciation is non-cash, so a rental often shows a tax loss while cash-flowing — sheltering income. Rental losses are passive: they offset passive income freely, and up to $25,000/yr can offset ordinary (W-2) income if you actively participate and your MAGI is under $100k (phasing out to $0 by $150k); unused losses carry forward. On sale, claimed depreciation is recaptured at up to 25%, and gains may owe capital-gains tax (a 1031 exchange can defer both). Figures are a year-1 estimate at your 24.0% rate — not tax advice; consult a CPA.
Schools (NCES district)
- District
- Greenville ISD
- NCES district ID
- 4821720
- Math proficiency
- 20% ▼ -12.00%
- Reading proficiency
- 26% ▼ -7.00%
- Median HH income
- $41,374
- Composite
- 19.56/100
- National rank
- #8759
- State rank
- #743 of 826 in TX
Livability — Greenville
- Score
- 77/100
- State rank
- #78
- US rank
- #2719
Category grades
Schools grade is shown separately in the Schools card above.
Census & demographics
- Census place
- Greenville, TX
- County
- Hunt County · 71,969 people
- City population
- 42,767
- Metro
- Dallas-Fort Worth-Arlington, TX
- Population (ZIP)
- 22,669
- Household income
- $59,908
- Rent vs Own
- Severe rent burden
- 638.0
Population outlook (Hunt County) Hauer SSP2
- Today (2025)
- 97,090 people
- By 2030
- 100,452 · +3.5%
- By 2040
- 106,544 · +9.7%
- By 2050
- 111,218 · +14.6%
- By 2075
- 121,695 · +25.3%
- By 2100
- 123,683 · +27.4%
Race, ethnicity, and origin ACS 2023
- Neighborhood character
- Diverse neighborhood (Simpson 0.62)
- Race & ethnicity
- White 51% Hispanic / Latino 32% Black 13% Two or more races 11%
- Hispanic origin (detail)
- Mexican 30%
- Common ancestry
- Slovak 2% Lithuanian 1% Iranian 1%
- Foreign-born
- 13% · Canada
- Languages at home
- 75% English-only · Spanish 24%
Political lean MEDSL · Hunt
- 2024 margin
- Solid R (+55.5) · D 21.9% · R 77.4%
- 2008→2024 swing
- -14.9pp toward R · 2008: -40.6pp · 2024: -55.5pp
- All cycles
- 2024: R+55.5 2020: R+52.5 2016: R+56.3 2012: R+51.2 2008: R+40.6
Not yet ingested
- Civics
- —
Market trends
- HPI YoY
- ▼ -88.45%
- Current HPI
- 339.0287
- Rent YoY
- ▲ 0.62%
- Metro
- Dallas-Fort Worth-Arlington, TX
- State GDP YoY
- ▲ 3.95%
- F500 in state
- 110
Industry mix (Fortune 500 HQ in TX)
| Industry | F500 HQs | Revenue |
|---|---|---|
| Energy | 16 | $1,198B |
|
||
| Technology | 5 | $198B |
|
||
| Engineering / Construction | 4 | $72B |
|
||
| Energy Services | 3 | $60B |
|
||
| Utilities | 3 | $41B |
|
||
| Healthcare | 2 | $330B |
|
||
Price history
-11.3% since first listed4 events — show timeline
- 2026-05-11 Price Changed $110,000 NTREIS
- 2026-05-05 Price Changed $120,000 NTREIS
- 2026-04-28 Price Changed $121,500 NTREIS
- 2026-04-09 Listed $123,947 NTREIS
Property tax history
+12.3%/yrLatest (2025): $2,408 · +1.3% YoY. Source: county tax records.
Cash-flow waterfall
monthlySold comps — $/sqft
last 12 mo · ≤1 miLoading sold comps…