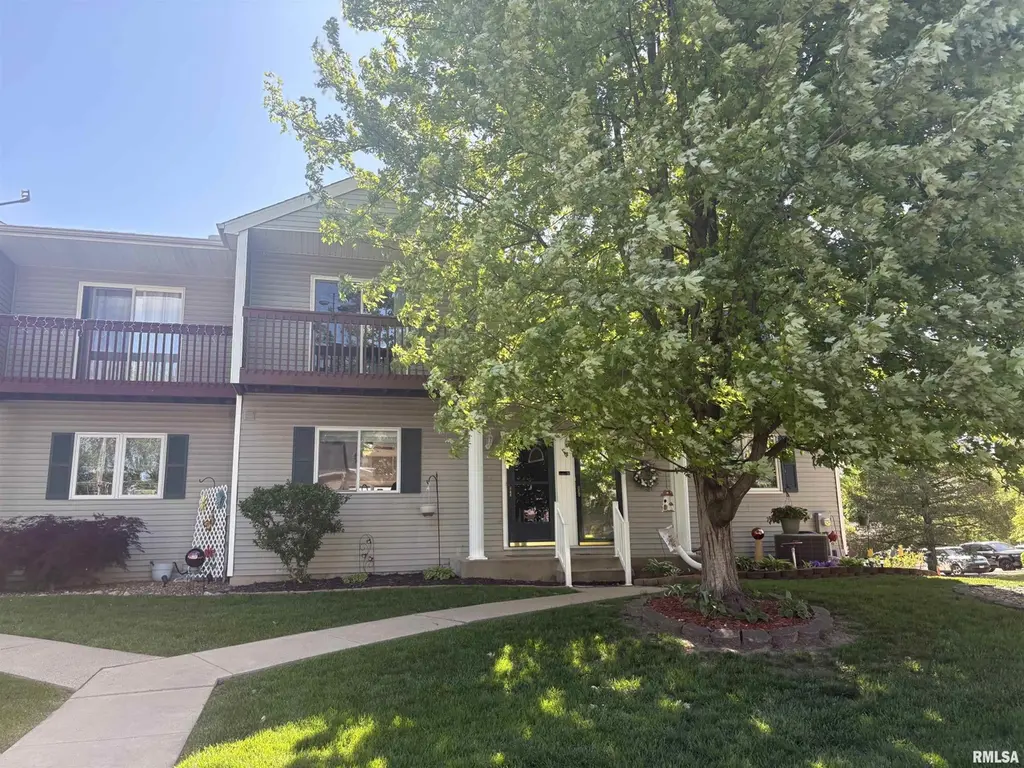
3510 N Kingston Dr #2 · Peoria, IL
Flood risk No data
- FEMA flood zone
- —
- Chance of flooding over 30 yrs
- —
- Est. flood insurance / yr
- —
Fire risk No data
- Est. fire insurance / yr
- —
Heat risk No data
- Hot days now (above threshold)
- —
- Hot days in 30 yrs
- —
Wind risk No data
- Chance of severe wind over 30 yrs
- —
Air-quality risk No data
- Unhealthy air days now
- —
- Unhealthy air days in 30 yrs
- —
Risk factors via First Street. Map © Google.
Why this score? — see what drove the F grade
The composite is a weighted blend of 9 inputs, each scored 0–100. Each bar is that input's sub-score; the figure is the points it added to the 100-point composite (weight × sub-score).
- Cash flow +9.8/30.0
- ARV discount +7.0/15.0
- 1% rule +4.4/10.0
- Livability +3.7/5.0
- Rent growth +3.1/5.0
- DSCR +2.8/10.0
- Condition / age +2.5/5.0
- Schools +1.1/10.0
- Appreciation +0.0/10.0
$127,500
🖨 Deal sheet (PDF) 📄 Offer letter ✓ Due diligence
Listing remarks MLS
Move right into this 2 Bedroom condo in Central Peoria with great access to the interstate. The main level offers an open feel with a fully applianced kitchen with plenty of cabinetry & a pantry. The large living room with lovely wood floors has a walkout to your rear deck. The upper level provides a good size master Bed/ bath & a laundry room. A second bedroom with a big closet offers a walkout deck. 2 stall garage in lower level with a finished room as you enter.
Key facts
- 1,840 sq ft lot
- 2 garage spots
- Built 1997
Property features AI
Finance
- Other: Zoning: R6; Subdivision: Forest Ridge
- HOA & community: HOA fee (approx. $60); HOA covers grounds and road maintenance, snow removal, common area maintenance and trash
Exterior
- Parking: Attached 2-car garage; Private parking; Street parking; Underground parking
- Utilities: Public water; Public sewer
- Home design: Single-family residence; Two stories; Entry on main level; Shingle roof
- Construction: Built in 1997; Shingle roof
- Exterior features: Level lot; Paved private road
Interior
- Kitchen: Dishwasher; Disposal; Microwave; Refrigerator; Water softener (owned)
- Bedrooms: 2 bedrooms (both on upper level)
- Flooring: Carpet in bedrooms; Hardwood in great room; Laminate in kitchen, laundry and entry; Tile in basement office
- Bathrooms: 1 full bath; 1 half bath
- Heating & cooling: Central air conditioning; Electric forced-air heating; Electric water heater
- Interior features: Cable available; Ceiling fans; Finished partial basement
- Laundry & utility: Washer; Dryer
Neighborhood map
What this means for you Summary
Snapshot
- This is a 2-bed/2.0-bath single-family listed at $128k.
Deal economics
- At list price, monthly cash flow is $-82 ($-983/yr) — negative.
- To cash-flow at today's rent, offer at most $113k (11.3% below list).
- To meet the 1% rule (rent ≥ 1% of price), the offer needs to be $120k (5.7% below list).
- Recommended offer: $113k (11.3% below list) — sets the bar for cash-flow.
Location & tenants
- Location reads 73/100 on livability (#270 in IL) — a middle-class / working-renter tenant base. Strengths: commute A+, cost of living A+, housing A+; Watch: employment D+, crime F.
- Peoria SD 150 (urban): math 11% / reading 14% proficiency, ranked #554 of 620 in IL (top 89%) — low school quality limits family demand, transient renter base, plan for 1-2y turnover; 70% free/reduced lunch — lower-income household profile, screen leases tightly.
- Zoned schools: Dr Maude A Sanders Primary School (math 2% / reading 2%, grade F, #1,927 of 2,056 statewide, top 100%, 396 students, 0% FRL); Sterling Middle School (math 0% / reading 4%, grade F, #664 of 665 statewide, top 100%, 385 students, 0% FRL); Peoria High School (math 4% / reading 7%, grade F, #609 of 693 statewide, top 88%, 1,447 students, 0% FRL) — zoned schools average 0% FRL vs 70% district-wide (70 pts lower); this property's tenant base skews higher-income than the district average.
- Market conditions: Rents rising (+2.3%/yr); 180 active listings in the ZIP; 16 comparable units currently listed for rent nearby; rentals at typical pace (median 14d on market — plan ~3-4 weeks tenant-placement turnaround); 73 units permitted in Peoria County in 2024 (0 in 5+ unit buildings).
Forward outlook
- Local home prices are declining (-3.0%/yr); year-one equity from $882 of loan paydown is wiped out by about $4k of value loss. Plan a longer hold.
- Peoria County population projected at -11% by 2050 — secular population decline; favor cash flow + early exit over multi-decade hold.
Negotiation context
- Only 1 days on market — expect competitive offers; lowballing is unlikely to land.
- 2 sale attempts since 22y ago; this cycle's ask is 28% above the opening price — seller raised mid-cycle; expect resistance to lowballs.
- Current owner paid $103k; 24% above their basis — modest negotiation headroom, anchor on the comps not their cost.
Questions for the listing agent
- What do current leases actually rent for vs. the listed asking? Can we see a recent rent roll and the last 12 months of T-12 income?
- What does the HOA fee cover, when was the last increase, and are there any pending special assessments or reserve-fund shortfalls?
- Is there a deadline driving the sale (1031 exchange, divorce, estate, relocation)? That informs how much negotiation room exists.
- Schools are F-rated, which usually means shorter tenancies and higher turnover. Who's the typical renter profile here, and what's been the actual vacancy rate?
- Crime grade is F in this area — have there been break-ins, vandalism, or insurance claims at this property in the last 3 years? What carrier currently insures it and at what premium?
- The area grade is low — what's the realistic commute time and amenity access for the typical tenant pool here? Any planned neighborhood developments (good or bad) we should know about?
- What's the average days-on-market for RENTAL listings here right now (not sales)? A rising rental-DOM trend means longer vacancies and softer asking-rent achievability than the comps imply.
- What's the recent tenant-quality profile in this submarket — average credit score on applications, eviction rate, late-payment / NSF rate, and stable-employment percentage? A property-management company in the area should have these aggregated.
- How much new for-sale + rental construction is in the pipeline within 1–3 miles? Heavy new supply typically softens prices + rents 12–24 months out; constrained supply supports both.
Investment metrics
- 1% rule
- 0.94% ✗
- Cap rate
- 5.52%
- Cash-on-cash
- -2.75%
- DSCR
- 0.88
- GRM
- 8.8
CMA / ARV
- ARV (on-the-fly)
- $126,000
- Comps found
- 12
Show comp detail 12 sales within ~0.75 mi
| Address | Dist | Beds/Ba | Sqft | Sold | Price | $/sf | Match |
|---|---|---|---|---|---|---|---|
| 3510 N Kingston Dr #4 | 0.00mi | 2/1.5 | 1,321 (+10%) | 6mo | $134,230 | $102 | 76 |
| 3347 W Saymore Ln | 0.40mi | 2/2.0 | 1,241 (+3%) | 3mo | $141,000 | $114 | 73 |
| 3311 W Richwoods Blvd | 0.31mi | 3/2.0 (+1) | 1,230 (+2%) | 6mo | $151,000 | $123 | 71 |
| 3510 N Kingston Dr #5 | 0.00mi | 2/1.5 | 1,360 (+13%) | 6mo | $100,000 | $74 | 71 |
| 3510 N Elmcroft Ter | 0.30mi | 3/1.0 (+1) | 1,092 (-9%) | 1mo | $136,000 | $125 | 61 |
| 3423 N EL Vista Ave | 0.50mi | 3/1.0 (+1) | 1,183 (-1%) | 5mo | $100,000 | $85 | 61 |
| 2928 N Renwood Ave | 0.72mi | 3/2.0 (+1) | 1,238 (+3%) | 1mo | $129,500 | $105 | 55 |
| 3421 N Rockwood Rd | 0.38mi | 3/1.0 (+1) | 1,332 (+11%) | 3mo | $145,900 | $110 | 53 |
| 3014 N Renwood Ave | 0.68mi | 3/1.0 (+1) | 1,254 (+4%) | 2mo | $139,000 | $111 | 50 |
| 2202 W Tripp Ave | 0.69mi | 2/1.0 | 1,296 (+8%) | 5mo | $31,000 | $24 | 47 |
| 4011 N Sterling Ave | 0.54mi | 3/1.5 (+1) | 1,040 (-13%) | 5mo | $105,000 | $101 | 41 |
| 3021 N Mission Rd | 0.72mi | 3/2.0 (+1) | 1,380 (+15%) | 5mo | $88,000 | $64 | 32 |
Match score weights: distance 35% · size 25% · config 20% · recency 20%. Top-matched comps best support the ARV.
Projected returns pro-forma
-3.0% appreciation · 2.3% rent growth · sell at horizon
- IRR
- -21.7%
- Equity multiple
- 0.25×
- Total profit
- $-26,608
- Equity at exit
- $19,011
- IRR
- -17.3%
- Equity multiple
- 0.08×
- Total profit
- $-32,841
- Equity at exit
- $11,024
Cash invested: $35,700 (down + closing). Projections, not guarantees.
Landlord ↔ Tenant lean methodology
- Overall (STATE)
- 43 Moderately Tenant-Leaning
- State Illinois
- 43 Moderately Tenant-Leaning · D+7
- County
- — inherits STATE
- City
- — inherits STATE
ZIP-level market 61604
- Home prices YoY
- -24.6%
- Rents YoY
- 2.3%
- Active inventory
- 180
- Price-to-rent
- 8.8×
Monthly cashflow live
- Estimated rent
- $1,202 high interval (Pro) →
- Mortgage (P&I)
- −$669
- Tax from tax record
- −$250 /mo · $3,000/yr
- Insurance
- −$53
- HOA
- −$60
- Vacancy / Maint / Mgmt
- −$252
- Net cashflow
- $-82
Break-even live
Sensitivity live
| Price | -10% $-10 | -5% $-46 | +0% $-82 | +5% $-118 | +10% $-154 |
|---|---|---|---|---|---|
| Rent | -10% $-177 | -5% $-129 | +0% $-82 | +5% $-34 | +10% $13 |
| Rate | -1.0pp $-18 | -0.5pp $-49 | base $-82 | +0.5pp $-115 | +1.0pp $-149 |
UW: 25.0% down · 7.5% · 30yr · 1.5% tax · 5.0% vac · 8.0% maint · 8.0% mgmt
Financing live
Cash to close
- Down payment
- $31,875
- Closing costs
- $3,825
- Reserves months
- —
- Total cash needed
- —
Loan-product check · same deal, 3 products live
Conventional
25% down · 7.5% · 30yr
- Down + closing
- —
- Monthly P&I
- —
- Monthly cashflow
- —
- DSCR
- —
- Eligible?
- —
Personal DTI + credit; lowest rate.
DSCR
20% down · 8.5% · 30yr
- Down + closing
- —
- Monthly P&I
- —
- Monthly cashflow
- —
- DSCR
- —
- Eligible?
- —
No personal income docs; deal must DSCR.
Hard money
10% down · 12.0% · 12mo
- Down + closing
- —
- Monthly P&I
- —
- Monthly cashflow
- —
- DSCR
- —
- Eligible?
- —
Short-term bridge; refi at stabilization.
Rent comps 16 comps
| Address | Beds | Baths | Sqft | Rent | $/sqft | DOM | Units | Dist |
|---|---|---|---|---|---|---|---|---|
| 3601 N Kingston Dr Peoria, IL | 2.0 | 2.0 | 1030 | $1,420 | $1.38 | 14d | 3 | 0.07mi |
| 2700 W Forrest Hill Ave Peoria, IL | 2.0 | 1.0 | 850 | $850 | $1.00 | 44d | 1 | 0.48mi |
| 2805 W Larchmont Ln Peoria, IL | 1.0–2.0 | 1.0 | 695 | $1,060 | $1.53 | 14d | 3 | 0.51mi |
| 3438 W Villa Rdg Unit A Peoria, IL | 2.0 | 1.5 | 874 | $1,200 | $1.37 | 22d | 1 | 0.55mi |
| 3444 W Dorchester Rdg Peoria, IL | 2.0 | 2.0 | 1089 | $1,275 | $1.17 | 14d | 1 | 0.58mi |
| 2511 W Wardcliffe Dr Unit H Peoria, IL | 2.0 | 1.0 | 800 | $875 | $1.09 | 44d | 1 | 0.63mi |
| 2920 N Rockwood Dr Apt B Peoria, IL | 2.0 | 1.0 | 800 | $895 | $1.12 | 14d | 1 | 0.64mi |
| 3629 N Leroy Ave Unit A Peoria, IL | 2.0 | 1.0 | 1000 | $1,150 | $1.15 | 44d | 1 | 0.67mi |
| 2600 N Lavalle Ct Peoria, IL | 1.0–3.0 | 1.0–2.0 | 803 | $1,000 | $1.25 | 14d | 26 | 0.91mi |
| 2610 N Renwood Ave Peoria, IL | 2.0 | 1.0 | 904 | $1,300 | $1.44 | 14d | 1 | 0.93mi |
| 4010 N Brandywine Dr Peoria, IL | 1.0–2.0 | 1.0–2.0 | 797 | $1,082 | $1.36 | 14d | 17 | 1.15mi |
| 2109 N Abbey Cir Peoria, IL | 3.0 | 2.0 | 1088 | $1,009 | $0.93 | 14d | 1 | 1.29mi |
| 1915 W Marlene Ave Unit B Peoria, IL | 2.0 | 1.5 | 1200 | $1,275 | $1.06 | 22d | 1 | 1.31mi |
| 2020 W Glen Ave Peoria, IL | 3.0 | 2.0 | 1320 | $1,700 | $1.29 | 14d | 1 | 1.37mi |
| 1413 W Gilbert Ave Peoria, IL | 2.0 | 2.0 | 1428 | $1,500 | $1.05 | 14d | 1 | 1.43mi |
| 1801 N Gentry Ln West Peoria, IL | 3.0 | 1.0 | 1000 | $1,650 | $1.65 | 14d | 1 | 1.48mi |
HOA detail
- Monthly dues
- $60 · $720/yr
Listing history 30 events
-
2026-06-07remarks 693-char remark
-
2026-06-07statusdays on market $127,500 Pending 1 DOM
-
2026-06-03days on market $127,500 Coming Soon 15 DOM
-
2026-06-02days on market $127,500 Coming Soon 14 DOM
-
2026-06-01days on market $127,500 Coming Soon 13 DOM
-
2026-05-31days on market $127,500 Coming Soon 12 DOM
-
2026-05-30days on market $127,500 Coming Soon 11 DOM
-
2026-05-19historical $127,500
-
2022-08-30soldstatus $103,000
-
2022-08-26soldstatus $103,000 Closed 484-char remark
Show marketing remark (484 chars)
Move right into this 2 Bedroom condo in Central Peoria with great access to the interstate. The main level offers an open feel with a fully applianced kitchen with plenty of cabinetry & a pantry. The large living room with lovely wood floors has a walkout to your rear deck. The upper level provides a good size master Bed/ bath & a laundry room. A second bedroom with a big closet offers a walkout deck. 2 stall garage in lower level with a finished room as you enter.
-
2022-08-13status Pending 484-char remark
Show marketing remark (484 chars)
Move right into this 2 Bedroom condo in Central Peoria with great access to the interstate. The main level offers an open feel with a fully applianced kitchen with plenty of cabinetry & a pantry. The large living room with lovely wood floors has a walkout to your rear deck. The upper level provides a good size master Bed/ bath & a laundry room. A second bedroom with a big closet offers a walkout deck. 2 stall garage in lower level with a finished room as you enter.
-
2022-08-11$99,900 Active 484-char remark
Show marketing remark (484 chars)
Move right into this 2 Bedroom condo in Central Peoria with great access to the interstate. The main level offers an open feel with a fully applianced kitchen with plenty of cabinetry & a pantry. The large living room with lovely wood floors has a walkout to your rear deck. The upper level provides a good size master Bed/ bath & a laundry room. A second bedroom with a big closet offers a walkout deck. 2 stall garage in lower level with a finished room as you enter.
-
2021-08-06historical
-
2004-09-01soldstatus $92,000
-
2004-08-27soldstatus $92,000
-
2004-06-25soldstatus $120,000
-
2004-05-06$94,900
-
2003-07-03soldstatus $124,000
-
2003-01-23soldstatus $92,500
-
2001-10-11soldstatus $125,500
-
2001-08-23soldstatus $129,000
-
2001-07-03soldstatus $83,500
-
2001-07-03soldstatus $139,000
-
2000-05-16soldstatus $131,500
-
2000-03-24soldstatus $134,000
-
1999-12-21soldstatus $135,000
-
1999-09-29soldstatus $122,500
-
1998-07-29soldstatus $121,500
-
1998-06-04soldstatus $128,000
-
1998-05-20soldstatus $96,000
ⓘ Source: listings_history table (triggers on properties + properties_extension) + one-shot
backfill from property_details.listing_events for pre-trigger history.
Tax reassessment forecast IL · Partial reset (capped growth)
- Current annual tax
- $3,000 · $250/mo
- Projected year-2 tax
- $3,000 · $250/mo
- Expected delta
- $0/yr ($0/mo · 0.0%)
ⓘ Screening estimate from a state-policy table — verify with the county assessor before closing.
Nearby sold comps map
Loading sold comps map…
Walkable amenities ~0.75 mi
Loading nearby amenities…
Taxation est. · year 1
- Rental income
- $14,428
- − Mortgage interest
- −$7,142
- − Property taxes
- −$3,000
- − Insurance
- −$638
- − Repairs & maintenance
- −$1,154
- − Management
- −$1,154
- − HOA
- −$720
- − Depreciation
- −$3,709
- Taxable loss
- −$3,089
- Est. tax savings @ 24.0%
- +$741
- After-tax cash flow
- $-242/yr
For passive investors: Depreciation is non-cash, so a rental often shows a tax loss while cash-flowing — sheltering income. Rental losses are passive: they offset passive income freely, and up to $25,000/yr can offset ordinary (W-2) income if you actively participate and your MAGI is under $100k (phasing out to $0 by $150k); unused losses carry forward. On sale, claimed depreciation is recaptured at up to 25%, and gains may owe capital-gains tax (a 1031 exchange can defer both). Figures are a year-1 estimate at your 24.0% rate — not tax advice; consult a CPA.
Schools (NCES district)
- District
- Peoria SD 150
- NCES district ID
- 1731230
- Math proficiency
- 11% ▼ -5.00%
- Reading proficiency
- 14% ▼ -4.00%
- Median HH income
- $41,951
- Composite
- 10.92/100
- National rank
- #9751
- State rank
- #554 of 620 in IL
Livability — Peoria
- Score
- 73/100
- State rank
- #270
- US rank
- #5096
Category grades
Schools grade is shown separately in the Schools card above.
Census & demographics
- Census place
- Peoria, IL
- County
- Peoria County · 120,495 people
- City population
- 114,670
- Metro
- Peoria, IL
- Population (ZIP)
- 28,313
- Household income
- $52,414
- Rent vs Own
- Severe rent burden
- 815.0
Population outlook (Peoria County) Hauer SSP2
- Today (2025)
- 183,007 people
- By 2030
- 179,643 · -1.8%
- By 2040
- 171,782 · -6.1%
- By 2050
- 163,508 · -10.7%
- By 2075
- 140,178 · -23.4%
- By 2100
- 114,493 · -37.4%
Race, ethnicity, and origin ACS 2023
- Neighborhood character
- Diverse neighborhood (Simpson 0.61)
- Race & ethnicity
- White 55% Black 29% Two or more races 10% Hispanic / Latino 7% Asian 2%
- Hispanic origin (detail)
- Mexican 5%
- Common ancestry
- Italian 2% Slovak 1% Iranian 1%
- Foreign-born
- 6% · Canada, China
- Languages at home
- 92% English-only · Spanish 4% Chinese 1% French/Haitian/Cajun 1%
Political lean MEDSL · Peoria
- 2024 margin
- Toss-up / Even · D 51.5% · R 46.9% · Other 1.6%
- 2008→2024 swing
- -9.2pp toward R · 2008: 13.9pp · 2024: 4.7pp
- All cycles
- 2024: D+4.7 2020: D+6.3 2016: D+2.8 2012: D+4.4 2008: D+13.9
Not yet ingested
- Civics
- —
Market trends
- HPI YoY
- ▼ -54.15%
- Current HPI
- 165.8838
- Rent YoY
- ▲ 2.30%
- Metro
- Peoria, IL
- State GDP YoY
- ▲ 1.59%
- F500 in state
- 60
Industry mix (Fortune 500 HQ in IL)
| Industry | F500 HQs | Revenue |
|---|---|---|
| Insurance | 4 | $201B |
|
||
| Consumer Goods | 4 | $87B |
|
||
| Industrial Machinery | 3 | $64B |
|
||
| Healthcare | 2 | $55B |
|
||
| Retail / Pharmacy | 1 | $148B |
|
||
| Agriculture / Food | 1 | $86B |
|
||
Price history
+32.8% since first listed23 events — show timeline
- 2026-05-19 Coming Soon $127,500 RMLSA as Distributed by MLS Grid
- 2022-08-30 Sold (Public Records) $103,000 Public Records
- 2022-08-26 Sold (MLS) $103,000 RMLSA as Distributed by MLS Grid
- 2022-08-13 Pending — RMLSA as Distributed by MLS Grid
- 2022-08-11 Listed $99,900 RMLSA as Distributed by MLS Grid
- 2021-08-06 Listing Removed — RMLSA as Distributed by MLS Grid
- 2004-09-01 Sold (Public Records) $92,000 Public Records
- 2004-08-27 Sold (MLS) $92,000 RMLSA as Distributed by MLS Grid
- 2004-06-25 Sold (Public Records) $120,000 Public Records
- 2004-05-06 Listed $94,900 RMLSA as Distributed by MLS Grid
- 2003-07-03 Sold (Public Records) $124,000 Public Records
- 2003-01-23 Sold (Public Records) $92,500 Public Records
- 2001-10-11 Sold (Public Records) $125,500 Public Records
- 2001-08-23 Sold (Public Records) $129,000 Public Records
- 2001-07-03 Sold (Public Records) $139,000 Public Records
- 2001-07-03 Sold (Public Records) $83,500 Public Records
- 2000-05-16 Sold (Public Records) $131,500 Public Records
- 2000-03-24 Sold (Public Records) $134,000 Public Records
- 1999-12-21 Sold (Public Records) $135,000 Public Records
- 1999-09-29 Sold (Public Records) $122,500 Public Records
- 1998-07-29 Sold (Public Records) $121,500 Public Records
- 1998-06-04 Sold (Public Records) $128,000 Public Records
- 1998-05-20 Sold (Public Records) $96,000 Public Records
Property tax history
+3.8%/yrLatest (2024): $3,000 · +4.8% YoY. Source: county tax records.
Cash-flow waterfall
monthlySold comps — $/sqft
last 12 mo · ≤1 miLoading sold comps…