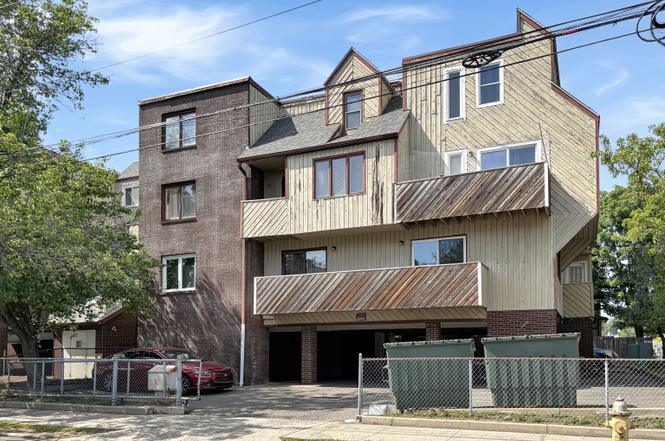
183 Livingston Pl #12 · Bridgeport, CT
Flood risk 5/10 · Moderate
- FEMA flood zone
- X (unshaded)
- Chance of flooding over 30 yrs
- 0.47%
- Est. flood insurance / yr
- $507 – $1,088
Fire risk 1/10 · Minimal
- Est. fire insurance / yr
- $829 – $1,539
Heat risk 6/10 · Moderate
- Hot days now (above 97°F)
- 7 days/yr
- Hot days in 30 yrs
- 15 days/yr
Wind risk 6/10 · Moderate
- Chance of severe wind over 30 yrs
- 41.0%
Air-quality risk 4/10 · Minor
- Unhealthy air days now
- 5 days/yr
- Unhealthy air days in 30 yrs
- 7 days/yr
Risk factors via First Street. Map © Google.
Why this score? — see what drove the D- grade
The composite is a weighted blend of 9 inputs, each scored 0–100. Each bar is that input's sub-score; the figure is the points it added to the 100-point composite (weight × sub-score).
- Cash flow +8.9/30.0
- ARV discount +7.5/15.0
- 1% rule +7.1/10.0
- Livability +4.0/5.0
- Rent growth +2.5/5.0
- Condition / age +2.5/5.0
- DSCR +2.4/10.0
- Schools +1.2/10.0
- Appreciation +0.0/10.0
$159,900
🖨 Deal sheet (PDF) 📄 Offer letter ✓ Due diligence
Listing remarks MLS
Beardsley Park location, Townhouse Unit offers a open concept designed with bright and Large living room . The main floor has an office and Half bath. Master suite located on second floor with walk in closet and Full Bathroom. Washer and dryer Hook up in unit. Sold As Is.Close distance to lake, Shopping and Highway.All Buyers to do their own diligence. Sold as is. Will not qualify for FHA, only Cash Conventional or Construction Loan. Make an offer on this one today before it is gone.
Key facts
- Walk-in closet
- Bonus room
- Hardwood floors
Tags
Property features AI
Finance
- Other: Unit is one of 18 in the complex; located on floor number 3
- HOA & community: Monthly HOA fee ($590); HOA covers grounds maintenance, trash pickup, snow removal, water, sewer, and property management; Has homeowners association; Pets allowed with restrictions (confirm with HOA); Professional off-site property management
Exterior
- Parking: Parking garage; 2 garage spaces
- Utilities: Public water connected; Public sewer connected; Natural gas service
- Home design: Condominium in Livingston House; Condo/Co-op for sale; Unit spans 2 levels
- Construction: Frame construction
- Exterior features: Brick and wood siding; Level lot
Interior
- Kitchen: Oven/Range; Range hood; Refrigerator; Dishwasher
- Bedrooms: 2 bedrooms (unit is on 2 levels)
- Bathrooms: 1 full bath; 1 half bath
- Heating & cooling: Hot air heating; Central air conditioning; 30-gallon hot water tank (natural gas)
- Interior features: Central air conditioning; No basement
Neighborhood map
What this means for you Summary
Snapshot
- This is a 1-bed/1.5-bath condo listed at $160k.
Deal economics
- At list price, monthly cash flow is $-130 ($-2k/yr) — negative.
- To cash-flow at today's rent, offer at most $137k (14.4% below list).
- Meets the 1% rule at list price ($2k rent vs $160k).
- Recommended offer: $137k (14.4% below list) — sets the bar for cash-flow.
Location & tenants
- Location reads 81/100 on livability (#15 in CT, #1,374 nationally) — a professional / high-income tenant draw. Strengths: amenities A+, commute A+, health & safety A+; Watch: crime C-, employment D+, schools D-.
- Bridgeport School District (urban): math 9% / reading 19% proficiency, ranked #151 of 153 in CT (top 99%) — low school quality limits family demand, transient renter base, plan for 1-2y turnover; 97% free/reduced lunch — lower-income household profile, screen leases tightly.
- Market conditions: 69 active listings in the ZIP; 40 comparable units currently listed for rent nearby; rentals at typical pace (median 26d on market — plan ~3-4 weeks tenant-placement turnaround); 40% of comp listings sitting > 30 days — soft ceiling on asking rent; 852 units permitted in Greater Bridgeport Planning Region in 2024 (698 in 5+ unit buildings).
- This rent runs 45% of the median local income ($52k/yr) — at the standard rent-burdened threshold; future hikes will face affordability resistance.
Forward outlook
- Local home prices are declining (-3.0%/yr); year-one equity from $1k of loan paydown is wiped out by about $5k of value loss. Plan a longer hold.
Negotiation context
- Only 4 days on market — expect competitive offers; lowballing is unlikely to land.
- 6 sale attempts since 21y ago with the ask held roughly flat each time — persistent listings suggest the price (not the market) is what's stuck; bring a comps-based counter.
- Current owner paid $38k; list at $160k implies a 326% gain — meaningful room to come down on a strong offer.
Risks & watch-outs
- Watch-outs: HOA is 31% of rent.
- Climate carrying-cost: moderate flood risk; major wind risk, 41% chance of damaging wind over 30y; extreme-heat days projected 7→15/yr by 2055 (HVAC capex compounding) — expect insurance premiums to compound above CPI over the hold.
Questions for the listing agent
- What do current leases actually rent for vs. the listed asking? Can we see a recent rent roll and the last 12 months of T-12 income?
- What does the HOA fee cover, when was the last increase, and are there any pending special assessments or reserve-fund shortfalls?
- Any open or pending special assessments — roof, HVAC, plumbing, elevator, façade? What's the per-unit balance and payoff schedule, and is the seller paying it off at close or rolling it to the buyer?
- Is there a deadline driving the sale (1031 exchange, divorce, estate, relocation)? That informs how much negotiation room exists.
- Schools are D-rated, which usually means shorter tenancies and higher turnover. Who's the typical renter profile here, and what's been the actual vacancy rate?
- The area grade is low — what's the realistic commute time and amenity access for the typical tenant pool here? Any planned neighborhood developments (good or bad) we should know about?
- What's the average days-on-market for RENTAL listings here right now (not sales)? A rising rental-DOM trend means longer vacancies and softer asking-rent achievability than the comps imply.
- What's the recent tenant-quality profile in this submarket — average credit score on applications, eviction rate, late-payment / NSF rate, and stable-employment percentage? A property-management company in the area should have these aggregated.
- How much new apartment / multifamily construction is in the pipeline within 1–3 miles? Heavy new supply (>2% of stock underway) typically softens rents 12–24 months out; light construction supports rent growth.
Investment metrics
- 1% rule
- 1.21% ✓
- Cap rate
- 5.32%
- Cash-on-cash
- -3.49%
- DSCR
- 0.84
- GRM
- 6.9
CMA / ARV
No comps found within radius.
Projected returns pro-forma
-3.0% appreciation · 3.0% rent growth · sell at horizon
- IRR
- -21.8%
- Equity multiple
- 0.24×
- Total profit
- $-33,827
- Equity at exit
- $23,842
- IRR
- -15.0%
- Equity multiple
- 0.14×
- Total profit
- $-38,630
- Equity at exit
- $13,825
Cash invested: $44,772 (down + closing). Projections, not guarantees.
Landlord ↔ Tenant lean methodology
- Overall (STATE)
- 27 Tenant-Leaning
- State Connecticut
- 27 Tenant-Leaning · D+7
- County
- — inherits STATE
- City
- — inherits STATE
ZIP-level market 06610
- Home prices YoY
- -7.5%
- Active inventory
- 69
- Price-to-rent
- 6.9×
Monthly cashflow live
- Estimated rent
- $1,931 high interval (Pro) →
- Mortgage (P&I)
- −$839
- Tax from tax record
- −$160 /mo · $1,926/yr
- Insurance
- −$67
- HOA
- −$590
- Vacancy / Maint / Mgmt
- −$406
- Net cashflow
- $-130
Break-even live
Sensitivity live
| Price | -10% $-40 | -5% $-85 | +0% $-130 | +5% $-175 | +10% $-221 |
|---|---|---|---|---|---|
| Rent | -10% $-283 | -5% $-206 | +0% $-130 | +5% $-54 | +10% $22 |
| Rate | -1.0pp $-50 | -0.5pp $-89 | base $-130 | +0.5pp $-171 | +1.0pp $-214 |
UW: 25.0% down · 7.5% · 30yr · 1.5% tax · 5.0% vac · 8.0% maint · 8.0% mgmt
Financing live
Cash to close
- Down payment
- $39,975
- Closing costs
- $4,797
- Reserves months
- —
- Total cash needed
- —
Loan-product check · same deal, 3 products live
Conventional
25% down · 7.5% · 30yr
- Down + closing
- —
- Monthly P&I
- —
- Monthly cashflow
- —
- DSCR
- —
- Eligible?
- —
Personal DTI + credit; lowest rate.
DSCR
20% down · 8.5% · 30yr
- Down + closing
- —
- Monthly P&I
- —
- Monthly cashflow
- —
- DSCR
- —
- Eligible?
- —
No personal income docs; deal must DSCR.
Hard money
10% down · 12.0% · 12mo
- Down + closing
- —
- Monthly P&I
- —
- Monthly cashflow
- —
- DSCR
- —
- Eligible?
- —
Short-term bridge; refi at stabilization.
Rent comps 40 comps
| Address | Beds | Baths | Sqft | Rent | $/sqft | DOM | Units | Dist |
|---|---|---|---|---|---|---|---|---|
| 183 Livingston Pl #1 Bridgeport, CT | 2.0 | 1.5 | 1175 | $1,950 | $1.66 | 45d | 1 | 0.01mi |
| 220 Alpine St Unit 222 3rd floor Bridgeport, CT | 2.0 | 1.0 | 900 | $2,000 | $2.22 | 45d | 1 | 0.15mi |
| 125 Louisiana Ave #125 Bridgeport, CT | 2.0 | 1.0 | 1448 | $1,750 | $1.21 | 45d | 1 | 0.17mi |
| 120 Huntington Tpke #809 Bridgeport, CT | 2.0 | 1.0 | 940 | $2,100 | $2.23 | 5d | 1 | 0.26mi |
| 282 Texas Ave Unit Nob Bridgeport, CT | 2.0 | 1.0 | 980 | $2,000 | $2.04 | 16d | 1 | 0.26mi |
| 35 Nob Hill Cir Unit D Bridgeport, CT | 2.0 | 1.0 | 900 | $2,050 | $2.28 | 45d | 1 | 0.29mi |
| 231 Goddard Ave Unit 2ND Bridgeport, CT | 2.0 | 1.0 | 950 | $2,100 | $2.21 | 5d | 1 | 0.54mi |
| 119 Dupont Pl Bridgeport, CT | 2.0 | 1.0 | 820 | $2,000 | $2.44 | 45d | 1 | 0.54mi |
| 116 Hastings St Bridgeport, CT | 2.0 | 1.5 | 857 | $2,400 | $2.80 | 16d | 1 | 0.54mi |
| 191 DuPont Pl Bridgeport, CT | 2.0 | 1.0 | 810 | $1,850 | $2.28 | 25d | 1 | 0.58mi |
| 197-199 Dupont Pl Bridgeport, CT | 1.0 | 1.0 | 976 | $1,700 | $1.74 | 5d | 1 | 0.60mi |
| 577 Sylvan Ave Unit 201 Bridgeport, CT | 2.0 | 2.0 | 875 | $2,075 | $2.37 | 16d | 1 | 0.63mi |
| 126 Goddard Ave Unit B Bridgeport, CT | 2.0 | 1.0 | 1000 | $1,995 | $2.00 | 5d | 1 | 0.64mi |
| 66 Dodd Ave Unit 2 Bridgeport, CT | 2.0 | 1.0 | 728 | $2,450 | $3.37 | 13d | 1 | 0.68mi |
| 66 Dodd Ave Bridgeport, CT | 1.0 | 1.0 | 728 | $2,150 | $2.95 | 13d | 1 | 0.68mi |
| 600 Bond St Unit 113 Bridgeport, CT | 2.0 | 1.0 | 893 | $3,000 | $3.36 | 45d | 1 | 0.70mi |
| 36 Carver St Unit 1 Bridgeport, CT | 2.0 | 1.0 | 1094 | $2,200 | $2.01 | 25d | 1 | 0.73mi |
| 22-26 Carver St Bridgeport, CT | 2.0 | 1.0 | 1094 | $2,200 | $2.01 | 13d | 1 | 0.74mi |
| 957 William St Unit B Bridgeport, CT | 2.0 | 1.0 | 766 | $1,700 | $2.22 | 45d | 1 | 0.82mi |
| 329 Orchard St Unit 2ND FLOOR Bridgeport, CT | 2.0 | 1.0 | 990 | $1,800 | $1.82 | 45d | 1 | 0.83mi |
| 371 Dover St Unit 371 Bridgeport, CT | 2.0 | 1.0 | 900 | $2,100 | $2.33 | 45d | 1 | 0.90mi |
| 268 Bond St Bridgeport, CT | 2.0 | 1.0 | 900 | $2,200 | $2.44 | 45d | 1 | 0.95mi |
| 614 Earl Ave Bridgeport, CT | 2.0 | 1.0 | 748 | $2,300 | $3.07 | 45d | 1 | 0.99mi |
| 591 Pearl Harbor St Bridgeport, CT | 2.0 | 1.0 | 900 | $1,750 | $1.94 | 5d | 1 | 1.00mi |
| 50 Trumbull Ave Bridgeport, CT | 2.0 | 1.0 | 1200 | $2,400 | $2.00 | 25d | 1 | 1.01mi |
| 1333 E Main St Apt 1 Bridgeport, CT | 2.0 | 1.0 | 700 | $1,700 | $2.43 | 5d | 1 | 1.04mi |
| 1333 E Main St #5 Bridgeport, CT | 2.0 | 1.0 | 700 | $1,650 | $2.36 | 5d | 1 | 1.04mi |
| 476 Brooks St Unit 2-478 Bridgeport, CT | 2.0 | 1.0 | 963 | $1,750 | $1.82 | 25d | 1 | 1.06mi |
| 70 Lindley St Unit 3rd Floor Bridgeport, CT | 2.0 | 1.0 | 800 | $1,980 | $2.48 | 45d | 1 | 1.07mi |
| 46 Hayes St Unit 3 Bridgeport, CT | 2.0 | 1.0 | 992 | $1,900 | $1.92 | 5d | 1 | 1.13mi |
| 980 Lindley St Unit 304F Bridgeport, CT | 2.0 | 2.0 | 936 | $2,200 | $2.35 | 25d | 1 | 1.14mi |
| 164 French St Unit 3 Bridgeport, CT | 2.0 | 1.0 | 1068 | $1,750 | $1.64 | 45d | 1 | 1.16mi |
| 184 Pearl Harbor St Unit 2 Bridgeport, CT | 2.0 | 1.0 | 850 | $2,000 | $2.35 | 25d | 1 | 1.16mi |
| 1254 Pembroke St Unit 1st Floor Bridgeport, CT | 2.0 | 1.0 | 738 | $1,850 | $2.51 | 16d | 1 | 1.16mi |
| 619 Shelton St Fl R Bridgeport, CT | 2.0 | 1.0 | 837 | $2,050 | $2.45 | 45d | 1 | 1.18mi |
| 201 French St Unit 3 Bridgeport, CT | 2.0 | 1.0 | 1094 | $2,000 | $1.83 | 25d | 1 | 1.19mi |
| 380 Gurdon St Unit 1 Bridgeport, CT | 1.0 | 1.0 | 744 | $2,000 | $2.69 | 23d | 1 | 1.22mi |
| 530 Jane St Unit 2 Bridgeport, CT | 2.0 | 1.0 | 800 | $2,200 | $2.75 | 45d | 1 | 1.26mi |
| 184 Park St Bridgeport, CT | 2.0 | 1.0 | 1200 | $2,000 | $1.67 | 45d | 1 | 1.27mi |
| 245 Brooks St Unit 3R Bridgeport, CT | 2.0 | 1.0 | 1000 | $1,750 | $1.75 | 25d | 1 | 1.28mi |
HOA detail condo
- Monthly dues
- $590 · $7,080/yr
- Assessments
- None detected in remarks — confirm with the listing agent.
Listing history 3 events
-
2026-06-22days on market $159,900 Active 4 DOM
-
2026-06-18remarks 699-char remark
-
2026-06-18$159,900 Active 1 DOM
ⓘ Source: listings_history table (triggers on properties + properties_extension) + one-shot
backfill from property_details.listing_events for pre-trigger history.
Tax reassessment forecast CT · Partial reset (capped growth)
- Current annual tax
- $1,926 · $160/mo
- Projected year-2 tax
- $2,674 · $223/mo
- Expected delta
- +$748/yr (+$62/mo · 38.8%)
ⓘ Screening estimate from a state-policy table — verify with the county assessor before closing.
Climate risk First Street
- Flood 5/10 Major FEMA zone X (unshaded) · 47% chance over 30 yrs
- Wildfire 1/10 Low
- Heat 6/10 Major 7 d/yr ≥97°F today · 15 d/yr by 30 yrs out
- Wind 6/10 Major 41% chance of damaging wind over 30 yrs
- Air quality 4/10 Moderate 5 unhealthy d/yr today · 7 by 30 yrs out
Nearby sold comps map
Loading sold comps map…
Walkable amenities ~0.75 mi
Loading nearby amenities…
Taxation est. · year 1
- Rental income
- $23,174
- − Mortgage interest
- −$8,957
- − Property taxes
- −$1,926
- − Insurance
- −$800
- − Repairs & maintenance
- −$1,854
- − Management
- −$1,854
- − HOA
- −$7,080
- − Depreciation
- −$4,652
- Taxable loss
- −$3,948
- Est. tax savings @ 24.0%
- +$948
- After-tax cash flow
- $-613/yr
For passive investors: Depreciation is non-cash, so a rental often shows a tax loss while cash-flowing — sheltering income. Rental losses are passive: they offset passive income freely, and up to $25,000/yr can offset ordinary (W-2) income if you actively participate and your MAGI is under $100k (phasing out to $0 by $150k); unused losses carry forward. On sale, claimed depreciation is recaptured at up to 25%, and gains may owe capital-gains tax (a 1031 exchange can defer both). Figures are a year-1 estimate at your 24.0% rate — not tax advice; consult a CPA.
Schools (NCES district)
- District
- Bridgeport School District
- NCES district ID
- 0900450
- Math proficiency
- 9% ▼ -7.00%
- Reading proficiency
- 19% ▼ -10.00%
- Median HH income
- $41,507
- Composite
- 12.09/100
- National rank
- #9656
- State rank
- #151 of 153 in CT
Livability — Bridgeport
- Score
- 81/100
- State rank
- #15
- US rank
- #1374
Category grades
Schools grade is shown separately in the Schools card above.
Census & demographics
- Census place
- Bridgeport, CT
- County
- Fairfield County · 765,532 people
- City population
- 149,153
- Metro
- Bridgeport-Stamford-Norwalk, CT
- Population (ZIP)
- 22,020
- Household income
- $51,634
- Rent vs Own
- Severe rent burden
- 1368.0
Population outlook (Greater Bridgeport County) Hauer SSP2
- By 2040
- 365,581
Race, ethnicity, and origin ACS 2023
- Neighborhood character
- Diverse neighborhood (Simpson 0.65)
- Race & ethnicity
- Hispanic / Latino 51% Black 23% White 20% Two or more races 14% Asian 3% Native American 1%
- Hispanic origin (detail)
- Mexican 3% Puerto Rican 30% Dominican 6%
- Common ancestry
- Romanian 4% Estonian 3% Hispanic 2%
- Foreign-born
- 31% · Canada, Jamaica, Vietnam
- Languages at home
- 47% English-only · Spanish 40% Other Indo-European 5% Russian/Polish/Slavic 3%
Political lean MEDSL · Greater Bridgeport
- 2024 margin
- Strong D (+23.3) · D 60.9% · R 37.6% · Other 1.5%
- All cycles
- 2024: D+23.3
Not yet ingested
- Civics
- —
Market trends
- HPI YoY
- ▼ -29.78%
- Current HPI
- 370.1432
- Rent YoY
- —
- Metro
- Bridgeport-Stamford-Norwalk, CT
- State GDP YoY
- ▲ 1.06%
- F500 in state
- 38
Industry mix (Fortune 500 HQ in CT)
| Industry | F500 HQs | Revenue |
|---|---|---|
| Industrial Machinery | 4 | $38B |
|
||
| Insurance | 3 | $71B |
|
||
| Financial Services | 2 | $25B |
|
||
| Transportation / Logistics | 2 | $18B |
|
||
| Healthcare | 1 | $247B |
|
||
| Telecommunications | 1 | $55B |
|
||
Price history
+33.4% since first listed14 events — show timeline
- 2026-06-17 Listed $159,900 Smart MLS
- 2018-06-22 Sold (MLS) $37,500 Smart MLS
- 2018-06-02 Listing Removed — Smart MLS
- 2018-05-07 Relisted — Smart MLS
- 2018-04-15 Pending — Smart MLS
- 2018-03-28 Listed $41,000 Smart MLS
- 2010-06-23 Sold (Public Records) $25,000 Public Records
- 2009-07-26 Listing Removed — Smart MLS
- 2009-07-26 Listing Removed — Smart MLS
- 2006-07-20 Listed $104,900 Smart MLS
- 2006-07-20 Listed $104,900 Smart MLS
- 2006-07-07 Listing Removed — Smart MLS
- 2006-07-05 Sold (Public Records) $130,000 Public Records
- 2005-06-02 Listed $119,900 Smart MLS
Property tax history
-5.7%/yrLatest (2023): $1,926 · +0.0% YoY. Source: county tax records.
Cash-flow waterfall
monthlySold comps — $/sqft
last 12 mo · ≤1 miLoading sold comps…