 🌊 Lakefront
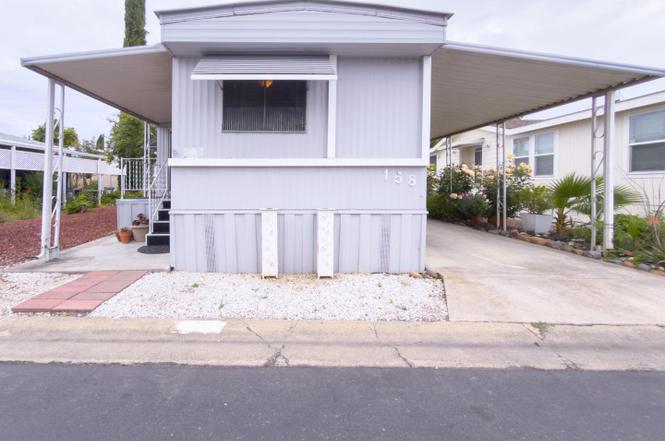
3901 Lake Rd #158 · West Sacramento, CA
Flood risk 6/10 · Moderate
- FEMA flood zone
- —
- Chance of flooding over 30 yrs
- 0.26%
- Est. flood insurance / yr
- —
Fire risk 5/10 · Moderate
- Est. fire insurance / yr
- $659 – $1,223
Heat risk 7/10 · Major
- Hot days now (above 103°F)
- 7 days/yr
- Hot days in 30 yrs
- 14 days/yr
Wind risk 1/10 · Minimal
- Chance of severe wind over 30 yrs
- —
Air-quality risk 10/10 · Severe
- Unhealthy air days now
- 29 days/yr
- Unhealthy air days in 30 yrs
- 31 days/yr
Risk factors via First Street. Map © Google.
Why this score? — see what drove the B grade
The composite is a weighted blend of 9 inputs, each scored 0–100. Each bar is that input's sub-score; the figure is the points it added to the 100-point composite (weight × sub-score).
- Cash flow +30.0/30.0
- 1% rule +10.0/10.0
- DSCR +10.0/10.0
- ARV discount +7.5/15.0
- Schools +3.8/10.0
- Livability +3.7/5.0
- Rent growth +3.0/5.0
- Condition / age +2.5/5.0
- Appreciation +0.0/10.0
$50,000
🖨 Deal sheet 📄 Offer letter ✓ Due diligence
Listing remarks MLS
This single-wide mobile home with an additional pop-out provides an excellent opportunity for affordable homeownership. The small pop-out provides extra living area, giving the home a more open feel than a traditional single-wide. Featuring two bedrooms and one bath, the home is designed for easy living with the efficient layout making the most of every square foot. The manageable size creates a comfortable and functional space that is easy to maintain. Located in a clean well-kept community with pride of ownership throughout. This home is located near the pool, spa, and clubhouse. Enjoy practical living without the upkeep and expense of a larger property. If you're seeking value, convenience, and comfortable living, this home is worth a look.
Key facts
- Extra living area
- Near spa
- Additional pop-out
Tags
Property features AI
Exterior
- Parking: Carport; 2 garage spaces; Assigned space number 158 (space rent $2)
- Utilities: Public sewer; Water listed as Other (see remarks); Other utilities (see remarks)
- Home design: Manufactured home on leased land; 750 living area (listed)
- Exterior features: Roof listed as Other (see remarks)
Interior
- Kitchen: Eat-in kitchen
- Bedrooms: 2 bedrooms
- Flooring: Carpet; Tile
- Bathrooms: 1 full bathroom
- Heating & cooling: Central forced air heating; Window/wall air conditioning unit
- Interior features: Carpet and tile flooring; Eat-in kitchen
Neighborhood map
What this means for you Summary
Snapshot
- This is a 2-bed/1.0-bath manufactured listed at $50k.
Deal economics
- At list price, monthly cash flow is $1k ($14k/yr) — positive.
- The deal already cash-flows at list — no discount required.
- Meets the 1% rule at list price ($2k rent vs $50k).
Location & tenants
- Location reads 73/100 on livability (#164 in CA) — a middle-class / working-renter tenant base. Strengths: housing A+, commute A, employment A-; Watch: cost of living F.
- Washington Unified (suburban): math 30% / reading 57% proficiency, ranked #197 of 517 in CA (top 38%) — families likely to look elsewhere, expect single-tenant / working-renter base with shorter leases.
- Market conditions: Rents rising (+1.9%/yr); 151 active listings in the ZIP; solid renter incomes; 721 units permitted in Yolo County in 2024 (260 in 5+ unit buildings).
Forward outlook
- Local home prices are declining (-3.0%/yr); year-one equity from $346 of loan paydown is wiped out by about $2k of value loss. Plan a longer hold.
- Yolo County population projected at +31% by 2050 — long-run rental-demand tailwind backs the buy-and-hold thesis.
- At projected returns (-3.0% appreciation + 1.9% rent growth), your $14k cash investment doubles in ~2 years — after that, you're playing with house money.
Negotiation context
- Only 4 days on market — expect competitive offers; lowballing is unlikely to land.
- 2 sale attempts with the ask held roughly flat each time — persistent listings suggest the price (not the market) is what's stuck; bring a comps-based counter.
Risks & watch-outs
- Climate carrying-cost: major flood risk; moderate wildfire risk; extreme-heat days projected 7→14/yr by 2055 (HVAC capex compounding) — expect insurance premiums to compound above CPI over the hold.
Questions for the listing agent
- Built in 1970 — when were the roof, HVAC, electrical panel, plumbing, and water heater last replaced?
- Is there a deadline driving the sale (1031 exchange, divorce, estate, relocation)? That informs how much negotiation room exists.
- This sits on a lake — are riparian / water-frontage rights deeded with the parcel? Any dock permits, shoreline easements, or HOA water-use restrictions?
- What's the documented flood / surge / shoreline-erosion history here (FEMA AND non-FEMA — e.g., storm surge, creek backup, septic-field saturation)?
- Any water-quality or seasonal algae-bloom issues that affect tenant satisfaction or short-term-rental demand?
- What's the average days-on-market for RENTAL listings here right now (not sales)? A rising rental-DOM trend means longer vacancies and softer asking-rent achievability than the comps imply.
- What's the recent tenant-quality profile in this submarket — average credit score on applications, eviction rate, late-payment / NSF rate, and stable-employment percentage? A property-management company in the area should have these aggregated.
- How much new for-sale + rental construction is in the pipeline within 1–3 miles? Heavy new supply typically softens prices + rents 12–24 months out; constrained supply supports both.
Investment metrics
- 1% rule
- 3.89% ✓
- Cap rate
- 34.89%
- Cash-on-cash
- 102.13%
- DSCR
- 5.54
- GRM
- 2.1
CMA / ARV
No comps found within radius.
Projected returns pro-forma
-3.0% appreciation · 1.87% rent growth · sell at horizon
- IRR
- —
- Equity multiple
- 5.69×
- Total profit
- $65,625
- Equity at exit
- $7,455
- IRR
- —
- Equity multiple
- 11.44×
- Total profit
- $146,204
- Equity at exit
- $4,323
Cash invested: $14,000 (down + closing). Projections, not guarantees.
Landlord ↔ Tenant lean methodology
- Overall (STATE)
- 18 Strongly Tenant-Friendly
- State California
- 18 Strongly Tenant-Friendly · D+13
- County
- — inherits STATE
- City
- — inherits STATE
ZIP-level market 95691
- Home prices YoY
- -35.0%
- Rents YoY
- 1.9%
- Active inventory
- 151
- Price-to-rent
- 2.1×
Monthly cashflow live
- Estimated rent
- $1,946 medium interval (Pro) →
- Mortgage (P&I)
- −$262
- Tax est. 1.5%
- −$62 /mo · $750/yr
- Insurance
- −$21
- HOA
- −$0
- Vacancy / Maint / Mgmt
- −$409
- Net cashflow
- $1,191
Break-even live
UW: 25.0% down · 7.5% · 30yr · 1.5% tax · 5.0% vac · 8.0% maint · 8.0% mgmt
Financing live
Cash to close
- Down payment
- $12,500
- Closing costs
- $1,500
- Reserves months
- —
- Total cash needed
- —
Loan-product check · same deal, 3 products live
Conventional
25% down · 7.5% · 30yr
- Down + closing
- —
- Monthly P&I
- —
- Monthly cashflow
- —
- DSCR
- —
- Eligible?
- —
Personal DTI + credit; lowest rate.
DSCR
20% down · 8.5% · 30yr
- Down + closing
- —
- Monthly P&I
- —
- Monthly cashflow
- —
- DSCR
- —
- Eligible?
- —
No personal income docs; deal must DSCR.
Hard money
10% down · 12.0% · 12mo
- Down + closing
- —
- Monthly P&I
- —
- Monthly cashflow
- —
- DSCR
- —
- Eligible?
- —
Short-term bridge; refi at stabilization.
Listing history 5 events
-
2026-06-19days on market $50,000 Active 4 DOM
-
2026-06-18days on market $50,000 Active 3 DOM
-
2026-06-17days on market $50,000 Active 2 DOM
-
2026-06-17remarks 699-char remark
-
2026-06-17$50,000 Active 1 DOM
ⓘ Source: listings_history table (triggers on properties + properties_extension) + one-shot
backfill from property_details.listing_events for pre-trigger history.
Climate risk First Street
- Flood 6/10 Major 26% chance over 30 yrs
- Wildfire 5/10 Major
- Heat 7/10 Severe 7 d/yr ≥103°F today · 14 d/yr by 30 yrs out
- Wind 1/10 Low
- Air quality 10/10 Extreme 29 unhealthy d/yr today · 31 by 30 yrs out
Nearby sold comps map
Loading sold comps map…
Walkable amenities ~0.75 mi
Loading nearby amenities…
Taxation est. · year 1
- Rental income
- $23,347
- − Mortgage interest
- −$2,801
- − Property taxes
- −$750
- − Insurance
- −$250
- − Repairs & maintenance
- −$1,868
- − Management
- −$1,868
- − Depreciation
- −$1,455
- Taxable income
- $14,356
- Est. tax owed @ 24.0%
- −$3,445
- After-tax cash flow
- $10,852/yr
For passive investors: Depreciation is non-cash, so a rental often shows a tax loss while cash-flowing — sheltering income. Rental losses are passive: they offset passive income freely, and up to $25,000/yr can offset ordinary (W-2) income if you actively participate and your MAGI is under $100k (phasing out to $0 by $150k); unused losses carry forward. On sale, claimed depreciation is recaptured at up to 25%, and gains may owe capital-gains tax (a 1031 exchange can defer both). Figures are a year-1 estimate at your 24.0% rate — not tax advice; consult a CPA.
Schools (NCES district)
- District
- Washington Unified
- NCES district ID
- 0641580
- Math proficiency
- 30% ▼ -2.00%
- Reading proficiency
- 57% ▲ 12.00%
- Median HH income
- $55,207
- Composite
- 37.79/100
- National rank
- #4339
- State rank
- #197 of 517 in CA
Livability — West Sacramento
- Score
- 73/100
- State rank
- #164
- US rank
- #5389
Category grades
Schools grade is shown separately in the Schools card above.
Census & demographics
- Census place
- West Sacramento, CA
- County
- Yolo County · 212,115 people
- City population
- 55,039
- Metro
- Sacramento-Roseville-Folsom, CA
- Population (ZIP)
- 40,143
- Household income
- $104,750
- Rent vs Own
- Severe rent burden
- 1109.0
Population outlook (Yolo County) Hauer SSP2
- Today (2025)
- 242,183 people
- By 2030
- 257,662 · +6.4%
- By 2040
- 288,050 · +18.9%
- By 2050
- 318,202 · +31.4%
- By 2075
- 392,736 · +62.2%
- By 2100
- 438,150 · +80.9%
Race, ethnicity, and origin ACS 2023
- Neighborhood character
- Diverse neighborhood (Simpson 0.69)
- Race & ethnicity
- White 45% Hispanic / Latino 29% Two or more races 17% Asian 14% Black 3% Native American 1%
- Hispanic origin (detail)
- Mexican 24%
- Common ancestry
- Italian 4% Scotch-Irish 3% Lithuanian 2%
- Foreign-born
- 19% · Canada, China, Vietnam
- Languages at home
- 69% English-only · Spanish 15% Other Indo-European 6% Russian/Polish/Slavic 3%
Political lean MEDSL · Yolo
- 2024 margin
- Solid D (+36.2) · D 66.3% · R 30.1% · Other 3.6%
- 2008→2024 swing
- 0.0pp no change · 2008: 36.2pp · 2024: 36.2pp
- All cycles
- 2024: D+36.2 2020: D+41.4 2016: D+42.0 2012: D+33.2 2008: D+36.2
Not yet ingested
- Civics
- —
Market trends
- HPI YoY
- ▼ -170.47%
- Current HPI
- 316.9399
- Rent YoY
- ▲ 1.87%
- Metro
- Sacramento-Roseville-Folsom, CA
- State GDP YoY
- ▲ 3.21%
- F500 in state
- 116
Industry mix (Fortune 500 HQ in CA)
| Industry | F500 HQs | Revenue |
|---|---|---|
| Technology | 27 | $1,492B |
|
||
| Financial Services | 3 | $174B |
|
||
| Retail | 3 | $44B |
|
||
| Insurance | 3 | $26B |
|
||
| Media / Entertainment | 2 | $115B |
|
||
| Pharmaceuticals / Biotech | 2 | $62B |
|
||
Price history
+0.0% since first listed2 events — show timeline
- 2026-06-15 Listed $50,000 MLSListings
- 2026-06-15 Listed $50,000 bridgeMLS, Bay East AOR, or Contra Costa AOR
Cash-flow waterfall
monthlySold comps — $/sqft
last 12 mo · ≤1 miLoading sold comps…