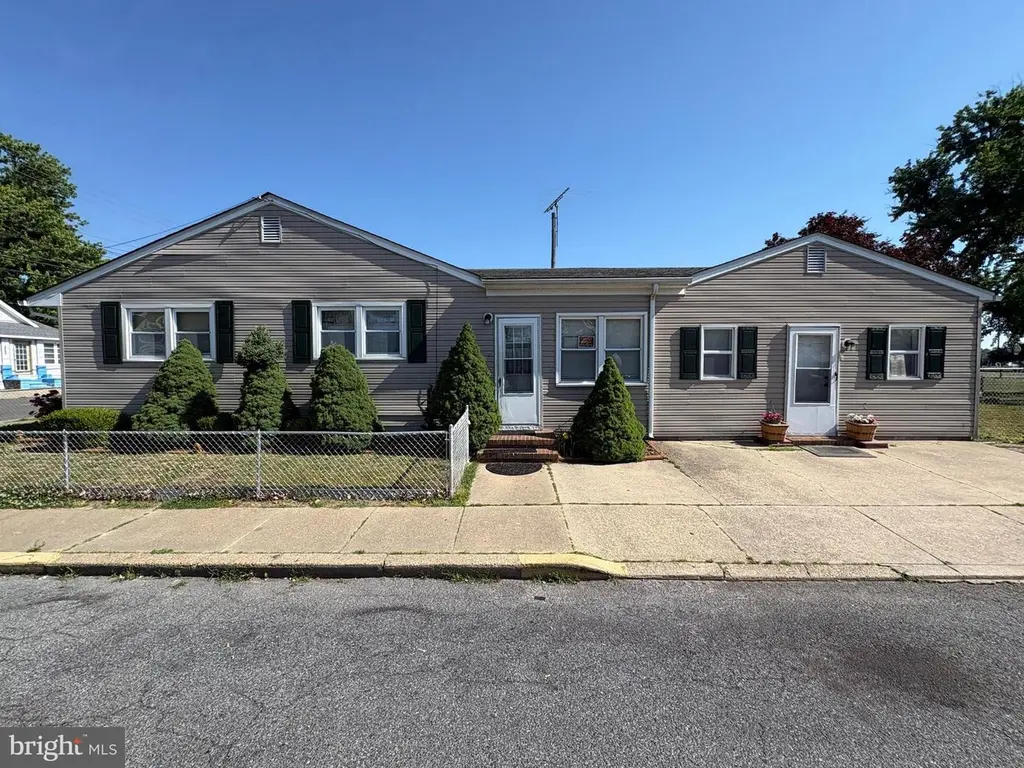
453 N North St · Seaford, DE
Flood risk 3/10 · Minor
- FEMA flood zone
- X (unshaded)
- Chance of flooding over 30 yrs
- 0.2%
- Est. flood insurance / yr
- $473 – $860
Fire risk 1/10 · Minimal
- Est. fire insurance / yr
- $476 – $884
Heat risk 8/10 · Major
- Hot days now (above 105°F)
- 7 days/yr
- Hot days in 30 yrs
- 16 days/yr
Wind risk 6/10 · Moderate
- Chance of severe wind over 30 yrs
- 71.0%
Air-quality risk 3/10 · Minor
- Unhealthy air days now
- 2 days/yr
- Unhealthy air days in 30 yrs
- 2 days/yr
Risk factors via First Street. Map © Google.
Why this score? — see what drove the B- grade
The composite is a weighted blend of 9 inputs, each scored 0–100. Each bar is that input's sub-score; the figure is the points it added to the 100-point composite (weight × sub-score).
- Cash flow +26.5/30.0
- ARV discount +15.0/15.0
- DSCR +9.0/10.0
- 1% rule +5.9/10.0
- Livability +3.2/5.0
- Schools +2.8/10.0
- Rent growth +2.5/5.0
- Condition / age +2.5/5.0
- Appreciation +0.0/10.0
$199,900
🖨 Deal sheet (PDF) 📄 Offer letter ✓ Due diligence
Key facts
- 3,485 sq ft lot
- Built 1975
- Listed 20 days
Property features AI
Finance
- Other: Year built information from assessor; Above-grade finished area reported as 1,792 (assessor)
- Financial info: Ground rent paid annually
Exterior
- Parking: Driveway parking; On-street parking
- Utilities: Public water; Public sewer; Natural gas heating fuel; Electric cooling and hot water
- Home design: Detached frame home; Single-story layout with main-level living; Fee simple ownership
- Construction: Frame construction; Block foundation; Above-grade and below-grade structures
- Exterior features: Chain link fencing; Lot approximately 50 x 75
Interior
- Bedrooms: Three bedrooms on the main level
- Bathrooms: One full bathroom and one half bathroom on the main level
- Heating & cooling: Forced air heating; Window air conditioning units (electric); Electric hot water
- Interior features: Not in a federal flood zone; Main-level ramp for accessibility; Living area per assessor
- Laundry & utility: Laundry in the basement
Neighborhood map
What this means for you Summary
Snapshot
- This is a 3-bed/1.5-bath single-family listed at $200k.
Deal economics
- At list price, monthly cash flow is $527 ($6k/yr) — positive.
- The deal already cash-flows at list — no discount required.
- Meets the 1% rule at list price ($2k rent vs $200k).
- Recommended offer: $197k (1.5% below list) — sets the bar for market timing.
- Cap rate 9.5% vs local median 4.4% in Seaford — top-decile yield for the area; either an underpriced asset or a hidden risk that comps aren't pricing in. Stress-test before assuming the spread holds.
Location & tenants
- Location reads 64/100 on livability (#54 in DE) — a middle-class / working-renter tenant base. Strengths: cost of living A+, housing A+, health & safety A+; Watch: employment D, crime F, amenities F.
- Seaford School District (suburban): math 25% / reading 40% proficiency, ranked #15 of 26 in DE (top 58%) — families likely to look elsewhere, expect single-tenant / working-renter base with shorter leases; 65% free/reduced lunch — lower-income household profile, screen leases tightly.
- Zoned schools: Seaford Central Elementary School (math 36% / reading 45%, grade F, #25 of 105 statewide, top 26%, 452 students, 0% FRL); Seaford Middle School (math 13% / reading 36%, grade F, #24 of 36 statewide, top 69%, 828 students, 0% FRL); Seaford Senior High School (math 12% / reading 27%, grade F, #32 of 40 statewide, top 85%, 879 students, 0% FRL) — zoned schools average 0% FRL vs 65% district-wide (65 pts lower); this property's tenant base skews higher-income than the district average.
- Market conditions: 216 active listings in the ZIP; 4 comparable units currently listed for rent nearby; rentals at typical pace (median 15d on market — plan ~3-4 weeks tenant-placement turnaround); 4,354 units permitted in Sussex County in 2024 (344 in 5+ unit buildings).
Forward outlook
- Local home prices are declining (-3.0%/yr); year-one equity from $1k of loan paydown is wiped out by about $6k of value loss. Plan a longer hold.
- Sussex County population projected at +25% by 2050 — long-run rental-demand tailwind backs the buy-and-hold thesis.
- At projected returns (-3.0% appreciation + 3.0% rent growth), your $56k cash investment doubles in ~10 years — after that, you're playing with house money.
Negotiation context
- It's been on market 20 days — a 2% lower offer ($197k) is reasonable based on typical stale-listing flexibility.
Risks & watch-outs
- Climate carrying-cost: major wind risk, 71% chance of damaging wind over 30y; extreme-heat days projected 7→16/yr by 2055 (HVAC capex compounding) — expect insurance premiums to compound above CPI over the hold.
Questions for the listing agent
- Built in 1975 — when were the roof, HVAC, electrical panel, plumbing, and water heater last replaced?
- Is there a deadline driving the sale (1031 exchange, divorce, estate, relocation)? That informs how much negotiation room exists.
- Crime grade is F in this area — have there been break-ins, vandalism, or insurance claims at this property in the last 3 years? What carrier currently insures it and at what premium?
- What's the average days-on-market for RENTAL listings here right now (not sales)? A rising rental-DOM trend means longer vacancies and softer asking-rent achievability than the comps imply.
- What's the recent tenant-quality profile in this submarket — average credit score on applications, eviction rate, late-payment / NSF rate, and stable-employment percentage? A property-management company in the area should have these aggregated.
- How much new for-sale + rental construction is in the pipeline within 1–3 miles? Heavy new supply typically softens prices + rents 12–24 months out; constrained supply supports both.
Investment metrics
- 1% rule
- 1.09% ✓
- Cap rate
- 9.46%
- Cash-on-cash
- 11.30%
- DSCR
- 1.50
- GRM
- 7.6
CMA / ARV
- ARV (on-the-fly)
- $284,928
- Comps found
- 9
Show comp detail 9 sales within ~0.75 mi
| Address | Dist | Beds/Ba | Sqft | Sold | Price | $/sf | Match |
|---|---|---|---|---|---|---|---|
| 462 N North St | 0.02mi | 3/1.0 | 1,600 (-11%) | 22mo | $125,000 | $78 | 61 |
| 408 E King St | 0.39mi | 3/1.0 | 1,856 (+4%) | 20mo | $145,000 | $78 | 57 |
| 814 Bridgeville Hwy | 0.41mi | 4/3.5 (+1) | 1,800 (+0%) | 13mo | $272,000 | $151 | 56 |
| 213 E Spruce St | 0.48mi | 4/1.5 (+1) | 1,800 (+0%) | 19mo | $289,900 | $161 | 56 |
| 421 N Porter St | 0.71mi | 3/1.5 | 1,910 (+7%) | 3mo | $270,000 | $141 | 54 |
| 1440 Virginia Ave | 0.42mi | 3/2.5 | 1,600 (-11%) | 17mo | $275,000 | $172 | 44 |
| 304 Williams St | 0.63mi | 4/2.0 (+1) | 1,650 (-8%) | 10mo | $285,000 | $173 | 42 |
| 117 Pine Cove Dr | 0.60mi | 3/2.5 | 1,975 (+10%) | 11mo | $435,000 | $220 | 42 |
| 126 Holly Oak Dr | 0.66mi | 3/2.0 | 1,950 (+9%) | 16mo | $310,000 | $159 | 40 |
Match score weights: distance 35% · size 25% · config 20% · recency 20%. Top-matched comps best support the ARV.
Projected returns pro-forma
-3.0% appreciation · 3.0% rent growth · sell at horizon
- IRR
- 0.5%
- Equity multiple
- 1.02×
- Total profit
- $1,090
- Equity at exit
- $29,806
- IRR
- 10.1%
- Equity multiple
- 1.78×
- Total profit
- $43,838
- Equity at exit
- $17,284
Cash invested: $55,972 (down + closing). Projections, not guarantees.
Landlord ↔ Tenant lean methodology
- Overall (STATE)
- 70 Landlord-Friendly
- State Delaware
- 70 Landlord-Friendly · D+7
- County
- — inherits STATE
- City
- — inherits STATE
ZIP-level market 19973
- Home prices YoY
- -17.8%
- Active inventory
- 216
- Price-to-rent
- 7.6×
Monthly cashflow live
- Estimated rent
- $2,181 medium interval (Pro) →
- Mortgage (P&I)
- −$1,048
- Tax from tax record
- −$64 /mo · $770/yr
- Insurance
- −$83
- HOA
- −$0
- Vacancy / Maint / Mgmt
- −$458
- Net cashflow
- $527
Break-even live
Sensitivity live
| Price | -10% $640 | -5% $584 | +0% $527 | +5% $470 | +10% $414 |
|---|---|---|---|---|---|
| Rent | -10% $355 | -5% $441 | +0% $527 | +5% $613 | +10% $699 |
| Rate | -1.0pp $628 | -0.5pp $578 | base $527 | +0.5pp $475 | +1.0pp $422 |
UW: 25.0% down · 7.5% · 30yr · 1.5% tax · 5.0% vac · 8.0% maint · 8.0% mgmt
Financing live
Cash to close
- Down payment
- $49,975
- Closing costs
- $5,997
- Reserves months
- —
- Total cash needed
- —
Loan-product check · same deal, 3 products live
Conventional
25% down · 7.5% · 30yr
- Down + closing
- —
- Monthly P&I
- —
- Monthly cashflow
- —
- DSCR
- —
- Eligible?
- —
Personal DTI + credit; lowest rate.
DSCR
20% down · 8.5% · 30yr
- Down + closing
- —
- Monthly P&I
- —
- Monthly cashflow
- —
- DSCR
- —
- Eligible?
- —
No personal income docs; deal must DSCR.
Hard money
10% down · 12.0% · 12mo
- Down + closing
- —
- Monthly P&I
- —
- Monthly cashflow
- —
- DSCR
- —
- Eligible?
- —
Short-term bridge; refi at stabilization.
Rent comps 4 comps
| Address | Beds | Baths | Sqft | Rent | $/sqft | DOM | Units | Dist |
|---|---|---|---|---|---|---|---|---|
| 701 Water St Seaford, DE | 1.0–3.0 | 1.0–2.0 | 1174 | $2,095 | $1.78 | 15d | 1 | 0.49mi |
| 23033 Meadow Wood Ct Seaford, DE | 1.0–3.0 | 1.0–2.0 | 1054 | $2,100 | $1.99 | 15d | 1 | 1.19mi |
| 215 William Ross Ln Seaford, DE | 3.0 | 2.5 | 1850 | $2,150 | $1.16 | 45d | 1 | 1.19mi |
| 260 Marion Dr Seaford, DE | 3.0 | 1.5 | 2232 | $2,500 | $1.12 | 15d | 1 | 1.42mi |
Listing history 13 events
-
2026-06-21days on market $199,900 Coming Soon 20 DOM
-
2026-06-21days on market $199,900 Coming Soon 19 DOM
-
2026-06-18days on market $199,900 Coming Soon 17 DOM
-
2026-06-17days on market $199,900 Coming Soon 16 DOM
-
2026-06-16days on market $199,900 Coming Soon 15 DOM
-
2026-06-15days on market $199,900 Coming Soon 14 DOM
-
2026-06-13days on market $199,900 Coming Soon 12 DOM
-
2026-06-12days on market $199,900 Coming Soon 11 DOM
-
2026-06-09days on market $199,900 Coming Soon 8 DOM
-
2026-06-08days on market $199,900 Coming Soon 7 DOM
-
2026-06-07days on market $199,900 Coming Soon 6 DOM
-
2026-06-04days on market $199,900 Coming Soon 2 DOM
-
2026-06-01$199,900 Coming Soon 1 DOM
ⓘ Source: listings_history table (triggers on properties + properties_extension) + one-shot
backfill from property_details.listing_events for pre-trigger history.
Tax reassessment forecast DE · Partial reset (capped growth)
- Current annual tax
- $770 · $64/mo
- Projected year-2 tax
- $965 · $80/mo
- Expected delta
- +$195/yr (+$16/mo · 25.3%)
ⓘ Screening estimate from a state-policy table — verify with the county assessor before closing.
Climate risk First Street
- Flood 3/10 Moderate FEMA zone X (unshaded) · 20% chance over 30 yrs
- Wildfire 1/10 Low
- Heat 8/10 Severe 7 d/yr ≥105°F today · 16 d/yr by 30 yrs out
- Wind 6/10 Major 71% chance of damaging wind over 30 yrs
- Air quality 3/10 Moderate 2 unhealthy d/yr today · 2 by 30 yrs out
Nearby sold comps map
Loading sold comps map…
Walkable amenities ~0.75 mi
Loading nearby amenities…
Taxation est. · year 1
- Rental income
- $26,168
- − Mortgage interest
- −$11,198
- − Property taxes
- −$770
- − Insurance
- −$1,000
- − Repairs & maintenance
- −$2,093
- − Management
- −$2,093
- − Depreciation
- −$5,815
- Taxable income
- $3,199
- Est. tax owed @ 24.0%
- −$768
- After-tax cash flow
- $5,556/yr
For passive investors: Depreciation is non-cash, so a rental often shows a tax loss while cash-flowing — sheltering income. Rental losses are passive: they offset passive income freely, and up to $25,000/yr can offset ordinary (W-2) income if you actively participate and your MAGI is under $100k (phasing out to $0 by $150k); unused losses carry forward. On sale, claimed depreciation is recaptured at up to 25%, and gains may owe capital-gains tax (a 1031 exchange can defer both). Figures are a year-1 estimate at your 24.0% rate — not tax advice; consult a CPA.
Schools (NCES district)
- District
- Seaford School District
- NCES district ID
- 1001530
- Math proficiency
- 25% ▼ -18.00%
- Reading proficiency
- 40% ▼ -12.00%
- Median HH income
- $48,427
- Composite
- 28.07/100
- National rank
- #6835
- State rank
- #15 of 26 in DE
Livability — Seaford
- Score
- 64/100
- State rank
- #54
- US rank
- #14448
Category grades
Schools grade is shown separately in the Schools card above.
Census & demographics
- Census place
- Seaford, DE
- Population (ZIP)
- 25,786
Population outlook (Sussex County) Hauer SSP2
- Today (2025)
- 248,853 people
- By 2030
- 264,464 · +6.3%
- By 2040
- 290,980 · +16.9%
- By 2050
- 311,259 · +25.1%
- By 2075
- 352,488 · +41.6%
- By 2100
- 367,406 · +47.6%
Race, ethnicity, and origin ACS 2023
- Neighborhood character
- Diverse neighborhood (Simpson 0.61)
- Race & ethnicity
- White 58% Black 20% Two or more races 13% Hispanic / Latino 11%
- Hispanic origin (detail)
- Mexican 5% Puerto Rican 1% Dominican 2%
- Common ancestry
- Hispanic 4% Romanian 3% Italian 2%
- Foreign-born
- 9% · Canada, Vietnam
- Languages at home
- 85% English-only · Spanish 8% French/Haitian/Cajun 5% Vietnamese 1%
Political lean MEDSL · Sussex
- 2024 margin
- R (+11.0) · D 43.9% · R 54.9% · Other 1.2%
- 2008→2024 swing
- -2.4pp toward R · 2008: -8.6pp · 2024: -11.0pp
- All cycles
- 2024: R+11.0 2020: R+11.2 2016: R+22.0 2012: R+13.0 2008: R+8.6
Not yet ingested
- Civics
- —
Market trends
- HPI YoY
- ▼ -62.40%
- Current HPI
- 288.5652
- Rent YoY
- —
- Metro
- —
- State GDP YoY
- —
- F500 in state
- 0
Price history
1 event — show timeline
- 2026-06-01 Coming Soon $199,900 BRIGHT MLS
Property tax history
+35.2%/yrLatest (2025): $770 · +12.0% YoY. Source: county tax records.
Cash-flow waterfall
monthlySold comps — $/sqft
last 12 mo · ≤1 miLoading sold comps…