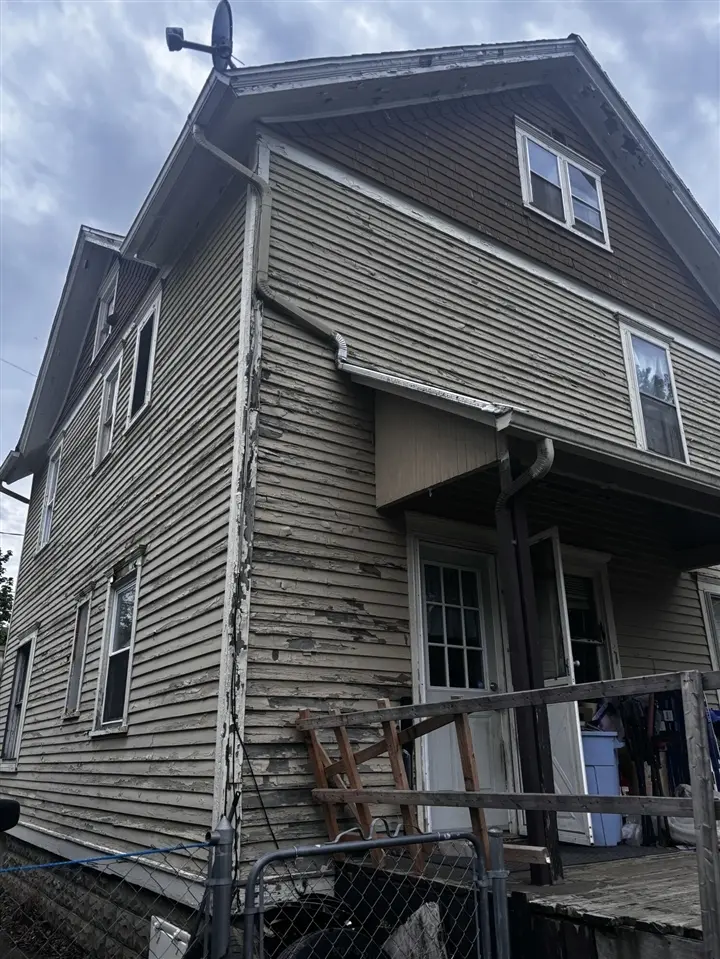
604 Bidwell St · Albion, MI
Flood risk 4/10 · Minor
- FEMA flood zone
- X (unshaded)
- Chance of flooding over 30 yrs
- 0.22%
- Est. flood insurance / yr
- $473 – $860
Fire risk 1/10 · Minimal
- Est. fire insurance / yr
- $784 – $1,456
Heat risk 3/10 · Minor
- Hot days now (above 97°F)
- 7 days/yr
- Hot days in 30 yrs
- 16 days/yr
Wind risk 2/10 · Minimal
- Chance of severe wind over 30 yrs
- —
Air-quality risk 2/10 · Minimal
- Unhealthy air days now
- 1 days/yr
- Unhealthy air days in 30 yrs
- 2 days/yr
Risk factors via First Street. Map © Google.
Why this score? — see what drove the B+ grade
The composite is a weighted blend of 9 inputs, each scored 0–100. Each bar is that input's sub-score; the figure is the points it added to the 100-point composite (weight × sub-score).
- Cash flow +30.0/30.0
- ARV discount +15.0/15.0
- DSCR +10.0/10.0
- 1% rule +9.4/10.0
- Livability +3.5/5.0
- Schools +3.1/10.0
- Rent growth +2.5/5.0
- Condition / age +2.5/5.0
- Appreciation +0.0/10.0
$95,000
🖨 Deal sheet (PDF) 📄 Offer letter ✓ Due diligence
Listing remarks MLS
3 BED 1.5 BATH LOCATED DOWNTOWN ALBION. CLOSE TO EVERYTHING. GREAT INVESTMENT WITH YOU TLC TOUCHES. OR COULD BE YOUR FOREVER HOME. CALL TODAY
Key facts
- 6,752 sq ft lot
- Built 1910
- Listed 40 days
Property features AI
Exterior
- Utilities: Public water; Natural gas connected
- Home design: Traditional single-family residence; Built in 1910
- Construction: Wood siding; Composition roof
- Exterior features: Sidewalk; Shed(s); Paved road access
Interior
- Kitchen: Kitchen (12 x 12)
- Bedrooms: Primary bedroom (15 x 10); Bedroom 2 (11 x 10); Bedroom 3 (8 x 9)
- Bathrooms: 1 full bathroom; 2 half bathrooms
- Heating & cooling: Forced air heating
- Interior features: Seven total rooms; Full basement
Neighborhood map
What this means for you Summary
Snapshot
- This is a 3-bed/1.0-bath single-family listed at $95k.
Deal economics
- At list price, monthly cash flow is $467 ($6k/yr) — positive.
- The deal already cash-flows at list — no discount required.
- Meets the 1% rule at list price ($1k rent vs $95k).
- Recommended offer: $92k (3.0% below list) — sets the bar for market timing.
- Cap rate 12.2% vs local median 8.5% in Albion — top-decile yield for the area; either an underpriced asset or a hidden risk that comps aren't pricing in. Stress-test before assuming the spread holds.
Location & tenants
- Location reads 70/100 on livability (#328 in MI) — a middle-class / working-renter tenant base. Strengths: cost of living A+, housing A+, health & safety A+; Watch: commute C-, amenities D+, crime F.
- Marshall Public Schools (town): math 28% / reading 44% proficiency, ranked #268 of 540 in MI (top 50%) — families likely to look elsewhere, expect single-tenant / working-renter base with shorter leases.
- Zoned schools: Marshall Middle School (math 22% / reading 40%, grade F, #329 of 493 statewide, top 67%, 547 students, 50% FRL).
- Market conditions: 137 active listings in the ZIP; 132 units permitted in Calhoun County in 2024 (0 in 5+ unit buildings).
Forward outlook
- Local home prices are declining (-3.0%/yr); year-one equity from $657 of loan paydown is wiped out by about $3k of value loss. Plan a longer hold.
- Calhoun County population projected at -16% by 2050 — secular population decline; favor cash flow + early exit over multi-decade hold.
- At projected returns (-3.0% appreciation + 3.0% rent growth), your $27k cash investment doubles in ~6 years — after that, you're playing with house money.
Negotiation context
- It's been on market 40 days — a 3% lower offer ($92k) is reasonable based on typical stale-listing flexibility.
- 8 sale attempts since 20y ago with the ask held roughly flat each time — persistent listings suggest the price (not the market) is what's stuck; bring a comps-based counter.
- Current owner paid $68k; 40% above their basis — modest negotiation headroom, anchor on the comps not their cost.
Risks & watch-outs
- Watch-outs: built in 1910 — expect roof / HVAC / electrical / plumbing capex.
Questions for the listing agent
- It's been on market 40 days. Have you received any prior offers? Is the seller open to a 3% concession, seller financing, or rate buy-down credit?
- Built in 1910 — when were the roof, HVAC, electrical panel, plumbing, and water heater last replaced?
- Is there a deadline driving the sale (1031 exchange, divorce, estate, relocation)? That informs how much negotiation room exists.
- Schools are F-rated, which usually means shorter tenancies and higher turnover. Who's the typical renter profile here, and what's been the actual vacancy rate?
- Crime grade is F in this area — have there been break-ins, vandalism, or insurance claims at this property in the last 3 years? What carrier currently insures it and at what premium?
- What's the average days-on-market for RENTAL listings here right now (not sales)? A rising rental-DOM trend means longer vacancies and softer asking-rent achievability than the comps imply.
- What's the recent tenant-quality profile in this submarket — average credit score on applications, eviction rate, late-payment / NSF rate, and stable-employment percentage? A property-management company in the area should have these aggregated.
- How much new for-sale + rental construction is in the pipeline within 1–3 miles? Heavy new supply typically softens prices + rents 12–24 months out; constrained supply supports both.
Investment metrics
- 1% rule
- 1.44% ✓
- Cap rate
- 12.19%
- Cash-on-cash
- 21.05%
- DSCR
- 1.94
- GRM
- 5.8
CMA / ARV
- ARV (median comp)
- $129,836
- List price
- $95,000
- Delta
- -26.83%
- Verdict
- UNDERPRICED
- Comps
- 20 within 1.0 mi
Show comp detail 12 sales within ~0.75 mi
| Address | Dist | Beds/Ba | Sqft | Sold | Price | $/sf | Match |
|---|---|---|---|---|---|---|---|
| 604 Burr Oak St | 0.11mi | 3/1.0 | 1,304 (-3%) | 2mo | $105,000 | $81 | 88 |
| 310 Fitch St | 0.21mi | 3/1.5 | 1,232 (-8%) | 4mo | $200,000 | $162 | 71 |
| 706 N Monroe St | 0.25mi | 3/2.5 | 1,416 (+5%) | 3mo | $25,000 | $18 | 71 |
| 1302 Barnes St | 0.38mi | 3/2.0 | 1,360 (+1%) | 9mo | $176,000 | $129 | 69 |
| 508 Linden Ave | 0.57mi | 3/1.0 | 1,300 (-3%) | 6mo | $135,000 | $104 | 63 |
| 806 N Eaton St | 0.59mi | 3/1.0 | 1,248 (-7%) | 3mo | $125,000 | $100 | 58 |
| 415 E Cass St | 0.29mi | 3/2.0 | 1,494 (+11%) | 9mo | $179,000 | $120 | 56 |
| 305 S Mingo St | 0.49mi | 3/1.0 | 1,176 (-12%) | 3mo | $160,000 | $136 | 54 |
| 502 Lombard St | 0.37mi | 3/1.0 | 1,170 (-13%) | 9mo | $166,000 | $142 | 54 |
| 105 S Eaton St | 0.63mi | 3/2.0 | 1,440 (+7%) | 8mo | $36,000 | $25 | 48 |
| 614 N Ann St | 0.69mi | 3/1.5 | 1,500 (+12%) | 4mo | $89,000 | $59 | 43 |
| 117 E Walnut St | 0.68mi | 2/1.0 (-1) | 1,200 (-11%) | 7mo | $134,900 | $112 | 40 |
Match score weights: distance 35% · size 25% · config 20% · recency 20%. Top-matched comps best support the ARV.
Projected returns pro-forma
-3.0% appreciation · 3.0% rent growth · sell at horizon
- IRR
- 13.5%
- Equity multiple
- 1.54×
- Total profit
- $14,316
- Equity at exit
- $14,165
- IRR
- 22.3%
- Equity multiple
- 2.91×
- Total profit
- $50,702
- Equity at exit
- $8,214
Cash invested: $26,600 (down + closing). Projections, not guarantees.
Landlord ↔ Tenant lean methodology
- Overall (STATE)
- 62 Landlord-Friendly
- State Michigan
- 62 Landlord-Friendly · EVEN
- County
- — inherits STATE
- City
- — inherits STATE
ZIP-level market 49224
- Home prices YoY
- -24.9%
- Active inventory
- 137
- Price-to-rent
- 5.8×
Monthly cashflow live
- Estimated rent
- $1,364 medium interval (Pro) →
- Mortgage (P&I)
- −$498
- Tax from tax record
- −$73 /mo · $875/yr
- Insurance
- −$40
- HOA
- −$0
- Vacancy / Maint / Mgmt
- −$286
- Net cashflow
- $467
Break-even live
Sensitivity live
| Price | -10% $520 | -5% $493 | +0% $467 | +5% $440 | +10% $413 |
|---|---|---|---|---|---|
| Rent | -10% $359 | -5% $413 | +0% $467 | +5% $520 | +10% $574 |
| Rate | -1.0pp $514 | -0.5pp $491 | base $467 | +0.5pp $442 | +1.0pp $417 |
UW: 25.0% down · 7.5% · 30yr · 1.5% tax · 5.0% vac · 8.0% maint · 8.0% mgmt
Financing live
Cash to close
- Down payment
- $23,750
- Closing costs
- $2,850
- Reserves months
- —
- Total cash needed
- —
Loan-product check · same deal, 3 products live
Conventional
25% down · 7.5% · 30yr
- Down + closing
- —
- Monthly P&I
- —
- Monthly cashflow
- —
- DSCR
- —
- Eligible?
- —
Personal DTI + credit; lowest rate.
DSCR
20% down · 8.5% · 30yr
- Down + closing
- —
- Monthly P&I
- —
- Monthly cashflow
- —
- DSCR
- —
- Eligible?
- —
No personal income docs; deal must DSCR.
Hard money
10% down · 12.0% · 12mo
- Down + closing
- —
- Monthly P&I
- —
- Monthly cashflow
- —
- DSCR
- —
- Eligible?
- —
Short-term bridge; refi at stabilization.
Listing history 33 events
-
2026-06-22days on market $95,000 Active 40 DOM
-
2026-06-19days on market $95,000 Active 38 DOM
-
2026-06-18days on market $95,000 Active 37 DOM
-
2026-06-17days on market $95,000 Active 36 DOM
-
2026-06-16days on market $95,000 Active 35 DOM
-
2026-06-15days on market $95,000 Active 34 DOM
-
2026-06-14days on market $95,000 Active 32 DOM
-
2026-06-13days on market $95,000 Active 31 DOM
-
2026-06-10days on market $95,000 Active 29 DOM
-
2026-06-09days on market $95,000 Active 28 DOM
-
2026-06-08days on market $95,000 Active 27 DOM
-
2026-06-07days on market $95,000 Active 26 DOM
-
2026-06-05days on market $95,000 Active 23 DOM
-
2026-06-03days on market $95,000 Active 22 DOM
-
2026-06-02days on market $95,000 Active 21 DOM
-
2026-06-01days on market $95,000 Active 20 DOM
-
2026-05-31days on market $95,000 Active 19 DOM
-
2026-05-30days on market $95,000 Active 18 DOM
-
2026-05-12$95,000 Active 142-char remark
Show marketing remark (141 chars)
3 BED 1.5 BATH LOCATED DOWNTOWN ALBION. CLOSE TO EVERYTHING. GREAT INVESTMENT WITH YOU TLC TOUCHES. OR COULD BE YOUR FOREVER HOME. CALL TODAY
-
2026-05-12$95,000 Active 141-char remark
Show marketing remark (141 chars)
3 BED 1.5 BATH LOCATED DOWNTOWN ALBION. CLOSE TO EVERYTHING. GREAT INVESTMENT WITH YOU TLC TOUCHES. OR COULD BE YOUR FOREVER HOME. CALL TODAY
-
2026-05-12$95,000 Active
Show marketing remark (141 chars)
3 BED 1.5 BATH LOCATED DOWNTOWN ALBION. CLOSE TO EVERYTHING. GREAT INVESTMENT WITH YOU TLC TOUCHES. OR COULD BE YOUR FOREVER HOME. CALL TODAY
-
2018-08-01soldstatus $68,100
-
2018-07-27soldstatus $68,000
-
2018-07-27soldstatus $68,000
-
2018-07-27$68,000
-
2018-07-27$68,000
-
2007-04-24soldstatus $65,000
-
2007-04-05soldstatus $65,000
-
2007-04-05soldstatus $65,000
-
2007-04-05soldstatus $65,000
-
2006-11-04$69,900
-
2006-11-04$69,900
-
2006-11-04$69,900
ⓘ Source: listings_history table (triggers on properties + properties_extension) + one-shot
backfill from property_details.listing_events for pre-trigger history.
Tax reassessment forecast MI · Partial reset (capped growth)
- Current annual tax
- $875 · $73/mo
- Projected year-2 tax
- $1,169 · $97/mo
- Expected delta
- +$294/yr (+$25/mo · 33.6%)
ⓘ Screening estimate from a state-policy table — verify with the county assessor before closing.
Climate risk First Street
- Flood 4/10 Moderate FEMA zone X (unshaded) · 22% chance over 30 yrs
- Wildfire 1/10 Low
- Heat 3/10 Moderate 7 d/yr ≥97°F today · 16 d/yr by 30 yrs out
- Wind 2/10 Low
- Air quality 2/10 Low 1 unhealthy d/yr today · 2 by 30 yrs out
Nearby sold comps map
Loading sold comps map…
Walkable amenities ~0.75 mi
Loading nearby amenities…
Taxation est. · year 1
- Rental income
- $16,363
- − Mortgage interest
- −$5,321
- − Property taxes
- −$875
- − Insurance
- −$475
- − Repairs & maintenance
- −$1,309
- − Management
- −$1,309
- − Depreciation
- −$2,764
- Taxable income
- $4,311
- Est. tax owed @ 24.0%
- −$1,035
- After-tax cash flow
- $4,565/yr
For passive investors: Depreciation is non-cash, so a rental often shows a tax loss while cash-flowing — sheltering income. Rental losses are passive: they offset passive income freely, and up to $25,000/yr can offset ordinary (W-2) income if you actively participate and your MAGI is under $100k (phasing out to $0 by $150k); unused losses carry forward. On sale, claimed depreciation is recaptured at up to 25%, and gains may owe capital-gains tax (a 1031 exchange can defer both). Figures are a year-1 estimate at your 24.0% rate — not tax advice; consult a CPA.
Schools (NCES district)
- District
- Marshall Public Schools
- NCES district ID
- 2622970
- Math proficiency
- 28% ▼ -4.00%
- Reading proficiency
- 44% ▼ -2.00%
- Median HH income
- $48,020
- Composite
- 30.93/100
- National rank
- #6112
- State rank
- #268 of 540 in MI
Livability — Albion
- Score
- 70/100
- State rank
- #328
- US rank
- #8096
Category grades
Schools grade is shown separately in the Schools card above.
Census & demographics
- Census place
- Albion, MI
- Population (ZIP)
- 13,309
Population outlook (Calhoun County) Hauer SSP2
- Today (2025)
- 130,157 people
- By 2030
- 126,691 · -2.7%
- By 2040
- 118,517 · -8.9%
- By 2050
- 109,855 · -15.6%
- By 2075
- 90,486 · -30.5%
- By 2100
- 70,766 · -45.6%
Race, ethnicity, and origin ACS 2023
- Neighborhood character
- Predominantly White (69%)
- Race & ethnicity
- White 69% Black 20% Two or more races 6% Hispanic / Latino 5%
- Common ancestry
- Romanian 3% Lithuanian 1% Iranian 1%
- Foreign-born
- 1% · Canada
- Languages at home
- 96% English-only · Spanish 2% Arabic 1% German/W. Germanic 1%
Political lean MEDSL · Calhoun
- 2024 margin
- R (+14.1) · D 42.3% · R 56.4% · Other 1.3%
- 2008→2024 swing
- -23.4pp toward R · 2008: 9.4pp · 2024: -14.1pp
- All cycles
- 2024: R+14.1 2020: R+11.1 2016: R+12.5 2012: D+1.6 2008: D+9.4
Not yet ingested
- Civics
- —
Market trends
- HPI YoY
- ▼ -67.85%
- Current HPI
- 205.078
- Rent YoY
- —
- Metro
- —
- State GDP YoY
- ▲ 1.37%
- F500 in state
- 28
Industry mix (Fortune 500 HQ in MI)
| Industry | F500 HQs | Revenue |
|---|---|---|
| Automotive Parts | 3 | $48B |
|
||
| Automotive | 2 | $372B |
|
||
| Chemicals | 1 | $45B |
|
||
| Automotive Retail | 1 | $29B |
|
||
| Healthcare / Medical Devices | 1 | $23B |
|
||
| Automotive Technology | 1 | $20B |
|
||
Price history
+35.9% since first listed15 events — show timeline
- 2026-05-12 Listed $95,000 MiRealSource-MiMLS
- 2026-05-12 Listed $95,000 REALCOMP
- 2026-05-12 Listed $95,000 SW Michigan MLS
- 2018-08-01 Sold (Public Records) $68,100 Public Records
- 2018-07-27 Listed $68,000 Greater Lansing AoR
- 2018-07-27 Listed $68,000 REALCOMP
- 2018-07-27 Sold (MLS) $68,000 Greater Lansing AoR
- 2018-07-27 Sold (MLS) $68,000 REALCOMP
- 2007-04-24 Sold (Public Records) $65,000 Public Records
- 2007-04-05 Sold (MLS) $65,000 MiRealSource-MiMLS
- 2007-04-05 Sold (MLS) $65,000 REALCOMP
- 2007-04-05 Sold (MLS) $65,000 SW Michigan MLS
- 2006-11-04 Listed $69,900 MiRealSource-MiMLS
- 2006-11-04 Listed $69,900 REALCOMP
- 2006-11-04 Listed $69,900 SW Michigan MLS
Property tax history
-3.8%/yrLatest (2025): $875 · -32.6% YoY. Source: county tax records.
Cash-flow waterfall
monthlySold comps — $/sqft
last 12 mo · ≤1 miLoading sold comps…