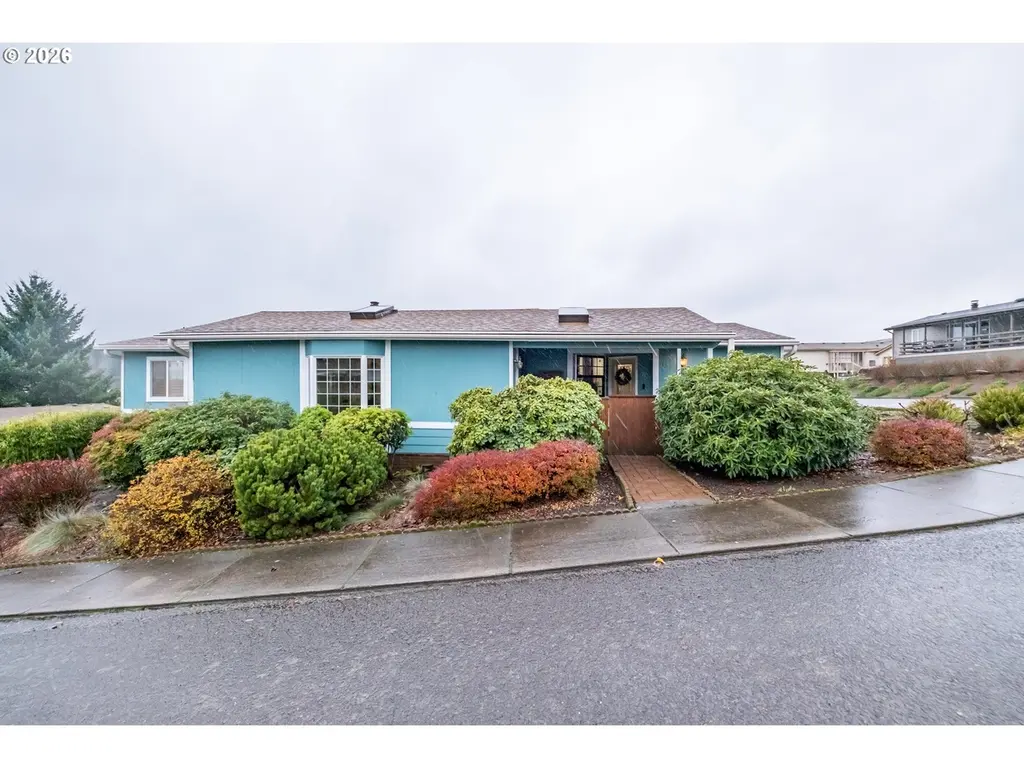
2120 Robins Ln SE Unit 73A · Salem, OR
Flood risk 5/10 · Moderate
- FEMA flood zone
- X
- Chance of flooding over 30 yrs
- 0.24%
- Est. flood insurance / yr
- $507 – $1,088
Fire risk 3/10 · Minor
- Est. fire insurance / yr
- $498 – $926
Heat risk 3/10 · Minor
- Hot days now (above 91°F)
- 7 days/yr
- Hot days in 30 yrs
- 15 days/yr
Wind risk 1/10 · Minimal
- Chance of severe wind over 30 yrs
- —
Air-quality risk 9/10 · Severe
- Unhealthy air days now
- 12 days/yr
- Unhealthy air days in 30 yrs
- 13 days/yr
Risk factors via First Street. Map © Google.
Why this score? — see what drove the D+ grade
The composite is a weighted blend of 9 inputs, each scored 0–100. Each bar is that input's sub-score; the figure is the points it added to the 100-point composite (weight × sub-score).
- Cash flow +21.5/30.0
- DSCR +6.9/10.0
- 1% rule +4.9/10.0
- Livability +4.0/5.0
- Schools +3.7/10.0
- Rent growth +2.9/5.0
- Condition / age +2.5/5.0
- ARV discount +0.0/15.0
- Appreciation +0.0/10.0
$210,000
🖨 Deal sheet (PDF) 📄 Offer letter ✓ Due diligence
Listing remarks MLS
Welcome to this beautifully maintained home located in Terrace Lake Estates a 55+ gated community. Large Living room, separate Family room and dining area. Upgrades performed in 2020 include new roof, new vinyl windows, new carpet, new laminate flooring, new paint inside and out. Recent upgrades include new heat pump, new vapor barrier, insulation wrap on plumbing supply lines in the crawl space, added insulation in the furnace closet and crawl space. Additional lighting/ceiling fans installed in 2022. The 2 car garage has a bonus storage/craft area in the rear. This is a must see.
Key facts
- Gated community
- New carpet
- New vinyl windows
Tags
Neighborhood map
What this means for you Summary
Snapshot
- This is a 3-bed/2.0-bath manufactured listed at $210k.
Deal economics
- At list price, monthly cash flow is $314 ($4k/yr) — positive.
- The deal already cash-flows at list — no discount required.
- To meet the 1% rule (rent ≥ 1% of price), the offer needs to be $208k (1.0% below list).
- Recommended offer: $185k (12.0% below list) — sets the bar for market timing.
- Cap rate 8.1% vs local median 2.9% in Salem — top-decile yield for the area; either an underpriced asset or a hidden risk that comps aren't pricing in. Stress-test before assuming the spread holds.
Location & tenants
- Location reads 79/100 on livability (#59 in OR, #2,084 nationally) — a middle-class / working-renter tenant base. Strengths: amenities A+, commute A+, housing A+; Watch: schools D, crime F.
- Salem-Keizer SD 24J (urban): math 34% / reading 47% proficiency, ranked #103 of 183 in OR (top 56%) — families likely to look elsewhere, expect single-tenant / working-renter base with shorter leases.
- Market conditions: Rents rising (+1.6%/yr); 272 active listings in the ZIP; 22 comparable units currently listed for rent nearby; rentals at typical pace (median 22d on market — plan ~3-4 weeks tenant-placement turnaround); solid renter incomes; 1,591 units permitted in Marion County in 2024 (716 in 5+ unit buildings).
Forward outlook
- Local home prices are declining (-3.0%/yr); year-one equity from $1k of loan paydown is wiped out by about $6k of value loss. Plan a longer hold.
- Marion County population projected at +17% by 2050 — long-run rental-demand tailwind backs the buy-and-hold thesis.
Negotiation context
- It's been on market 121 days — a 12% lower offer ($185k) is reasonable based on typical stale-listing flexibility.
- 3 sale attempts since 7y ago; this cycle's ask has dropped $15k (7%) from the opening price — seller is motivated, your offer sets the floor, not the list.
- Current owner paid $120k; list at $210k implies a 76% gain — meaningful room to come down on a strong offer.
Risks & watch-outs
- Climate carrying-cost: moderate flood risk — expect insurance premiums to compound above CPI over the hold.
Questions for the listing agent
- It's been on market 121 days. Have you received any prior offers? Is the seller open to a 12% concession, seller financing, or rate buy-down credit?
- Built in 1979 — when were the roof, HVAC, electrical panel, plumbing, and water heater last replaced?
- Why hasn't it sold? Are there any deal-killer items the seller is aware of (foundation, flood, title, zoning, code violations)?
- Is there a deadline driving the sale (1031 exchange, divorce, estate, relocation)? That informs how much negotiation room exists.
- Schools are D-rated, which usually means shorter tenancies and higher turnover. Who's the typical renter profile here, and what's been the actual vacancy rate?
- Crime grade is F in this area — have there been break-ins, vandalism, or insurance claims at this property in the last 3 years? What carrier currently insures it and at what premium?
- The area grade is low — what's the realistic commute time and amenity access for the typical tenant pool here? Any planned neighborhood developments (good or bad) we should know about?
- What's the average days-on-market for RENTAL listings here right now (not sales)? A rising rental-DOM trend means longer vacancies and softer asking-rent achievability than the comps imply.
- What's the recent tenant-quality profile in this submarket — average credit score on applications, eviction rate, late-payment / NSF rate, and stable-employment percentage? A property-management company in the area should have these aggregated.
- How much new for-sale + rental construction is in the pipeline within 1–3 miles? Heavy new supply typically softens prices + rents 12–24 months out; constrained supply supports both.
Investment metrics
- 1% rule
- 0.99% ✗
- Cap rate
- 8.09%
- Cash-on-cash
- 6.41%
- DSCR
- 1.29
- GRM
- 8.4
CMA / ARV
- ARV (median comp)
- $145,419
- List price
- $210,000
- Delta
- 44.41%
- Verdict
- OVERPRICED
- Comps
- 20 within 1.0 mi
Show comp detail 12 sales within ~0.75 mi
| Address | Dist | Beds/Ba | Sqft | Sold | Price | $/sf | Match |
|---|---|---|---|---|---|---|---|
| 2120 Robins Ln SE #180 | 0.00mi | 3/2.0 | 1,782 (+3%) | 2mo | $243,000 | $136 | 93 |
| 2120 SE Robins Ln #145 | 0.00mi | 3/2.0 | 1,782 (+3%) | 5mo | $200,000 | $112 | 90 |
| 2120 Robins Ln SE #185 | 0.00mi | 2/2.0 (-1) | 1,728 (0%) | 5mo | $224,900 | $130 | 90 |
| 2120 Robins Ln SE #202 | 0.00mi | 3/2.0 | 1,620 (-6%) | 11mo | $194,000 | $120 | 81 |
| 2120 Robins Ln #2 | 0.00mi | 3/2.0 | 1,536 (-11%) | 8mo | $185,000 | $120 | 74 |
| 2120 Robins Ln SE #207 | 0.00mi | 2/2.0 (-1) | 1,593 (-8%) | 10mo | $225,000 | $141 | 74 |
| 2000 Robins Ln SE #40 | 0.32mi | 3/2.0 | 1,620 (-6%) | 6mo | $81,200 | $50 | 69 |
| 2000 Robins Ln SE #9 | 0.32mi | 3/2.0 | 1,586 (-8%) | 4mo | $143,000 | $90 | 68 |
| 2120 Robins Ln SE #66 | 0.26mi | 3/2.0 | 1,536 (-11%) | 7mo | $182,000 | $118 | 64 |
| 2000 Robins Ln SE #8 | 0.32mi | 3/2.0 | 1,512 (-12%) | 5mo | $127,500 | $84 | 60 |
| 2040 Navaho Ct SE | 0.42mi | 2/2.0 (-1) | 1,560 (-10%) | 4mo | $94,999 | $61 | 56 |
| 2155 Robins Ln SE #43 | 0.48mi | 3/2.0 | 1,512 (-12%) | 10mo | $135,000 | $89 | 48 |
Match score weights: distance 35% · size 25% · config 20% · recency 20%. Top-matched comps best support the ARV.
Projected returns pro-forma
-3.0% appreciation · 1.64% rent growth · sell at horizon
- IRR
- -7.9%
- Equity multiple
- 0.71×
- Total profit
- $-16,869
- Equity at exit
- $31,312
- IRR
- -0.1%
- Equity multiple
- 0.99×
- Total profit
- $-309
- Equity at exit
- $18,157
Cash invested: $58,800 (down + closing). Projections, not guarantees.
Landlord ↔ Tenant lean methodology
- Overall (STATE)
- 28 Tenant-Leaning
- State Oregon
- 28 Tenant-Leaning · D+6
- County
- — inherits STATE
- City
- — inherits STATE
ZIP-level market 97306
- Rents YoY
- 1.6%
- Active inventory
- 272
- Price-to-rent
- 8.4×
Monthly cashflow live
- Estimated rent
- $2,079 high interval (Pro) →
- Mortgage (P&I)
- −$1,101
- Tax from tax record
- −$140 /mo · $1,675/yr
- Insurance
- −$88
- HOA
- −$0
- Vacancy / Maint / Mgmt
- −$437
- Net cashflow
- $314
Break-even live
Sensitivity live
| Price | -10% $433 | -5% $374 | +0% $314 | +5% $255 | +10% $195 |
|---|---|---|---|---|---|
| Rent | -10% $150 | -5% $232 | +0% $314 | +5% $396 | +10% $478 |
| Rate | -1.0pp $420 | -0.5pp $368 | base $314 | +0.5pp $260 | +1.0pp $204 |
UW: 25.0% down · 7.5% · 30yr · 1.5% tax · 5.0% vac · 8.0% maint · 8.0% mgmt
Financing live
Cash to close
- Down payment
- $52,500
- Closing costs
- $6,300
- Reserves months
- —
- Total cash needed
- —
Loan-product check · same deal, 3 products live
Conventional
25% down · 7.5% · 30yr
- Down + closing
- —
- Monthly P&I
- —
- Monthly cashflow
- —
- DSCR
- —
- Eligible?
- —
Personal DTI + credit; lowest rate.
DSCR
20% down · 8.5% · 30yr
- Down + closing
- —
- Monthly P&I
- —
- Monthly cashflow
- —
- DSCR
- —
- Eligible?
- —
No personal income docs; deal must DSCR.
Hard money
10% down · 12.0% · 12mo
- Down + closing
- —
- Monthly P&I
- —
- Monthly cashflow
- —
- DSCR
- —
- Eligible?
- —
Short-term bridge; refi at stabilization.
Rent comps 22 comps
| Address | Beds | Baths | Sqft | Rent | $/sqft | DOM | Units | Dist |
|---|---|---|---|---|---|---|---|---|
| 2116 Nomad Ct SE Unit 2120 Salem, OR | 2.0 | 1.0 | 1050 | $1,425 | $1.36 | 14d | 1 | 0.35mi |
| 1900 Madras St SE Salem, OR | 1.0–3.0 | 1.0–2.0 | 895 | $1,895 | $2.12 | 14d | 10 | 0.56mi |
| 6127 Blue River Dr SE Salem, OR | 3.0 | 2.5 | 1531 | $2,450 | $1.60 | 44d | 1 | 0.64mi |
| 1951 Madras St SE Salem, OR | 2.0 | 2.5 | 1465 | $1,975 | $1.35 | 22d | 1 | 0.67mi |
| 1691 Waln Dr SE Salem, OR | 1.0–2.0 | 1.0–2.0 | 955 | $1,725 | $1.81 | 14d | 6 | 0.69mi |
| 6953 Talloc Ave SE Unit 6955 Salem, OR | 3.0 | 2.5 | 1418 | $2,295 | $1.62 | 14d | 1 | 0.73mi |
| 5943 Blue River Dr SE Salem, OR | 3.0 | 3.0 | 1472 | $2,395 | $1.63 | 44d | 1 | 0.76mi |
| 6150 Fircrest St SE Unit 6160 Salem, OR | 3.0 | 1.5 | 1140 | $2,050 | $1.80 | 14d | 1 | 0.82mi |
| 6150 Fircrest St SE Salem, OR | 3.0 | 1.5 | 1140 | $2,050 | $1.80 | 14d | 1 | 0.82mi |
| 5823 Reed Ln SE Unit 112 Salem, OR | 2.0 | 2.5 | 1198 | $1,995 | $1.67 | 24d | 1 | 0.87mi |
| 5815 Reed Ln SE Unit 133 Salem, OR | 2.0 | 2.5 | 1198 | $1,995 | $1.67 | 24d | 1 | 0.89mi |
| 1544 Fircrest Ct SE Salem, OR | 2.0 | 1.5 | 1296 | $1,850 | $1.43 | 24d | 1 | 0.90mi |
| 1410 Jonmart Ave SE Salem, OR | 3.0 | 2.0 | 1096 | $1,995 | $1.82 | 14d | 1 | 0.97mi |
| 1543 Wiltsey Rd SE Salem, OR | 2.0 | 1.0–2.0 | 1043 | $1,475 | $1.41 | 14d | 4 | 1.02mi |
| 2772 Bastille Ave SE Salem, OR | 3.0 | 2.0 | 1614 | $2,495 | $1.55 | 22d | 1 | 1.16mi |
| 5512 Murray St SE Salem, OR | 3.0 | 2.0 | 1275 | $2,645 | $2.07 | 22d | 1 | 1.19mi |
| 5442 Monterey Dr SE Unit 5442 Salem, OR | 2.0 | 2.0 | 1112 | $1,995 | $1.79 | 24d | 1 | 1.23mi |
| 5423 Monterey Dr SE Salem, OR | 3.0 | 2.0 | 1457 | $2,295 | $1.58 | 24d | 1 | 1.24mi |
| 2846 Vintage Ave SE Unit 2846 Salem, OR | 2.0 | 2.0 | 1105 | $1,895 | $1.71 | 44d | 1 | 1.34mi |
| 5787 Sunstone St SE Unit 5787 Salem, OR | 3.0 | 1.5 | 1192 | $1,645 | $1.38 | 24d | 1 | 1.41mi |
| 6755 Devon Ave SE Salem, OR | 3.0 | 2.0 | 2213 | $3,100 | $1.40 | 44d | 1 | 1.42mi |
| 1250 Baxter Rd SE Unit 1276 Salem, OR | 3.0 | 2.5 | 1289 | $2,395 | $1.86 | 14d | 1 | 1.49mi |
Listing history 24 events
-
2026-06-19price $210,000 Active 121 DOM
-
2026-06-18days on market $219,900 Active 121 DOM
-
2026-06-17days on market $219,900 Active 120 DOM
-
2026-06-16days on market $219,900 Active 119 DOM
-
2026-06-15days on market $219,900 Active 118 DOM
-
2026-06-14days on market $219,900 Active 116 DOM
-
2026-06-10days on market $219,900 Active 113 DOM
-
2026-06-09days on market $219,900 Active 112 DOM
-
2026-06-08days on market $219,900 Active 111 DOM
-
2026-06-07days on market $219,900 Active 110 DOM
-
2026-06-03days on market $219,900 Active 106 DOM
-
2026-06-02days on market $219,900 Active 105 DOM
-
2026-06-01days on market $219,900 Active 104 DOM
-
2026-05-31days on market $219,900 Active 103 DOM
-
2026-05-30days on market $219,900 Active 102 DOM
-
2026-04-08price $219,900 588-char remark
Show marketing remark (507 chars)
Welcome to this beautifully maintained home located in Terrace Lake Estates a 55+ gated community. Large Living room, separate Family room and dining area. Upgrades performed in 2020 include new roof, new vinyl windows, new carpet, new laminate flooring, new paint inside and out. Recent upgrades include new heat pump, new vapor barrier, insulation wrap on plumbing supply lines in the crawl space, added insulation in the furnace closet and crawl space. Additional lighting/ceiling fans installed in 2022.
-
2026-04-08price $219,900 507-char remark
Show marketing remark (507 chars)
Welcome to this beautifully maintained home located in Terrace Lake Estates a 55+ gated community. Large Living room, separate Family room and dining area. Upgrades performed in 2020 include new roof, new vinyl windows, new carpet, new laminate flooring, new paint inside and out. Recent upgrades include new heat pump, new vapor barrier, insulation wrap on plumbing supply lines in the crawl space, added insulation in the furnace closet and crawl space. Additional lighting/ceiling fans installed in 2022.
-
2026-02-17$224,900 Active 507-char remark
Show marketing remark (507 chars)
Welcome to this beautifully maintained home located in Terrace Lake Estates a 55+ gated community. Large Living room, separate Family room and dining area. Upgrades performed in 2020 include new roof, new vinyl windows, new carpet, new laminate flooring, new paint inside and out. Recent upgrades include new heat pump, new vapor barrier, insulation wrap on plumbing supply lines in the crawl space, added insulation in the furnace closet and crawl space. Additional lighting/ceiling fans installed in 2022.
-
2026-01-28$224,900 Active 588-char remark
Show marketing remark (588 chars)
Welcome to this beautifully maintained home located in Terrace Lake Estates a 55+ gated community. Large Living room, separate Family room and dining area. Upgrades performed in 2020 include new roof, new vinyl windows, new carpet, new laminate flooring, new paint inside and out. Recent upgrades include new heat pump, new vapor barrier, insulation wrap on plumbing supply lines in the crawl space, added insulation in the furnace closet and crawl space. Additional lighting/ceiling fans installed in 2022. The 2 car garage has a bonus storage/craft area in the rear. This is a must see.
-
2020-01-29soldstatus $119,500 Sold
-
2019-12-18historical Active under Contract
-
2019-10-12price $140,000
-
2019-08-01price $155,000
-
2019-07-12$160,000 Active
ⓘ Source: listings_history table (triggers on properties + properties_extension) + one-shot
backfill from property_details.listing_events for pre-trigger history.
Tax reassessment forecast OR · Resets to sale price
- Current annual tax
- $1,675 · $140/mo
- Projected year-2 tax
- $2,037 · $170/mo
- Expected delta
- +$362/yr (+$30/mo · 21.6%)
ⓘ Screening estimate from a state-policy table — verify with the county assessor before closing.
Climate risk First Street
- Flood 5/10 Major FEMA zone X · 24% chance over 30 yrs
- Wildfire 3/10 Moderate
- Heat 3/10 Moderate 7 d/yr ≥91°F today · 15 d/yr by 30 yrs out
- Wind 1/10 Low
- Air quality 9/10 Extreme 12 unhealthy d/yr today · 13 by 30 yrs out
Nearby sold comps map
Loading sold comps map…
Walkable amenities ~0.75 mi
Loading nearby amenities…
Taxation est. · year 1
- Rental income
- $24,950
- − Mortgage interest
- −$11,763
- − Property taxes
- −$1,675
- − Insurance
- −$1,050
- − Repairs & maintenance
- −$1,996
- − Management
- −$1,996
- − Depreciation
- −$6,109
- Taxable income
- $361
- Est. tax owed @ 24.0%
- −$87
- After-tax cash flow
- $3,684/yr
For passive investors: Depreciation is non-cash, so a rental often shows a tax loss while cash-flowing — sheltering income. Rental losses are passive: they offset passive income freely, and up to $25,000/yr can offset ordinary (W-2) income if you actively participate and your MAGI is under $100k (phasing out to $0 by $150k); unused losses carry forward. On sale, claimed depreciation is recaptured at up to 25%, and gains may owe capital-gains tax (a 1031 exchange can defer both). Figures are a year-1 estimate at your 24.0% rate — not tax advice; consult a CPA.
Schools (NCES district)
- District
- Salem-Keizer SD 24J
- NCES district ID
- 4110820
- Math proficiency
- 34% ▼ -1.00%
- Reading proficiency
- 47% ▼ -2.00%
- Median HH income
- $48,632
- Composite
- 37.16/100
- National rank
- #9017
- State rank
- #103 of 183 in OR
Livability — Salem
- Score
- 79/100
- State rank
- #59
- US rank
- #2084
Category grades
Schools grade is shown separately in the Schools card above.
Census & demographics
- Census place
- Salem, OR
- County
- Marion County · 258,219 people
- City population
- 193,601
- Metro
- Salem, OR
- Population (ZIP)
- 34,383
- Household income
- $101,753
- Rent vs Own
- Severe rent burden
- 1437.0
Population outlook (Marion County) Hauer SSP2
- Today (2025)
- 360,940 people
- By 2030
- 375,178 · +3.9%
- By 2040
- 400,914 · +11.1%
- By 2050
- 422,187 · +17.0%
- By 2075
- 460,305 · +27.5%
- By 2100
- 464,025 · +28.6%
Race, ethnicity, and origin ACS 2023
- Neighborhood character
- Predominantly White (74%)
- Race & ethnicity
- White 74% Hispanic / Latino 12% Two or more races 9% Asian 5% Pacific Islander 2% Black 1%
- Hispanic origin (detail)
- Mexican 9%
- Common ancestry
- Italian 6% Portuguese 5% Slovak 3%
- Foreign-born
- 8% · Canada, China, Vietnam
- Languages at home
- 86% English-only · Spanish 6% Other Asian/Pacific 3% Russian/Polish/Slavic 1%
Political lean MEDSL · Marion
- 2024 margin
- Toss-up / Even · D 47.5% · R 49.5% · Other 3.0%
- 2008→2024 swing
- -4.2pp toward R · 2008: 2.2pp · 2024: -2.0pp
- All cycles
- 2024: R+2.0 2020: D+1.1 2016: R+5.0 2012: R+3.5 2008: D+2.2
Not yet ingested
- Civics
- —
Market trends
- HPI YoY
- ▼ -335.25%
- Current HPI
- 279.7875
- Rent YoY
- ▲ 1.64%
- Metro
- Salem, OR
- State GDP YoY
- ▲ 2.05%
- F500 in state
- 2
Industry mix (Fortune 500 HQ in OR)
| Industry | F500 HQs | Revenue |
|---|---|---|
| Consumer Goods | 1 | $51B |
|
||
Price history
+37.4% since first listed9 events — show timeline
- 2026-04-08 Price Changed $219,900 WVMLS
- 2026-04-08 Price Changed $219,900 RMLS
- 2026-02-17 Listed $224,900 RMLS
- 2026-01-28 Listed $224,900 WVMLS
- 2020-01-29 Sold (MLS) $119,500 WVMLS
- 2019-12-18 Contingent — WVMLS
- 2019-10-12 Price Changed $140,000 WVMLS
- 2019-08-01 Price Changed $155,000 WVMLS
- 2019-07-12 Listed $160,000 WVMLS
Property tax history
+3.9%/yrLatest (2025): $1,675 · +7.7% YoY. Source: county tax records.
Cash-flow waterfall
monthlySold comps — $/sqft
last 12 mo · ≤1 miLoading sold comps…