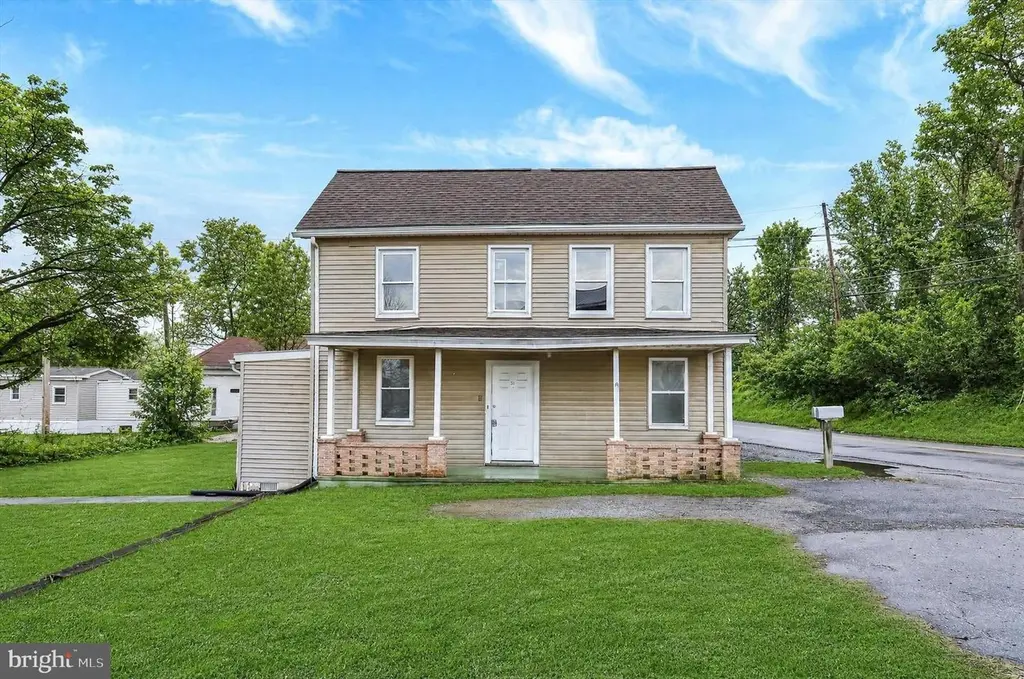
 Duplex
36 & 38 Middle Spring Ave · Shippensburg, PA
Flood risk 9/10 · Severe
- FEMA flood zone
- AE
- Chance of flooding over 30 yrs
- 0.99%
- Est. flood insurance / yr
- $1,737 – $8,500
Fire risk 2/10 · Minimal
- Est. fire insurance / yr
- $511 – $949
Heat risk 5/10 · Moderate
- Hot days now (above 100°F)
- 7 days/yr
- Hot days in 30 yrs
- 15 days/yr
Wind risk 2/10 · Minimal
- Chance of severe wind over 30 yrs
- 1.0%
Air-quality risk 2/10 · Minimal
- Unhealthy air days now
- 1 days/yr
- Unhealthy air days in 30 yrs
- 2 days/yr
Risk factors via First Street. Map © Google.
Why this score? — see what drove the C+ grade
The composite is a weighted blend of 9 inputs, each scored 0–100. Each bar is that input's sub-score; the figure is the points it added to the 100-point composite (weight × sub-score).
- Cash flow +28.2/30.0
- DSCR +10.0/10.0
- 1% rule +7.6/10.0
- ARV discount +3.6/15.0
- Schools +3.5/10.0
- Livability +3.5/5.0
- Rent growth +2.5/5.0
- Condition / age +2.5/5.0
- Appreciation +0.0/10.0
$210,000
🖨 Deal sheet 📄 Offer letter ✓ Due diligence
Multi-family units
County records classify this as Multi-Family (2-4 Unit). Listing-text estimate: 2 units. confirmed
Listing remarks MLS
This detached duplex is the income-producing property you've been waiting for. Two fully separate units, each with 2 bedrooms, 1 bathroom, and 2 dedicated parking spaces — that's 4 total parking spots for the building, a rare and highly sought-after feature. Both units are already leased with tenants moving in May 24th at $1,100/month per unit — meaning you'll start collecting $2,200/month in rental income from day one. No waiting, no vacancy, no stress. Whether you're a seasoned investor looking to grow your portfolio or a first-time buyer ready to house hack your way to financial freedom, this property delivers the steady cash flow you're looking for. Schedule your showing today
Key facts
- Rental income
- Fully separate units
- 6,970 sq ft lot
Tags
Neighborhood map
What this means for you Summary
Snapshot
- This is a 2 × 2-bed/1-bath units multifamily listed at $210k.
Deal economics
- At list price, monthly cash flow is $242 ($3k/yr) — positive. Per door: $121/mo.
- The deal already cash-flows at list — no discount required.
- Meets the 1% rule at list price ($3k rent vs $210k).
- Recommended offer: $207k (1.5% below list) — sets the bar for market timing.
- Cap rate 10.1% vs local median 3.5% in Shippensburg — top-decile yield for the area; either an underpriced asset or a hidden risk that comps aren't pricing in. Stress-test before assuming the spread holds.
Location & tenants
- Location reads 70/100 on livability (#741 in PA) — a middle-class / working-renter tenant base. Strengths: crime A+, cost of living A+, health & safety A; Watch: employment D+, amenities F, commute F.
- Shippensburg Area SD (town): math 31% / reading 52% proficiency, ranked #335 of 539 in PA (top 62%) — families likely to look elsewhere, expect single-tenant / working-renter base with shorter leases.
- Market conditions: 161 active listings in the ZIP; 5 comparable units currently listed for rent nearby; rentals at typical pace (median 14d on market — plan ~3-4 weeks tenant-placement turnaround); 1,052 units permitted in Cumberland County in 2024 (310 in 5+ unit buildings).
- This rent runs 45% of the median local income ($71k/yr) — at the standard rent-burdened threshold; future hikes will face affordability resistance.
Forward outlook
- Local home prices are declining (-3.0%/yr); year-one equity from $1k of loan paydown is wiped out by about $6k of value loss. Plan a longer hold.
- Cumberland County population projected at +17% by 2050 — long-run rental-demand tailwind backs the buy-and-hold thesis.
Negotiation context
- It's been on market 30 days — a 2% lower offer ($207k) is reasonable based on typical stale-listing flexibility.
- 7 sale attempts since 3y ago with the ask held roughly flat each time — persistent listings suggest the price (not the market) is what's stuck; bring a comps-based counter.
- Current owner paid $173k; 21% above their basis — modest negotiation headroom, anchor on the comps not their cost.
Risks & watch-outs
- Watch-outs: flood insurance adds $427/mo; built in 1920 — expect roof / HVAC / electrical / plumbing capex.
- Climate carrying-cost: in FEMA flood zone AE (mandatory federal flood insurance); extreme-heat days projected 7→15/yr by 2055 (HVAC capex compounding) — expect insurance premiums to compound above CPI over the hold.
Questions for the listing agent
- Can we see the unit-by-unit rent roll, current vacancy, and any below-market leases? What's the average tenancy length?
- What capital expenditures (roof, boiler, parking lot, exteriors) have been made in the last 5 years, and what's planned in the next 2?
- Built in 1920 — when were the roof, HVAC, electrical panel, plumbing, and water heater last replaced?
- What's the actual annual flood-insurance premium (NFIP or private), and is the property in a SFHA with mandatory coverage?
- Is there a deadline driving the sale (1031 exchange, divorce, estate, relocation)? That informs how much negotiation room exists.
- What's the average days-on-market for RENTAL listings here right now (not sales)? A rising rental-DOM trend means longer vacancies and softer asking-rent achievability than the comps imply.
- What's the recent tenant-quality profile in this submarket — average credit score on applications, eviction rate, late-payment / NSF rate, and stable-employment percentage? A property-management company in the area should have these aggregated.
- How much new apartment / multifamily construction is in the pipeline within 1–3 miles? Heavy new supply (>2% of stock underway) typically softens rents 12–24 months out; light construction supports rent growth.
Investment metrics
- 1% rule
- 1.26% ✓
- Cap rate
- 10.12%
- Cash-on-cash
- 13.65%
- DSCR
- 1.61
- GRM
- 6.6
CMA / ARV
- ARV (on-the-fly)
- $193,230
- Comps found
- 3
Show comp detail 3 sales within ~0.75 mi
| Address | Dist | Beds/Ba | Sqft | Sold | Price | $/sf | Match |
|---|---|---|---|---|---|---|---|
| 200 S Penn St | 0.68mi | 4/— (-1) | 2,042 (+0%) | 6mo | $193,000 | $95 | 58 |
| 117 E Burd St | 0.40mi | 4/— (-1) | 1,820 (-10%) | 3mo | $230,000 | $126 | 56 |
| 201-203 High St | 0.46mi | 6/— (+1) | 2,160 (+6%) | 11mo | $205,000 | $95 | 54 |
Match score weights: distance 35% · size 25% · config 20% · recency 20%. Top-matched comps best support the ARV.
Projected returns pro-forma
-3.0% appreciation · 3.0% rent growth · sell at horizon
- IRR
- -8.5%
- Equity multiple
- 0.69×
- Total profit
- $-18,308
- Equity at exit
- $31,312
- IRR
- 1.2%
- Equity multiple
- 1.09×
- Total profit
- $5,095
- Equity at exit
- $18,157
Cash invested: $58,800 (down + closing). Projections, not guarantees.
Landlord ↔ Tenant lean methodology
- Overall (STATE)
- 62 Landlord-Friendly
- State Pennsylvania
- 62 Landlord-Friendly · EVEN
- County
- — inherits STATE
- City
- — inherits STATE
ZIP-level market 17257
- Home prices YoY
- -17.3%
- Active inventory
- 161
- Price-to-rent
- 13.2×
Monthly cashflow live
- Estimated rent
- $2,651 high interval (Pro) →
- Mortgage (P&I)
- −$1,101
- Tax from tax record
- −$237 /mo · $2,840/yr
- Insurance
- −$88
- Flood insurance flood zone
- −$427 /mo · $5,118/yr
- HOA
- −$0
- Vacancy / Maint / Mgmt
- −$557
- Net cashflow
- $242
Break-even live
2-unit breakdown (identical units grouped — click to expand)
| Units | Beds | Baths | Est. rent |
|---|---|---|---|
| 2× units | 2 | 1 | $2,650 |
| #1 | 2 | 1 | $1,325 |
| #2 | 2 | 1 | $1,325 |
| Total (2 units) | $2,651 | ||
UW: 25.0% down · 7.5% · 30yr · 1.5% tax · 5.0% vac · 8.0% maint · 8.0% mgmt
Financing live
Cash to close
- Down payment
- $52,500
- Closing costs
- $6,300
- Reserves months
- —
- Total cash needed
- —
Loan-product check · same deal, 3 products live
Conventional
25% down · 7.5% · 30yr
- Down + closing
- —
- Monthly P&I
- —
- Monthly cashflow
- —
- DSCR
- —
- Eligible?
- —
Personal DTI + credit; lowest rate.
DSCR
20% down · 8.5% · 30yr
- Down + closing
- —
- Monthly P&I
- —
- Monthly cashflow
- —
- DSCR
- —
- Eligible?
- —
No personal income docs; deal must DSCR.
Hard money
10% down · 12.0% · 12mo
- Down + closing
- —
- Monthly P&I
- —
- Monthly cashflow
- —
- DSCR
- —
- Eligible?
- —
Short-term bridge; refi at stabilization.
Rent comps 5 comps
| Address | Beds | Baths | Sqft | Rent | $/sqft | DOM | Units | Dist |
|---|---|---|---|---|---|---|---|---|
| 1007 Hot Point Ave Shippensburg, PA | 4.0 | 2.5 | 1654 | $1,550 | $0.94 | 43d | 1 | 0.19mi |
| 2 Morningstar Ln Unit The Villa Shippensburg, PA | 4.0 | 2.0 | 1400 | $1,500 | $1.07 | 23d | 1 | 0.24mi |
| 2 Morningstar Ln Shippensburg, PA | 4.0 | 2.0 | 1400 | $1,500 | $1.07 | 14d | 1 | 0.29mi |
| 100 Bard Dr Shippensburg, PA | 2.0–4.0 | 1.0–2.5 | 1116 | $1,747 | $1.57 | 14d | 6 | 0.39mi |
| 353 Farmington Dr Shippensburg, PA | 3.0–4.0 | 2.0 | 1675 | $2,050 | $1.22 | 14d | 1 | 1.41mi |
Listing history 38 events
-
2026-06-18days on market $210,000 Active 30 DOM
-
2026-06-17days on market $210,000 Active 29 DOM
-
2026-06-16days on market $210,000 Active 28 DOM
-
2026-06-15days on market $210,000 Active 27 DOM
-
2026-06-14days on market $210,000 Active 25 DOM
-
2026-06-13days on market $210,000 Active 24 DOM
-
2026-06-10days on market $210,000 Active 22 DOM
-
2026-06-09days on market $210,000 Active 21 DOM
-
2026-06-08days on market $210,000 Active 20 DOM
-
2026-06-07days on market $210,000 Active 19 DOM
-
2026-06-03days on market $210,000 Active 15 DOM
-
2026-06-02days on market $210,000 Active 14 DOM
-
2026-06-01days on market $210,000 Active 13 DOM
-
2026-05-31days on market $210,000 Active 12 DOM
-
2026-05-31days on market $210,000 Active 11 DOM
-
2026-05-19historical
Show marketing remark (701 chars)
This detached duplex is the income-producing property you've been waiting for. Two fully separate units, each with 2 bedrooms, 1 bathroom, and 2 dedicated parking spaces — that's 4 total parking spots for the building, a rare and highly sought-after feature. Both units are already leased with tenants moving in May 24th at $1,100/month per unit — meaning you'll start collecting $2,200/month in rental income from day one. No waiting, no vacancy, no stress. Whether you're a seasoned investor looking to grow your portfolio or a first-time buyer ready to house hack your way to financial freedom, this property delivers the steady cash flow you're looking for. Schedule your showing today
-
2026-05-19$210,000 Active 701-char remark
Show marketing remark (701 chars)
This detached duplex is the income-producing property you've been waiting for. Two fully separate units, each with 2 bedrooms, 1 bathroom, and 2 dedicated parking spaces — that's 4 total parking spots for the building, a rare and highly sought-after feature. Both units are already leased with tenants moving in May 24th at $1,100/month per unit — meaning you'll start collecting $2,200/month in rental income from day one. No waiting, no vacancy, no stress. Whether you're a seasoned investor looking to grow your portfolio or a first-time buyer ready to house hack your way to financial freedom, this property delivers the steady cash flow you're looking for. Schedule your showing today
-
2026-05-13status Active
-
2026-04-27historical
-
2026-04-04status Active
-
2026-03-30status Pending
-
2026-03-16$210,000 Active
-
2026-03-13historical
-
2024-08-21soldstatus $173,000
-
2024-08-19soldstatus $173,000 Closed
-
2024-06-28status Pending
-
2024-06-05price $169,900
-
2024-05-22price $175,000
-
2024-05-22status Active
-
2024-05-09status Pending
-
2024-05-08historical
-
2024-04-19$177,000 Active
-
2023-04-28soldstatus $150,000
-
2023-04-19historical
-
2023-04-19soldstatus $150,000 Closed
-
2023-03-22status Pending
-
2023-03-06$150,000 Active
-
1987-02-03soldstatus $45,000
ⓘ Source: listings_history table (triggers on properties + properties_extension) + one-shot
backfill from property_details.listing_events for pre-trigger history.
Tax reassessment forecast PA · Partial reset (capped growth)
- Current annual tax
- $2,840 · $237/mo
- Projected year-2 tax
- $3,079 · $257/mo
- Expected delta
- +$239/yr (+$20/mo · 8.4%)
ⓘ Screening estimate from a state-policy table — verify with the county assessor before closing.
Climate risk First Street
- Flood 9/10 Extreme FEMA zone AE · 99% chance over 30 yrs
- Wildfire 2/10 Low
- Heat 5/10 Major 7 d/yr ≥100°F today · 15 d/yr by 30 yrs out
- Wind 2/10 Low 100% chance of damaging wind over 30 yrs
- Air quality 2/10 Low 1 unhealthy d/yr today · 2 by 30 yrs out
Nearby sold comps map
Loading sold comps map…
Walkable amenities ~0.75 mi
Loading nearby amenities…
Taxation est. · year 1
- Rental income
- $31,812
- − Mortgage interest
- −$11,763
- − Property taxes
- −$2,840
- − Insurance
- −$6,169
- − Repairs & maintenance
- −$2,545
- − Management
- −$2,545
- − Depreciation
- −$6,109
- Taxable loss
- −$159
- Est. tax savings @ 24.0%
- +$38
- After-tax cash flow
- $2,946/yr
For passive investors: Depreciation is non-cash, so a rental often shows a tax loss while cash-flowing — sheltering income. Rental losses are passive: they offset passive income freely, and up to $25,000/yr can offset ordinary (W-2) income if you actively participate and your MAGI is under $100k (phasing out to $0 by $150k); unused losses carry forward. On sale, claimed depreciation is recaptured at up to 25%, and gains may owe capital-gains tax (a 1031 exchange can defer both). Figures are a year-1 estimate at your 24.0% rate — not tax advice; consult a CPA.
Schools (NCES district)
- District
- Shippensburg Area SD
- NCES district ID
- 4221570
- Math proficiency
- 31% ▼ -21.00%
- Reading proficiency
- 52% ▼ -14.00%
- Median HH income
- $47,585
- Composite
- 35.42/100
- National rank
- #4938
- State rank
- #335 of 539 in PA
Livability — Shippensburg
- Score
- 70/100
- State rank
- #741
- US rank
- #7436
Category grades
Schools grade is shown separately in the Schools card above.
Census & demographics
- County
- Cumberland County · 257,673 people
- City population
- 29,204
- Metro
- Harrisburg-Carlisle, PA
- Population (ZIP)
- 29,204
- Household income
- $71,181
- Rent vs Own
- Severe rent burden
- 855.0
Population outlook (Cumberland County) Hauer SSP2
- Today (2025)
- 267,950 people
- By 2030
- 278,105 · +3.8%
- By 2040
- 296,552 · +10.7%
- By 2050
- 312,937 · +16.8%
- By 2075
- 349,233 · +30.3%
- By 2100
- 361,875 · +35.1%
Race, ethnicity, and origin ACS 2023
- Neighborhood character
- Predominantly White (89%)
- Race & ethnicity
- White 89% Black 4% Two or more races 3% Hispanic / Latino 3% Asian 2%
- Common ancestry
- Romanian 2% Slovak 2% Serbian 1%
- Foreign-born
- 4% · Canada, China
- Languages at home
- 90% English-only · German/W. Germanic 5% Spanish 2% Other Indo-European 1%
Political lean MEDSL · Cumberland
- 2024 margin
- Lean R (+9.4) · D 44.6% · R 54.1% · Other 1.3%
- 2008→2024 swing
- +4.2pp toward D · 2008: -13.6pp · 2024: -9.4pp
- All cycles
- 2024: R+9.4 2020: R+10.6 2016: R+18.6 2012: R+18.5 2008: R+13.6
Not yet ingested
- Civics
- —
Market trends
- HPI YoY
- ▼ -62.12%
- Current HPI
- 297.1586
- Rent YoY
- —
- Metro
- Harrisburg-Carlisle, PA
- State GDP YoY
- ▲ 1.68%
- F500 in state
- 34
Industry mix (Fortune 500 HQ in PA)
| Industry | F500 HQs | Revenue |
|---|---|---|
| Healthcare | 2 | $309B |
|
||
| Insurance | 2 | $27B |
|
||
| Telecommunications / Media | 1 | $124B |
|
||
| Industrial Distribution | 1 | $22B |
|
||
| Financial Services | 1 | $20B |
|
||
| Chemicals / Materials | 1 | $18B |
|
||
Price history
+366.7% since first listed23 events — show timeline
- 2026-05-19 Listed $210,000 BRIGHT MLS
- 2026-05-19 Listing Removed — BRIGHT MLS
- 2026-05-13 Relisted — BRIGHT MLS
- 2026-04-27 Listing Removed — BRIGHT MLS
- 2026-04-04 Relisted — BRIGHT MLS
- 2026-03-30 Pending — BRIGHT MLS
- 2026-03-16 Listed $210,000 BRIGHT MLS
- 2026-03-13 Coming Soon — BRIGHT MLS
- 2024-08-21 Sold (Public Records) $173,000 Public Records
- 2024-08-19 Sold (MLS) $173,000 BRIGHT MLS
- 2024-06-28 Pending — BRIGHT MLS
- 2024-06-05 Price Changed $169,900 BRIGHT MLS
- 2024-05-22 Price Changed $175,000 BRIGHT MLS
- 2024-05-22 Relisted — BRIGHT MLS
- 2024-05-09 Pending — BRIGHT MLS
- 2024-05-08 Listing Removed — BRIGHT MLS
- 2024-04-19 Listed $177,000 BRIGHT MLS
- 2023-04-28 Sold (Public Records) $150,000 Public Records
- 2023-04-19 Listing Removed — BRIGHT MLS
- 2023-04-19 Sold (MLS) $150,000 BRIGHT MLS
- 2023-03-22 Pending — BRIGHT MLS
- 2023-03-06 Listed $150,000 BRIGHT MLS
- 1987-02-03 Sold (Public Records) $45,000 Public Records
Property tax history
+2.9%/yrLatest (2026): $2,840 · +3.5% YoY. Source: county tax records.
Cash-flow waterfall
monthlySold comps — $/sqft
last 12 mo · ≤1 miLoading sold comps…