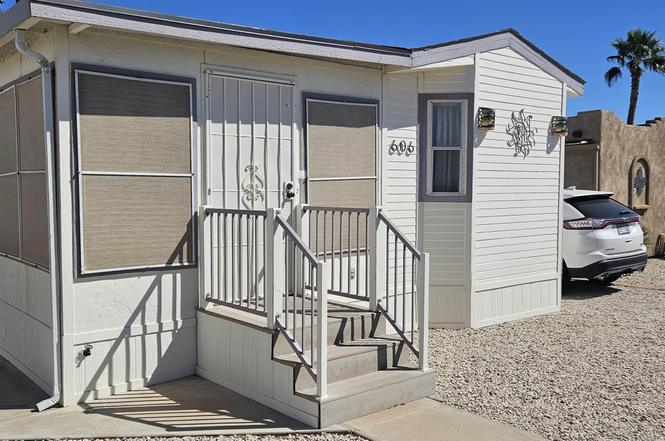
5707 E 32 St #606 · Yuma, AZ
Flood risk 1/10 · Minimal
- FEMA flood zone
- X (shaded)
- Chance of flooding over 30 yrs
- 0.0%
- Est. flood insurance / yr
- $507 – $1,088
Fire risk 4/10 · Minor
- Est. fire insurance / yr
- $610 – $1,132
Heat risk 9/10 · Severe
- Hot days now (above 114°F)
- 6 days/yr
- Hot days in 30 yrs
- 15 days/yr
Wind risk 1/10 · Minimal
- Chance of severe wind over 30 yrs
- —
Air-quality risk 2/10 · Minimal
- Unhealthy air days now
- 1 days/yr
- Unhealthy air days in 30 yrs
- 1 days/yr
Risk factors via First Street. Map © Google.
Why this score? — see what drove the F grade
The composite is a weighted blend of 9 inputs, each scored 0–100. Each bar is that input's sub-score; the figure is the points it added to the 100-point composite (weight × sub-score).
- ARV discount +10.5/15.0
- Cash flow +8.2/30.0
- 1% rule +4.1/10.0
- Livability +3.6/5.0
- Condition / age +2.5/5.0
- Rent growth +2.4/5.0
- DSCR +2.2/10.0
- Schools +1.3/10.0
- Appreciation +0.0/10.0
$125,000
🖨 Deal sheet 📄 Offer letter ✓ Due diligence
Listing remarks
Beautiful view lot on the greenbelt of Country Roads RV Village. Well maintained, fully furnished with washer and dryer. Plenty of storage, large patio and newer 4 ton HVAC.
Key facts
- Greenbelt
- Large patio
- Fully furnished
Tags
Property features AI
Finance
- HOA & community: Homeowners association; Association fee of $267
Exterior
- Parking: Open parking
- Security: Gated community
- Utilities: Public water
- Home design: Manufactured home; Single-story
- Exterior features: Patio; Sliding doors; View; Shed(s); Paved road access; Lot about 2,400 square feet
Interior
- Kitchen: Refrigerator; Microwave; Electric range
- Flooring: Laminate; Other
- Bathrooms: 1 full bathroom
- Heating & cooling: Has heating; Has cooling
- Interior features: Blinds and drapes; Water softener (owned); Water purifier; Smoke detector(s)
- Laundry & utility: Washer; Dryer
Neighborhood map
What this means for you Summary
Snapshot
- This is a 1-bed/1.0-bath manufactured listed at $125k.
Deal economics
- At list price, monthly cash flow is $-119 ($-1k/yr) — negative.
- To cash-flow at today's rent, offer at most $104k (16.8% below list).
- To meet the 1% rule (rent ≥ 1% of price), the offer needs to be $113k (9.2% below list).
- Recommended offer: $104k (16.8% below list) — sets the bar for cash-flow.
- Cap rate 5.2% vs local median 3.9% in Yuma — top-decile yield for the area; either an underpriced asset or a hidden risk that comps aren't pricing in. Stress-test before assuming the spread holds.
Location & tenants
- Location reads 71/100 on livability (#30 in AZ) — a middle-class / working-renter tenant base. Strengths: cost of living A+, housing A+, health & safety A+; Watch: schools C-, crime C-, employment D.
- Yuma Union High School District (4507) (urban): math 14% / reading 16% proficiency, ranked #212 of 249 in AZ (top 85%) — low school quality limits family demand, transient renter base, plan for 1-2y turnover.
- Market conditions: Rents soft (-0.4%/yr); 472 active listings in the ZIP; 1,399 units permitted in Yuma County in 2024 (180 in 5+ unit buildings).
Forward outlook
- Local home prices are declining (-3.0%/yr); year-one equity from $864 of loan paydown is wiped out by about $4k of value loss. Plan a longer hold.
- Yuma County population projected at +4% by 2050 — modest demand growth; plan on rents tracking national, not racing it.
Negotiation context
- It's been on market 183 days — a 12% lower offer ($110k) is reasonable based on typical stale-listing flexibility.
- 3 sale attempts; this cycle's ask has dropped $34k (21%) from the opening price — seller is motivated, your offer sets the floor, not the list.
- Current owner paid $12k; list at $125k implies a 964% gain — meaningful room to come down on a strong offer.
Risks & watch-outs
- Watch-outs: HOA is 24% of rent.
- Climate carrying-cost: extreme-heat days projected 6→15/yr by 2055 (HVAC capex compounding) — expect insurance premiums to compound above CPI over the hold.
Questions for the listing agent
- What do current leases actually rent for vs. the listed asking? Can we see a recent rent roll and the last 12 months of T-12 income?
- It's been on market 183 days. Have you received any prior offers? Is the seller open to a 17% concession, seller financing, or rate buy-down credit?
- What does the HOA fee cover, when was the last increase, and are there any pending special assessments or reserve-fund shortfalls?
- Why hasn't it sold? Are there any deal-killer items the seller is aware of (foundation, flood, title, zoning, code violations)?
- Is there a deadline driving the sale (1031 exchange, divorce, estate, relocation)? That informs how much negotiation room exists.
- The area grade is low — what's the realistic commute time and amenity access for the typical tenant pool here? Any planned neighborhood developments (good or bad) we should know about?
- What's the average days-on-market for RENTAL listings here right now (not sales)? A rising rental-DOM trend means longer vacancies and softer asking-rent achievability than the comps imply.
- What's the recent tenant-quality profile in this submarket — average credit score on applications, eviction rate, late-payment / NSF rate, and stable-employment percentage? A property-management company in the area should have these aggregated.
- How much new for-sale + rental construction is in the pipeline within 1–3 miles? Heavy new supply typically softens prices + rents 12–24 months out; constrained supply supports both.
Investment metrics
- 1% rule
- 0.91% ✗
- Cap rate
- 5.15%
- Cash-on-cash
- -4.07%
- DSCR
- 0.82
- GRM
- 9.2
CMA / ARV
- ARV (on-the-fly)
- $133,901
- Comps found
- 12
Show comp detail 12 sales within ~0.75 mi
| Address | Dist | Beds/Ba | Sqft | Sold | Price | $/sf | Match |
|---|---|---|---|---|---|---|---|
| 5707 E 32 St #1258 | 0.37mi | 1/1.0 | 456 (-0%) | 4mo | $154,000 | $338 | 80 |
| 5707 E 32 St #1000 | 0.27mi | 1/1.0 | 413 (-10%) | 1mo | $99,900 | $242 | 71 |
| 5707 E 32 St #845 | 0.14mi | 1/1.5 | 408 (-11%) | 4mo | $137,000 | $336 | 71 |
| 5707 E 32 St #490 | 0.09mi | 1/1.0 | 396 (-13%) | 4mo | $85,000 | $215 | 70 |
| 5707 E 32 St #396 | 0.17mi | 1/1.5 | 408 (-11%) | 5mo | $160,000 | $392 | 68 |
| 5707 E 32 St #1026 | 0.28mi | 1/1.0 | 408 (-11%) | 2mo | $125,000 | $306 | 68 |
| 5707 E 32 St #238 | 0.38mi | 1/1.0 | 408 (-11%) | 2mo | $80,000 | $196 | 63 |
| 5707 E 32 St #1242 | 0.28mi | 1/1.0 | 396 (-13%) | 5mo | $116,000 | $293 | 61 |
| 5707 E 32 St #1103 | 0.37mi | 1/1.0 | 408 (-11%) | 5mo | $130,000 | $319 | 61 |
| 5707 E 32 St #1105 | 0.36mi | 1/1.0 | 396 (-13%) | 3mo | $115,000 | $290 | 58 |
| 5707 E 32 St #263 | 0.33mi | 2/1.5 (+1) | 408 (-11%) | 3mo | $50,000 | $123 | 58 |
| 5707 E 32 St #75 | 0.43mi | 1/1.0 | 396 (-13%) | 4mo | $70,000 | $177 | 54 |
Match score weights: distance 35% · size 25% · config 20% · recency 20%. Top-matched comps best support the ARV.
Projected returns pro-forma
-3.0% appreciation · 0.0% rent growth · sell at horizon
- IRR
- -27.2%
- Equity multiple
- 0.11×
- Total profit
- $-31,038
- Equity at exit
- $18,638
- IRR
- -45.1%
- Equity multiple
- -0.40×
- Total profit
- $-49,174
- Equity at exit
- $10,808
Cash invested: $35,000 (down + closing). Projections, not guarantees.
Landlord ↔ Tenant lean methodology
- Overall (STATE)
- 87 Strongly Landlord-Friendly
- State Arizona
- 87 Strongly Landlord-Friendly · R+3
- County
- — inherits STATE
- City
- — inherits STATE
ZIP-level market 85365
- Home prices YoY
- -23.6%
- Rents YoY
- -0.4%
- Active inventory
- 472
- Price-to-rent
- 9.2×
Monthly cashflow live
- Estimated rent
- $1,134 medium interval (Pro) →
- Mortgage (P&I)
- −$656
- Tax from tax record
- −$40 /mo · $486/yr
- Insurance
- −$52
- HOA
- −$267
- Vacancy / Maint / Mgmt
- −$238
- Net cashflow
- $-119
Break-even live
UW: 25.0% down · 7.5% · 30yr · 1.5% tax · 5.0% vac · 8.0% maint · 8.0% mgmt
Financing live
Cash to close
- Down payment
- $31,250
- Closing costs
- $3,750
- Reserves months
- —
- Total cash needed
- —
Loan-product check · same deal, 3 products live
Conventional
25% down · 7.5% · 30yr
- Down + closing
- —
- Monthly P&I
- —
- Monthly cashflow
- —
- DSCR
- —
- Eligible?
- —
Personal DTI + credit; lowest rate.
DSCR
20% down · 8.5% · 30yr
- Down + closing
- —
- Monthly P&I
- —
- Monthly cashflow
- —
- DSCR
- —
- Eligible?
- —
No personal income docs; deal must DSCR.
Hard money
10% down · 12.0% · 12mo
- Down + closing
- —
- Monthly P&I
- —
- Monthly cashflow
- —
- DSCR
- —
- Eligible?
- —
Short-term bridge; refi at stabilization.
HOA detail
- Monthly dues
- $267 · $3,204/yr
Listing history 27 events
-
2026-06-19days on market $125,000 Active 183 DOM
-
2026-06-18days on market $125,000 Active 182 DOM
-
2026-06-17days on market $125,000 Active 181 DOM
-
2026-06-16days on market $125,000 Active 180 DOM
-
2026-06-15days on market $125,000 Active 179 DOM
-
2026-06-14days on market $125,000 Active 177 DOM
-
2026-06-13days on market $125,000 Active 176 DOM
-
2026-06-10days on market $125,000 Active 174 DOM
-
2026-06-09days on market $125,000 Active 173 DOM
-
2026-06-08days on market $125,000 Active 172 DOM
-
2026-06-07days on market $125,000 Active 171 DOM
-
2026-06-05days on market $125,000 Active 168 DOM
-
2026-06-02days on market $125,000 Active 166 DOM
-
2026-06-01days on market $125,000 Active 165 DOM
-
2026-05-31days on market $125,000 Active 164 DOM
-
2026-05-30days on market $125,000 Active 163 DOM
-
2026-05-20status Active
-
2026-05-20price $125,000
-
2026-04-03status Pending
-
2026-03-08price $120,000
-
2025-12-30status Active
-
2025-12-30status Pending
-
2025-12-09price $137,500
-
2025-11-19price $142,500
-
2025-04-07$159,000 Active
-
1992-02-03soldstatus $11,750
-
1991-12-01soldstatus $11,750
ⓘ Source: listings_history table (triggers on properties + properties_extension) + one-shot
backfill from property_details.listing_events for pre-trigger history.
Tax reassessment forecast AZ · Resets to sale price
- Current annual tax
- $486 · $40/mo
- Projected year-2 tax
- $825 · $69/mo
- Expected delta
- +$339/yr (+$28/mo · 69.9%)
ⓘ Screening estimate from a state-policy table — verify with the county assessor before closing.
Climate risk First Street
- Flood 1/10 Low FEMA zone X (shaded) · 0% chance over 30 yrs
- Wildfire 4/10 Moderate
- Heat 9/10 Extreme 6 d/yr ≥114°F today · 15 d/yr by 30 yrs out
- Wind 1/10 Low
- Air quality 2/10 Low 1 unhealthy d/yr today · 1 by 30 yrs out
Nearby sold comps map
Loading sold comps map…
Walkable amenities ~0.75 mi
Loading nearby amenities…
Taxation est. · year 1
- Rental income
- $13,614
- − Mortgage interest
- −$7,002
- − Property taxes
- −$486
- − Insurance
- −$625
- − Repairs & maintenance
- −$1,089
- − Management
- −$1,089
- − HOA
- −$3,204
- − Depreciation
- −$3,636
- Taxable loss
- −$3,517
- Est. tax savings @ 24.0%
- +$844
- After-tax cash flow
- $-582/yr
For passive investors: Depreciation is non-cash, so a rental often shows a tax loss while cash-flowing — sheltering income. Rental losses are passive: they offset passive income freely, and up to $25,000/yr can offset ordinary (W-2) income if you actively participate and your MAGI is under $100k (phasing out to $0 by $150k); unused losses carry forward. On sale, claimed depreciation is recaptured at up to 25%, and gains may owe capital-gains tax (a 1031 exchange can defer both). Figures are a year-1 estimate at your 24.0% rate — not tax advice; consult a CPA.
Schools (NCES district)
- District
- Yuma Union High School District (4507)
- NCES district ID
- 0409630
- Math proficiency
- 14% ▼ -12.00%
- Reading proficiency
- 16% ▼ -10.00%
- Median HH income
- $40,512
- Composite
- 12.86/100
- National rank
- #9592
- State rank
- #212 of 249 in AZ
Livability — Yuma
- Score
- 71/100
- State rank
- #30
- US rank
- #6635
Category grades
Schools grade is shown separately in the Schools card above.
Census & demographics
- Census place
- Yuma, AZ
- County
- Yuma County · 149,809 people
- City population
- 149,809
- Metro
- Yuma, AZ
- Population (ZIP)
- 54,775
- Household income
- $70,331
- Rent vs Own
- Severe rent burden
- 766.0
Population outlook (Yuma County) Hauer SSP2
- Today (2025)
- 211,633 people
- By 2030
- 214,114 · +1.2%
- By 2040
- 217,856 · +2.9%
- By 2050
- 220,276 · +4.1%
- By 2075
- 222,359 · +5.1%
- By 2100
- 198,880 · -6.0%
Race, ethnicity, and origin ACS 2023
- Neighborhood character
- Diverse neighborhood (Simpson 0.58)
- Race & ethnicity
- Hispanic / Latino 47% White 44% Two or more races 23% Black 2% Asian 1% Native American 1%
- Hispanic origin (detail)
- Mexican 43%
- Common ancestry
- Lithuanian 2% Italian 1% Romanian 1%
- Foreign-born
- 17% · Canada
- Languages at home
- 62% English-only · Spanish 36% Tagalog/Filipino 1% Other Asian/Pacific 1%
Political lean MEDSL · Yuma
- 2024 margin
- Strong R (+20.4) · D 39.3% · R 59.8%
- 2008→2024 swing
- -6.6pp toward R · 2008: -13.8pp · 2024: -20.4pp
- All cycles
- 2024: R+20.4 2020: R+6.2 2016: R+5.5 2012: R+16.1 2008: R+13.8
Not yet ingested
- Civics
- —
Market trends
- HPI YoY
- ▼ -75.03%
- Current HPI
- 242.8651
- Rent YoY
- ▼ -0.38%
- Metro
- Yuma, AZ
- State GDP YoY
- ▲ 4.54%
- F500 in state
- 20
Industry mix (Fortune 500 HQ in AZ)
| Industry | F500 HQs | Revenue |
|---|---|---|
| Technology | 2 | $13B |
|
||
| Mining / Metals | 1 | $23B |
|
||
| Environmental Services | 1 | $16B |
|
||
| Metals / Steel | 1 | $14B |
|
||
| Technology Distribution | 1 | $9B |
|
||
| Homebuilding | 1 | $8B |
|
||
Price history
+963.8% since first listed11 events — show timeline
- 2026-05-20 Relisted — YAR
- 2026-05-20 Price Changed $125,000 YAR
- 2026-04-03 Pending — YAR
- 2026-03-08 Price Changed $120,000 YAR
- 2025-12-30 Relisted — YAR
- 2025-12-30 Pending — YAR
- 2025-12-09 Price Changed $137,500 YAR
- 2025-11-19 Price Changed $142,500 YAR
- 2025-04-07 Listed $159,000 YAR
- 1992-02-03 Sold (Public Records) $11,750 Public Records
- 1991-12-01 Sold (Public Records) $11,750 Public Records
Property tax history
-3.7%/yrLatest (2025): $486 · +3.1% YoY. Source: county tax records.
Cash-flow waterfall
monthlySold comps — $/sqft
last 12 mo · ≤1 miLoading sold comps…