 🔨 Auction
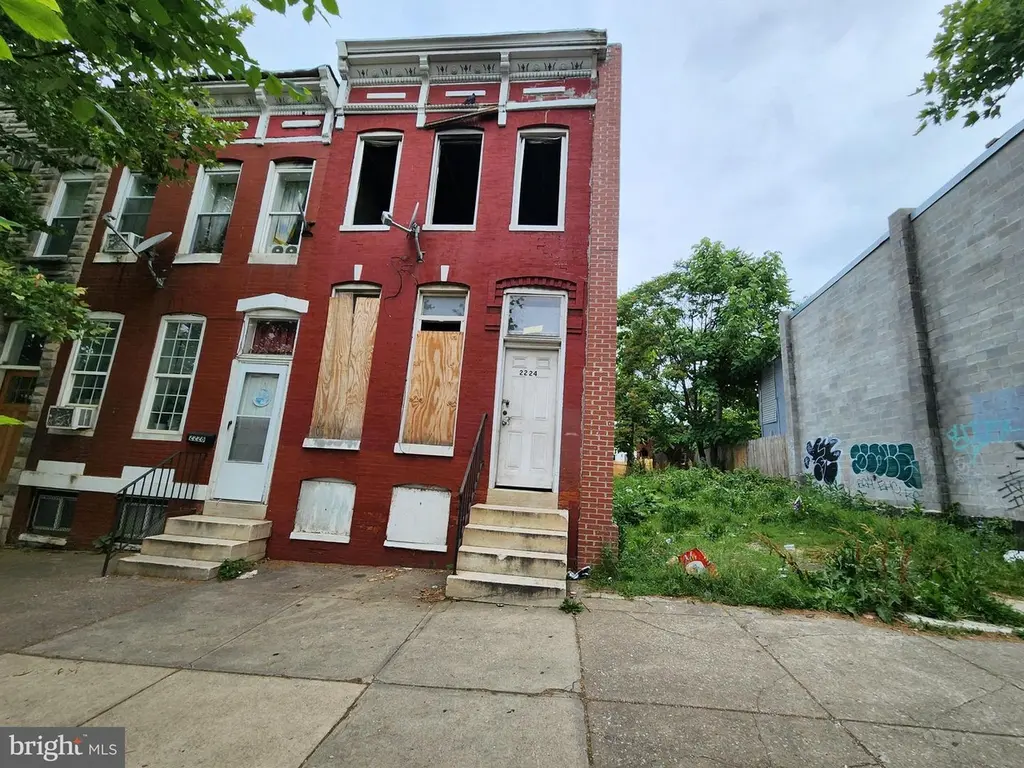
2224 Wilkens Ave · Baltimore, MD
Flood risk 1/10 · Minimal
- FEMA flood zone
- X (unshaded)
- Chance of flooding over 30 yrs
- 0.0%
- Est. flood insurance / yr
- $473 – $860
Fire risk 1/10 · Minimal
- Est. fire insurance / yr
- $755 – $1,403
Heat risk 7/10 · Major
- Hot days now (above 103°F)
- 7 days/yr
- Hot days in 30 yrs
- 15 days/yr
Wind risk 6/10 · Moderate
- Chance of severe wind over 30 yrs
- 27.0%
Air-quality risk 3/10 · Minor
- Unhealthy air days now
- 3 days/yr
- Unhealthy air days in 30 yrs
- 4 days/yr
Risk factors via First Street. Map © Google.
Why this score? — see what drove the B- grade
The composite is a weighted blend of 9 inputs, each scored 0–100. Each bar is that input's sub-score; the figure is the points it added to the 100-point composite (weight × sub-score).
- Cash flow +30.0/30.0
- 1% rule +10.0/10.0
- DSCR +10.0/10.0
- ARV discount +7.5/15.0
- Rent growth +4.4/5.0
- Livability +3.8/5.0
- Condition / age +2.5/5.0
- Schools +1.0/10.0
- Appreciation +0.0/10.0
$20,000
🖨 Deal sheet (PDF) 📄 Offer letter ✓ Due diligence
Listing remarks MLS
ONLINE AUCTION: Bidding begins 3/24/2025 @ 10:00 AM. Bidding ends 3/26/2025 @ 6:50 PM. List Price is Suggested Opening Bid. Deposit: $5,000. This three-story end-unit townhouse at 2224 Wilkens Ave in Baltimore's Carrollton Ridge neighborhood is currently vacant. The property is within +/- 1 mile of Carroll Park, a 117-acre green space offering various recreational facilities. Major traffic routes nearby include Wilkens Avenue and South Monroe Street, providing access to downtown Baltimore and surrounding areas. Public transportation is available via LocalLink bus routes.
Key facts
- Built 1920
- Listed 2 days
Property features AI
Finance
- Financial info: Ownership interest: Ground rent; Land assessed value: $7,000; Improvement assessed value: $29,000; Tax assessed value: $36,000; Annual tax amount: $747 (2025); City/town tax: $712; County tax: $35; Assessment year: 2026; Income/expense note: Annual Ground Rent
Exterior
- Parking: On-street parking
- Utilities: Public water; Public septic
- Home design: End of row townhouse; Property is in city limits (Baltimore City)
- Construction: Brick construction; Foundation: Other; Other structures above grade and below grade; Above grade finished area: 1,010 (assessor); Below grade unfinished area: 430 (assessor); Total below grade area: 430; Year built source: Assessor
- Exterior features: Lot dimensions approximately 14 x 80; Ground rent exists ($56, semi-annually)
Interior
- Bedrooms: 3 bedrooms on the main level
- Bathrooms: 1 full bathroom on the main level; 1 full bathroom total
- Heating & cooling: Heating: Other; Heating fuel: Other; Cooling: Other; Cooling fuel: Other; Hot water: Other
- Interior features: Basement present (other type); Living area source: Assessor
Neighborhood map
What this means for you Summary
Snapshot
- This is a 3-bed/1.0-bath townhouse listed at $20k.
Deal economics
- At list price, monthly cash flow is $804 ($10k/yr) — positive.
- The deal already cash-flows at list — no discount required.
- Meets the 1% rule at list price ($2k rent vs $20k).
- Cap rate 18.5% vs local median 6.0% in Baltimore — top-decile yield for the area; either an underpriced asset or a hidden risk that comps aren't pricing in. Stress-test before assuming the spread holds.
Location & tenants
- Location reads 76/100 on livability (#90 in MD, #3,396 nationally) — a middle-class / working-renter tenant base. Strengths: amenities A+, commute A+, housing A+; Watch: crime F.
- Baltimore City Public Schools (urban): math 7% / reading 16% proficiency, ranked #24 of 24 in MD (top 100%) — low school quality limits family demand, transient renter base, plan for 1-2y turnover; 79% free/reduced lunch — lower-income household profile, screen leases tightly.
- Zoned schools: Elmer A. Henderson: A Johns Hopkins Partnership (math 2% / reading 16%, grade F, #650 of 860 statewide, top 77%, 642 students, 80% FRL); Vanguard Collegiate Middle (math 3% / reading 15%, grade F, #212 of 225 statewide, top 95%, 343 students, 84% FRL); Baltimore Polytechnic Institute (math 71% / reading 84%, grade A-, #22 of 222 statewide, top 10%, 1,555 students, 43% FRL).
- Zoned-school proficiency averages 32% at this address vs 12% district-wide (+20 pts) — the actual schools serving this property are materially stronger than the Baltimore City Public Schools average implies; a family-tenant draw the district grade alone would hide.
- Market conditions: Rents rising fast (+7.5%/yr); 425 active listings in the ZIP; 40 comparable units currently listed for rent nearby; rentals at typical pace (median 26d on market — plan ~3-4 weeks tenant-placement turnaround); 1,273 units permitted in Baltimore city in 2024 (1,104 in 5+ unit buildings).
- This rent runs 43% of the median local income ($46k/yr) — at the standard rent-burdened threshold; future hikes will face affordability resistance.
Forward outlook
- Local home prices are declining (-3.0%/yr); year-one equity from $545 of loan paydown is wiped out by about $2k of value loss. Plan a longer hold.
- Baltimore County population projected to shrink 4% by 2050 — rents likely to lag national; underwrite the cash flow, not the appreciation.
- At projected returns (-3.0% appreciation + 7.5% rent growth), your $22k cash investment doubles in ~3 years — after that, you're playing with house money.
Negotiation context
- Only 2 days on market — expect competitive offers; lowballing is unlikely to land.
- 4 sale attempts since 28y ago with the ask held roughly flat each time — persistent listings suggest the price (not the market) is what's stuck; bring a comps-based counter.
Risks & watch-outs
- Watch-outs: property tax is 3.7% of price; built in 1920 — expect roof / HVAC / electrical / plumbing capex.
- Climate carrying-cost: major wind risk, 27% chance of damaging wind over 30y; extreme-heat days projected 7→15/yr by 2055 (HVAC capex compounding) — expect insurance premiums to compound above CPI over the hold.
Questions for the listing agent
- Built in 1920 — when were the roof, HVAC, electrical panel, plumbing, and water heater last replaced?
- Property tax is high relative to price — has the assessment been appealed recently, and will the sale trigger a re-assessment?
- Is there a deadline driving the sale (1031 exchange, divorce, estate, relocation)? That informs how much negotiation room exists.
- Schools are D-rated, which usually means shorter tenancies and higher turnover. Who's the typical renter profile here, and what's been the actual vacancy rate?
- Crime grade is F in this area — have there been break-ins, vandalism, or insurance claims at this property in the last 3 years? What carrier currently insures it and at what premium?
- What's the average days-on-market for RENTAL listings here right now (not sales)? A rising rental-DOM trend means longer vacancies and softer asking-rent achievability than the comps imply.
- What's the recent tenant-quality profile in this submarket — average credit score on applications, eviction rate, late-payment / NSF rate, and stable-employment percentage? A property-management company in the area should have these aggregated.
- How much new for-sale + rental construction is in the pipeline within 1–3 miles? Heavy new supply typically softens prices + rents 12–24 months out; constrained supply supports both.
Investment metrics
- 1% rule
- 2.11% ✓
- Cap rate
- 18.55%
- Cash-on-cash
- 43.76%
- DSCR
- 2.95
- GRM
- 4.0
CMA / ARV
- ARV (on-the-fly)
- $78,780
- Comps found
- 12
Show comp detail 12 sales within ~0.75 mi
| Address | Dist | Beds/Ba | Sqft | Sold | Price | $/sf | Match |
|---|---|---|---|---|---|---|---|
| 2130 Eagle St | 0.08mi | 4/2.0 (+1) | 1,000 (-1%) | 2mo | $78,110 | $78 | 84 |
| 528 S Bentalou St | 0.06mi | 4/3.0 (+1) | 1,032 (+2%) | 1mo | $190,000 | $184 | 80 |
| 2402 Wilkens Ave | 0.14mi | 2/1.0 (-1) | 1,092 (+8%) | 1mo | $45,000 | $41 | 74 |
| 2408 Wilkens Ave | 0.15mi | 3/2.0 | 1,092 (+8%) | 2mo | $99,900 | $91 | 74 |
| 2637 Dulany St | 0.35mi | 3/1.0 | 972 (-4%) | 6mo | $35,000 | $36 | 73 |
| 205 S Bentalou St | 0.26mi | 3/1.0 | 1,080 (+7%) | 5mo | $38,500 | $36 | 72 |
| 2008 Wilkens Ave | 0.19mi | 2/1.5 (-1) | 1,100 (+9%) | 4mo | $145,000 | $132 | 67 |
| 1910 W Fayette St | 0.65mi | 3/1.0 | 1,020 (+1%) | 4mo | $39,000 | $38 | 65 |
| 420 S Smallwood St | 0.12mi | 3/3.5 | 910 (-10%) | 4mo | $100,000 | $110 | 64 |
| 305 S Calhoun St | 0.70mi | 3/1.0 | 1,008 (-0%) | 4mo | $40,000 | $40 | 63 |
| 43 Wheeler Ave N | 0.59mi | 3/1.0 | 1,144 (+13%) | 3mo | $34,000 | $30 | 48 |
| 1404 Lemmon St | 0.72mi | 3/2.0 | 1,100 (+9%) | 1mo | $189,000 | $172 | 47 |
Match score weights: distance 35% · size 25% · config 20% · recency 20%. Top-matched comps best support the ARV.
Projected returns pro-forma
-3.0% appreciation · 7.51% rent growth · sell at horizon
- IRR
- 45.6%
- Equity multiple
- 3.10×
- Total profit
- $46,353
- Equity at exit
- $11,746
- IRR
- 53.3%
- Equity multiple
- 7.43×
- Total profit
- $141,848
- Equity at exit
- $6,811
Cash invested: $22,058 (down + closing). Projections, not guarantees.
Landlord ↔ Tenant lean methodology
- Overall (CITY)
- 12 Strongly Tenant-Friendly
- State Maryland
- 27 Tenant-Leaning · D+14
- County
- — inherits STATE
- City Baltimore
- 12 Strongly Tenant-Friendly · D+58
ZIP-level market 21223
- Rents YoY
- 7.5%
- Active inventory
- 425
- Price-to-rent
- 1.0×
Monthly cashflow live
- Estimated rent
- $1,661 high interval (Pro) →
- Mortgage (P&I)
- −$413
- Tax from tax record
- −$62 /mo · $744/yr
- Insurance
- −$33
- HOA
- −$0
- Vacancy / Maint / Mgmt
- −$349
- Net cashflow
- $804
Break-even live
Sensitivity live
| Price | -10% $849 | -5% $827 | +0% $804 | +5% $782 | +10% $760 |
|---|---|---|---|---|---|
| Rent | -10% $673 | -5% $739 | +0% $804 | +5% $870 | +10% $936 |
| Rate | -1.0pp $844 | -0.5pp $824 | base $804 | +0.5pp $784 | +1.0pp $763 |
UW: 25.0% down · 7.5% · 30yr · 1.5% tax · 5.0% vac · 8.0% maint · 8.0% mgmt
Financing live
Cash to close
- Down payment
- $19,695
- Closing costs
- $2,363
- Reserves months
- —
- Total cash needed
- —
Loan-product check · same deal, 3 products live
Conventional
25% down · 7.5% · 30yr
- Down + closing
- —
- Monthly P&I
- —
- Monthly cashflow
- —
- DSCR
- —
- Eligible?
- —
Personal DTI + credit; lowest rate.
DSCR
20% down · 8.5% · 30yr
- Down + closing
- —
- Monthly P&I
- —
- Monthly cashflow
- —
- DSCR
- —
- Eligible?
- —
No personal income docs; deal must DSCR.
Hard money
10% down · 12.0% · 12mo
- Down + closing
- —
- Monthly P&I
- —
- Monthly cashflow
- —
- DSCR
- —
- Eligible?
- —
Short-term bridge; refi at stabilization.
Rent comps 40 comps
| Address | Beds | Baths | Sqft | Rent | $/sqft | DOM | Units | Dist |
|---|---|---|---|---|---|---|---|---|
| 514 S Payson St Unit 2 Baltimore, MD | 3.0 | 2.0 | 1264 | $1,750 | $1.38 | 45d | 1 | 0.18mi |
| 307 S Smallwood St Baltimore, MD | 2.0 | 2.5 | 1400 | $1,350 | $0.96 | 45d | 1 | 0.20mi |
| 2514 Wilkens Ave Baltimore, MD | 4.0 | 1.0 | 1344 | $1,800 | $1.34 | 12d | 1 | 0.22mi |
| 2514 Wilkens Ave Baltimore, MD | 4.0 | 1.0 | 1344 | $1,800 | $1.34 | 45d | 1 | 0.22mi |
| 2509 Christian St Baltimore, MD | 4.0 | 2.0 | 1248 | $1,699 | $1.36 | 5d | 1 | 0.23mi |
| 2540 Frederick Ave Baltimore, MD | 3.0 | 1.0 | 1075 | $1,400 | $1.30 | 25d | 1 | 0.34mi |
| 332 S Franklintown Rd Unit 2 Baltimore, MD | 2.0 | 1.0 | 776 | $795 | $1.02 | 25d | 1 | 0.39mi |
| 2671 Saint Benedict St Baltimore, MD | 2.0 | 1.0 | 1144 | $1,325 | $1.16 | 45d | 1 | 0.40mi |
| 110 S Catherine St Unit 1 Baltimore, MD | 2.0 | 1.0 | 1330 | $1,500 | $1.13 | 45d | 1 | 0.40mi |
| 2657 Lehman St Unit 1 Baltimore, MD | 2.0 | 1.0 | 1056 | $1,000 | $0.95 | 45d | 1 | 0.40mi |
| 2225 W Baltimore St Baltimore, MD | 3.0 | 2.5 | 1200 | $1,600 | $1.33 | 25d | 1 | 0.47mi |
| 2232 W Baltimore St Baltimore, MD | 3.0 | 1.0 | 1250 | $1,875 | $1.50 | 25d | 1 | 0.50mi |
| 2738 Wilkens Ave Baltimore, MD | 3.0 | 1.0 | 1183 | $1,500 | $1.27 | 45d | 1 | 0.52mi |
| 2516 Hollins St Baltimore, MD | 3.0 | 2.0 | 1100 | $1,700 | $1.55 | 45d | 1 | 0.52mi |
| 2537 Hollins St Baltimore, MD | 3.0 | 2.0 | 1200 | $1,450 | $1.21 | 25d | 1 | 0.52mi |
| 2737 Wilkens Ave Baltimore, MD | 3.0 | 1.5 | 1232 | $1,650 | $1.34 | 6d | 1 | 0.52mi |
| 1918 W Baltimore St Baltimore, MD | 2.0–3.0 | 1.0–2.0 | 857 | $1,434 | $1.67 | 45d | 1 | 0.54mi |
| 1912 W Baltimore St Unit 2 Baltimore, MD | 2.0 | 1.5 | 1200 | $2,100 | $1.75 | 25d | 1 | 0.54mi |
| 62 N Gorman Ave Baltimore, MD | 3.0 | 2.0 | 1100 | $2,500 | $2.27 | 19d | 1 | 0.58mi |
| 1635 Frederick Ave Baltimore, MD | 3.0 | 2.0 | 1224 | $1,850 | $1.51 | 45d | 1 | 0.61mi |
| 1839 W Fayette St Baltimore, MD | 3.0 | 1.5 | 1426 | $1,675 | $1.17 | 25d | 1 | 0.62mi |
| 1601 Frederick Ave Unit 3 Baltimore, MD | 2.0 | 1.0 | 1050 | $1,050 | $1.00 | 6d | 1 | 0.67mi |
| 305 S Calhoun St Baltimore, MD | 2.0 | 1.0 | 1000 | $1,300 | $1.30 | 23d | 1 | 0.68mi |
| 2005 Penrose Ave Baltimore, MD | 3.0 | 1.0 | 1232 | $1,600 | $1.30 | 0d | 1 | 0.70mi |
| 1324 W Lombard St Unit 1 Baltimore, MD | 2.0 | 2.0 | 1100 | $1,500 | $1.36 | 25d | 1 | 0.76mi |
| 1324 W Lombard St Unit 2 Baltimore, MD | 2.0 | 1.5 | 1100 | $1,450 | $1.32 | 45d | 1 | 0.76mi |
| 2012 W Saratoga St Baltimore, MD | 3.0 | 1.0 | 1300 | $1,700 | $1.31 | 25d | 1 | 0.77mi |
| 1262 Glyndon Ave Baltimore, MD | 2.0 | 3.0 | 1258 | $1,850 | $1.47 | 25d | 1 | 0.77mi |
| 1303 James St Baltimore, MD | 2.0 | 1.5 | 1160 | $1,350 | $1.16 | 25d | 1 | 0.78mi |
| 1315 Hollins St Unit 2 Baltimore, MD | 3.0 | 2.0 | 1096 | $1,950 | $1.78 | 14d | 1 | 0.79mi |
| 1315 Hollins St Unit 2 Baltimore, MD | 3.0 | 2.0 | 1096 | $1,860 | $1.70 | 6d | 1 | 0.79mi |
| 1846 W Saratoga St Unit 1 Baltimore, MD | 2.0 | 1.0 | 1250 | $1,300 | $1.04 | 45d | 1 | 0.80mi |
| 1432 Carroll St Baltimore, MD | 2.0 | 1.5 | 912 | $1,900 | $2.08 | 45d | 1 | 0.80mi |
| 1101 S Carey St Baltimore, MD | 2.0 | 2.0 | 1400 | $1,200 | $0.86 | 23d | 1 | 0.80mi |
| 1127 S Carey St Baltimore, MD | 3.0 | 2.5 | 1340 | $1,900 | $1.42 | 6d | 1 | 0.83mi |
| 10 S Carey St Baltimore, MD | 2.0 | 1.0 | 1140 | $1,550 | $1.36 | 25d | 1 | 0.84mi |
| 104 S Carrollton Ave Baltimore, MD | 3.0 | 4.0 | 1232 | $2,200 | $1.79 | 0d | 1 | 0.85mi |
| 1253 Sargeant St Baltimore, MD | 2.0 | 1.5 | 1200 | $1,595 | $1.33 | 0d | 1 | 0.85mi |
| 1215 James St Baltimore, MD | 2.0 | 1.0 | 960 | $1,500 | $1.56 | 45d | 1 | 0.85mi |
| 1259 Washington Blvd Baltimore, MD | 3.0 | 3.0 | 1232 | $2,799 | $2.27 | 0d | 1 | 0.86mi |
Listing history 2 events
-
2026-06-21remarks 657-char remark
-
2026-06-21$20,000 Active 2 DOM
ⓘ Source: listings_history table (triggers on properties + properties_extension) + one-shot
backfill from property_details.listing_events for pre-trigger history.
Tax reassessment forecast MD · Partial reset (capped growth)
- Current annual tax
- $744 · $62/mo
- Projected year-2 tax
- $744 · $62/mo
- Expected delta
- $0/yr ($0/mo · 0.0%)
ⓘ Screening estimate from a state-policy table — verify with the county assessor before closing.
Climate risk First Street
- Flood 1/10 Low FEMA zone X (unshaded) · 0% chance over 30 yrs
- Wildfire 1/10 Low
- Heat 7/10 Severe 7 d/yr ≥103°F today · 15 d/yr by 30 yrs out
- Wind 6/10 Major 27% chance of damaging wind over 30 yrs
- Air quality 3/10 Moderate 3 unhealthy d/yr today · 4 by 30 yrs out
Nearby sold comps map
Loading sold comps map…
Walkable amenities ~0.75 mi
Loading nearby amenities…
Taxation est. · year 1
- Rental income
- $19,935
- − Mortgage interest
- −$4,413
- − Property taxes
- −$744
- − Insurance
- −$394
- − Repairs & maintenance
- −$1,595
- − Management
- −$1,595
- − Depreciation
- −$2,292
- Taxable income
- $8,903
- Est. tax owed @ 24.0%
- −$2,137
- After-tax cash flow
- $7,517/yr
For passive investors: Depreciation is non-cash, so a rental often shows a tax loss while cash-flowing — sheltering income. Rental losses are passive: they offset passive income freely, and up to $25,000/yr can offset ordinary (W-2) income if you actively participate and your MAGI is under $100k (phasing out to $0 by $150k); unused losses carry forward. On sale, claimed depreciation is recaptured at up to 25%, and gains may owe capital-gains tax (a 1031 exchange can defer both). Figures are a year-1 estimate at your 24.0% rate — not tax advice; consult a CPA.
Schools (NCES district)
- District
- Baltimore City Public Schools
- NCES district ID
- 2400090
- Math proficiency
- 7% ▼ -9.00%
- Reading proficiency
- 16% ▼ -5.00%
- Median HH income
- $42,108
- Composite
- 10.08/100
- National rank
- #9805
- State rank
- #24 of 24 in MD
Livability — Baltimore
- Score
- 76/100
- State rank
- #90
- US rank
- #3396
Category grades
Schools grade is shown separately in the Schools card above.
Census & demographics
- Census place
- Baltimore, MD
- County
- Baltimore City · 558,601 people
- City population
- 588,727
- Metro
- Baltimore-Columbia-Towson, MD
- Population (ZIP)
- 19,572
- Household income
- $45,840
- Rent vs Own
- Severe rent burden
- 1755.0
Population outlook (Baltimore County) Hauer SSP2
- Today (2025)
- 624,249 people
- By 2030
- 621,541 · -0.4%
- By 2040
- 609,756 · -2.3%
- By 2050
- 597,249 · -4.3%
- By 2075
- 552,236 · -11.5%
- By 2100
- 513,934 · -17.7%
Race, ethnicity, and origin ACS 2023
- Neighborhood character
- Predominantly Black (72%)
- Race & ethnicity
- Black 72% White 16% Hispanic / Latino 7% Two or more races 6% Asian 1%
- Hispanic origin (detail)
- Mexican 3% Puerto Rican 1%
- Common ancestry
- Romanian 1%
- Foreign-born
- 8% · Canada
- Languages at home
- 90% English-only · Spanish 6% French/Haitian/Cajun 2% Other Indo-European 1%
Political lean MEDSL · Baltimore
- 2024 margin
- Solid D (+73.0) · D 85.2% · R 12.2% · Other 2.6%
- 2008→2024 swing
- -2.5pp toward R · 2008: 75.5pp · 2024: 73.0pp
- All cycles
- 2024: D+73.0 2020: D+76.6 2016: D+74.6 2012: D+76.4 2008: D+75.5
Not yet ingested
- Civics
- —
Market trends
- HPI YoY
- ▼ -97.99%
- Current HPI
- 140.5836
- Rent YoY
- ▲ 7.51%
- Metro
- Baltimore-Columbia-Towson, MD
- State GDP YoY
- ▲ 2.97%
- F500 in state
- 12
Industry mix (Fortune 500 HQ in MD)
| Industry | F500 HQs | Revenue |
|---|---|---|
| Aerospace / Defense | 1 | $71B |
|
||
| Utilities | 1 | $25B |
|
||
| Hotels | 1 | $24B |
|
||
| Consumer Goods | 1 | $7B |
|
||
| Real Estate | 1 | $6B |
|
||
| Chemicals | 1 | $2B |
|
||
Price history
+58.7% since first listed10 events — show timeline
- 2026-06-19 Listed $20,000 BRIGHT MLS
- 2025-06-10 Sold (MLS) $31,350 BRIGHT MLS
- 2025-03-28 Pending — BRIGHT MLS
- 2025-03-11 Listed $10,000 BRIGHT MLS
- 2023-06-30 Pending — BRIGHT MLS
- 2023-06-30 Listing Removed — BRIGHT MLS
- 2023-06-16 Listed $20,000 BRIGHT MLS
- 1998-11-10 Delisted — MRIS
- 1998-06-11 Listed — MRIS
- 1986-08-08 Sold (Public Records) $12,600 Public Records
Property tax history
+3.0%/yrLatest (2025): $744 · +15.9% YoY. Source: county tax records.
Cash-flow waterfall
monthlySold comps — $/sqft
last 12 mo · ≤1 miLoading sold comps…