 🌊 Lakefront
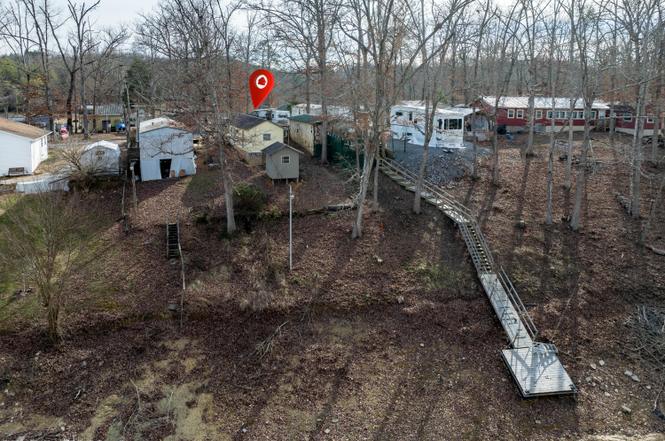
1226 Fishermans Way · Fairgarden, TN
Flood risk 1/10 · Minimal
- FEMA flood zone
- X (unshaded)
- Chance of flooding over 30 yrs
- 0.0%
- Est. flood insurance / yr
- $507 – $1,088
Fire risk 4/10 · Minor
- Est. fire insurance / yr
- $949 – $1,763
Heat risk 5/10 · Moderate
- Hot days now (above 101°F)
- 7 days/yr
- Hot days in 30 yrs
- 20 days/yr
Wind risk 2/10 · Minimal
- Chance of severe wind over 30 yrs
- —
Air-quality risk 2/10 · Minimal
- Unhealthy air days now
- 1 days/yr
- Unhealthy air days in 30 yrs
- 1 days/yr
Risk factors via First Street. Map © Google.
Why this score? — see what drove the C- grade
The composite is a weighted blend of 9 inputs, each scored 0–100. Each bar is that input's sub-score; the figure is the points it added to the 100-point composite (weight × sub-score).
- Cash flow +15.1/30.0
- Appreciation +10.0/10.0
- ARV discount +7.5/15.0
- DSCR +4.6/10.0
- 1% rule +4.2/10.0
- Livability +2.7/5.0
- Condition / age +2.5/5.0
- Schools +2.2/10.0
- Rent growth +1.9/5.0
$140,000
🖨 Deal sheet 📄 Offer letter ✓ Due diligence
Listing remarks
Are you looking for affordable lakefront living on stunning Douglas Lake? Look no further! This home offers you a peaceful place to enjoy the lake on the weekend or live full-time! This quaint 2-bedroom 1-bathroom home is situated nicely with views of the cove. The boat ramp is conveniently located in the community for easy access to the lake. Call today to schedule your private showing. Buyer shall verify all information.
Key facts
- Lakefront living
- Views of the cove
- Boat ramp
Tags
Property features AI
Finance
- HOA & community: Association present with playground
Exterior
- Parking: Off-street designated parking on main level
- Utilities: Septic tank sewer
- Home design: Detached property
- Construction: Metal siding; Frame construction; Built area about 432 (per tax records)
- Exterior features: Lakefront frontage; Storage structure; Rolling slope lot; Lake view
Interior
- Kitchen: Refrigerator
- Flooring: Carpet flooring
- Bathrooms: 1 full bathroom
- Heating & cooling: Electric heating; Window unit cooling; Other heating type
- Interior features: 4 total rooms; Crawl space basement
Neighborhood map
What this means for you Summary
Snapshot
- This is a 2-bed/1.0-bath other listed at $140k.
Deal economics
- At list price, monthly cash flow is $47 ($566/yr) — positive.
- The deal already cash-flows at list — no discount required.
- To meet the 1% rule (rent ≥ 1% of price), the offer needs to be $128k (8.3% below list).
- Recommended offer: $127k (9.0% below list) — sets the bar for market timing.
- Cap rate 6.7% vs local median 1.9% in Fairgarden — top-decile yield for the area; either an underpriced asset or a hidden risk that comps aren't pricing in. Stress-test before assuming the spread holds.
Location & tenants
- Location reads 54/100 on livability (#381 in TN) — a working-class tenant base; expect higher turnover. Strengths: cost of living A+, housing A-; Watch: crime F, amenities F, commute F.
- Jefferson County (rural): math 25% / reading 27% proficiency, ranked #80 of 139 in TN (top 58%) — low school quality limits family demand, transient renter base, plan for 1-2y turnover.
- Market conditions: Rents soft (-2.6%/yr); 1127 active listings in the ZIP; 254 units permitted in Jefferson County in 2024 (0 in 5+ unit buildings).
Forward outlook
- In year one you build about $15k of equity ($968 loan paydown + $14k appreciation (10.0% local appreciation)).
- Jefferson County population projected at +6% by 2050 — modest demand growth; plan on rents tracking national, not racing it.
- At projected returns (10.0% appreciation + 0.0% rent growth), your $39k cash investment doubles in ~3 years — after that, you're playing with house money.
- By year 3, paydown + projected appreciation supports a ~$38k cash-out refi (75% LTV) — recoverable capital for the next deal without selling this one.
Negotiation context
- It's been on market 112 days — a 9% lower offer ($127k) is reasonable based on typical stale-listing flexibility.
- 2 sale attempts since 21y ago; this cycle's ask has dropped $10k (7%) from the opening price — seller is motivated, your offer sets the floor, not the list.
- Current owner paid $28k; list at $140k implies a 400% gain — meaningful room to come down on a strong offer.
Risks & watch-outs
- Climate carrying-cost: extreme-heat days projected 7→20/yr by 2055 (HVAC capex compounding) — expect insurance premiums to compound above CPI over the hold.
Questions for the listing agent
- It's been on market 112 days. Have you received any prior offers? Is the seller open to a 9% concession, seller financing, or rate buy-down credit?
- Built in 1970 — when were the roof, HVAC, electrical panel, plumbing, and water heater last replaced?
- Why hasn't it sold? Are there any deal-killer items the seller is aware of (foundation, flood, title, zoning, code violations)?
- Is there a deadline driving the sale (1031 exchange, divorce, estate, relocation)? That informs how much negotiation room exists.
- Schools are F-rated, which usually means shorter tenancies and higher turnover. Who's the typical renter profile here, and what's been the actual vacancy rate?
- Crime grade is F in this area — have there been break-ins, vandalism, or insurance claims at this property in the last 3 years? What carrier currently insures it and at what premium?
- This sits on a lake — are riparian / water-frontage rights deeded with the parcel? Any dock permits, shoreline easements, or HOA water-use restrictions?
- What's the documented flood / surge / shoreline-erosion history here (FEMA AND non-FEMA — e.g., storm surge, creek backup, septic-field saturation)?
- Any water-quality or seasonal algae-bloom issues that affect tenant satisfaction or short-term-rental demand?
- What's the average days-on-market for RENTAL listings here right now (not sales)? A rising rental-DOM trend means longer vacancies and softer asking-rent achievability than the comps imply.
- What's the recent tenant-quality profile in this submarket — average credit score on applications, eviction rate, late-payment / NSF rate, and stable-employment percentage? A property-management company in the area should have these aggregated.
- How much new for-sale + rental construction is in the pipeline within 1–3 miles? Heavy new supply typically softens prices + rents 12–24 months out; constrained supply supports both.
Investment metrics
- 1% rule
- 0.92% ✗
- Cap rate
- 6.70%
- Cash-on-cash
- 1.45%
- DSCR
- 1.06
- GRM
- 9.1
CMA / ARV
No comps found within radius.
Projected returns pro-forma
10.0% appreciation · 0.0% rent growth · sell at horizon
- IRR
- 24.3%
- Equity multiple
- 2.93×
- Total profit
- $75,510
- Equity at exit
- $126,123
- IRR
- 20.8%
- Equity multiple
- 6.44×
- Total profit
- $213,297
- Equity at exit
- $271,989
Cash invested: $39,200 (down + closing). Projections, not guarantees.
Landlord ↔ Tenant lean methodology
- Overall (STATE)
- 87 Strongly Landlord-Friendly
- State Tennessee
- 87 Strongly Landlord-Friendly · R+13
- County
- — inherits STATE
- City
- — inherits STATE
ZIP-level market 37876
- Home prices YoY
- 2.4%
- Rents YoY
- -2.6%
- Active inventory
- 1127
- Price-to-rent
- 9.1×
Monthly cashflow live
- Estimated rent
- $1,284 medium interval (Pro) →
- Mortgage (P&I)
- −$734
- Tax est. 1.5%
- −$175 /mo · $2,100/yr
- Insurance
- −$58
- HOA
- −$0
- Vacancy / Maint / Mgmt
- −$270
- Net cashflow
- $47
Break-even live
UW: 25.0% down · 7.5% · 30yr · 1.5% tax · 5.0% vac · 8.0% maint · 8.0% mgmt
Financing live
Cash to close
- Down payment
- $35,000
- Closing costs
- $4,200
- Reserves months
- —
- Total cash needed
- —
Loan-product check · same deal, 3 products live
Conventional
25% down · 7.5% · 30yr
- Down + closing
- —
- Monthly P&I
- —
- Monthly cashflow
- —
- DSCR
- —
- Eligible?
- —
Personal DTI + credit; lowest rate.
DSCR
20% down · 8.5% · 30yr
- Down + closing
- —
- Monthly P&I
- —
- Monthly cashflow
- —
- DSCR
- —
- Eligible?
- —
No personal income docs; deal must DSCR.
Hard money
10% down · 12.0% · 12mo
- Down + closing
- —
- Monthly P&I
- —
- Monthly cashflow
- —
- DSCR
- —
- Eligible?
- —
Short-term bridge; refi at stabilization.
Listing history 21 events
-
2026-06-19days on market $140,000 Active 112 DOM
-
2026-06-18days on market $140,000 Active 111 DOM
-
2026-06-17days on market $140,000 Active 110 DOM
-
2026-06-16days on market $140,000 Active 109 DOM
-
2026-06-15days on market $140,000 Active 108 DOM
-
2026-06-14days on market $140,000 Active 106 DOM
-
2026-06-13days on market $140,000 Active 105 DOM
-
2026-06-10days on market $140,000 Active 103 DOM
-
2026-06-09days on market $140,000 Active 102 DOM
-
2026-06-08pricedays on market $140,000 Active 101 DOM
-
2026-06-07days on market $145,000 Active 100 DOM
-
2026-06-05days on market $145,000 Active 97 DOM
-
2026-06-03days on market $145,000 Active 96 DOM
-
2026-06-02days on market $145,000 Active 95 DOM
-
2026-06-01days on market $145,000 Active 94 DOM
-
2026-05-31days on market $145,000 Active 93 DOM
-
2026-05-30days on market $145,000 Active 92 DOM
-
2026-05-15price $145,000
-
2026-02-27$150,000 Active
-
2005-05-11$39,900
-
2000-11-20soldstatus $28,000
ⓘ Source: listings_history table (triggers on properties + properties_extension) + one-shot
backfill from property_details.listing_events for pre-trigger history.
Climate risk First Street
- Flood 1/10 Low FEMA zone X (unshaded) · 0% chance over 30 yrs
- Wildfire 4/10 Moderate
- Heat 5/10 Major 7 d/yr ≥101°F today · 20 d/yr by 30 yrs out
- Wind 2/10 Low
- Air quality 2/10 Low 1 unhealthy d/yr today · 1 by 30 yrs out
Nearby sold comps map
Loading sold comps map…
Walkable amenities ~0.75 mi
Loading nearby amenities…
Taxation est. · year 1
- Rental income
- $15,413
- − Mortgage interest
- −$7,842
- − Property taxes
- −$2,100
- − Insurance
- −$700
- − Repairs & maintenance
- −$1,233
- − Management
- −$1,233
- − Depreciation
- −$4,073
- Taxable loss
- −$1,768
- Est. tax savings @ 24.0%
- +$424
- After-tax cash flow
- $991/yr
For passive investors: Depreciation is non-cash, so a rental often shows a tax loss while cash-flowing — sheltering income. Rental losses are passive: they offset passive income freely, and up to $25,000/yr can offset ordinary (W-2) income if you actively participate and your MAGI is under $100k (phasing out to $0 by $150k); unused losses carry forward. On sale, claimed depreciation is recaptured at up to 25%, and gains may owe capital-gains tax (a 1031 exchange can defer both). Figures are a year-1 estimate at your 24.0% rate — not tax advice; consult a CPA.
Schools (NCES district)
- District
- Jefferson County
- NCES district ID
- 4702100
- Math proficiency
- 25% ▼ -7.00%
- Reading proficiency
- 27% ▼ -4.00%
- Median HH income
- $41,074
- Composite
- 22.03/100
- National rank
- #8204
- State rank
- #80 of 139 in TN
Livability — Fairgarden
- Score
- 54/100
- State rank
- #381
- US rank
- #24205
Category grades
Schools grade is shown separately in the Schools card above.
Census & demographics
- County
- Sevier County · 80,402 people
- Metro
- Sevierville, TN
- Population (ZIP)
- 33,561
- Household income
- $58,277
- Rent vs Own
- Severe rent burden
- 611.0
Population outlook (Jefferson County) Hauer SSP2
- Today (2025)
- 56,862 people
- By 2030
- 58,186 · +2.3%
- By 2040
- 60,025 · +5.6%
- By 2050
- 60,442 · +6.3%
- By 2075
- 59,211 · +4.1%
- By 2100
- 55,326 · -2.7%
Race, ethnicity, and origin ACS 2023
- Neighborhood character
- Predominantly White (89%)
- Race & ethnicity
- White 89% Hispanic / Latino 5% Two or more races 5% Black 1%
- Common ancestry
- Slovak 5% Serbian 4% Romanian 2%
- Foreign-born
- 3% · Canada
- Languages at home
- 95% English-only · Spanish 3% Russian/Polish/Slavic 1%
Political lean MEDSL · Jefferson
- 2024 margin
- Solid R (+64.2) · D 17.4% · R 81.6%
- 2008→2024 swing
- -21.5pp toward R · 2008: -42.7pp · 2024: -64.2pp
- All cycles
- 2024: R+64.2 2020: R+59.3 2016: R+59.3 2012: R+50.1 2008: R+42.7
Not yet ingested
- Civics
- —
Market trends
- HPI YoY
- ▲ 11.06%
- Current HPI
- 477.19
- Rent YoY
- ▼ -2.57%
- Metro
- Sevierville, TN
- State GDP YoY
- ▲ 2.78%
- F500 in state
- 22
Industry mix (Fortune 500 HQ in TN)
| Industry | F500 HQs | Revenue |
|---|---|---|
| Healthcare | 3 | $91B |
|
||
| Retail | 3 | $72B |
|
||
| Transportation / Logistics | 1 | $88B |
|
||
| Paper / Packaging | 1 | $19B |
|
||
| Insurance | 1 | $13B |
|
||
| Energy | 1 | $12B |
|
||
Price history
+417.9% since first listed4 events — show timeline
- 2026-05-15 Price Changed $145,000 Knoxville MLS
- 2026-02-27 Listed $150,000 Knoxville MLS
- 2005-05-11 Listed $39,900 Knoxville MLS
- 2000-11-20 Sold (Public Records) $28,000 Public Records
Property tax history
-0.7%/yrLatest (2025): $215 · +3.9% YoY. Source: county tax records.
Cash-flow waterfall
monthlySold comps — $/sqft
last 12 mo · ≤1 miLoading sold comps…