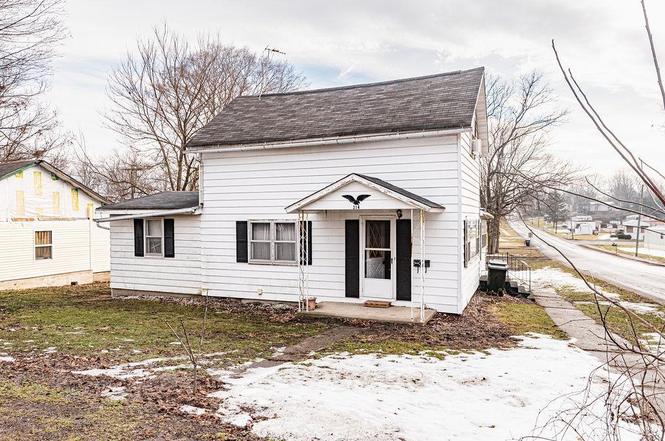
214 S Elm St · Albion, IN
Flood risk 6/10 · Moderate
- FEMA flood zone
- X (unshaded)
- Chance of flooding over 30 yrs
- 0.55%
- Est. flood insurance / yr
- $473 – $860
Fire risk 1/10 · Minimal
- Est. fire insurance / yr
- $717 – $1,331
Heat risk 3/10 · Minor
- Hot days now (above 99°F)
- 7 days/yr
- Hot days in 30 yrs
- 16 days/yr
Wind risk 2/10 · Minimal
- Chance of severe wind over 30 yrs
- —
Air-quality risk 2/10 · Minimal
- Unhealthy air days now
- 1 days/yr
- Unhealthy air days in 30 yrs
- 1 days/yr
Risk factors via First Street. Map © Google.
Why this score? — see what drove the C+ grade
The composite is a weighted blend of 9 inputs, each scored 0–100. Each bar is that input's sub-score; the figure is the points it added to the 100-point composite (weight × sub-score).
- Cash flow +28.8/30.0
- DSCR +10.0/10.0
- ARV discount +7.5/15.0
- 1% rule +7.3/10.0
- Livability +3.4/5.0
- Schools +2.9/10.0
- Rent growth +2.5/5.0
- Condition / age +2.5/5.0
- Appreciation +0.0/10.0
$99,000
🖨 Deal sheet (PDF) 📄 Offer letter ✓ Due diligence
Listing remarks MLS
Open concept two bedroom 1.5 story home on a large corner lot. There is great potential with this property. Property is being Sold As Is.
Key facts
- Spacious landing
- Full block basement
- Corner lot
Tags
Property features AI
Exterior
- Parking: Detached garage; Garage with door opener; Off-street parking; 2 garage spaces
- Security: Smoke detector(s)
- Utilities: Public water; Public sewer; Electric service
- Home design: Single-family residence; Site-built home; One-story
- Construction: Aluminum siding; Block and stone foundation; Built as site-built construction
- Exterior features: Deck; Corner lot
Interior
- Kitchen: Dishwasher; Refrigerator; Electric cooktop; Electric range; Exhaust fan
- Bathrooms: 1 full bathroom (main level)
- Heating & cooling: Natural gas forced-air heating; Central air; Window unit(s)
- Interior features: Eat-in kitchen; Living room fireplace
- Laundry & utility: Washer; Dryer; Laundry on main level; Electric water heater
Neighborhood map
What this means for you Summary
Snapshot
- This is a 3-bed/1.0-bath single-family listed at $99k.
Deal economics
- At list price, monthly cash flow is $333 ($4k/yr) — positive.
- The deal already cash-flows at list — no discount required.
- Meets the 1% rule at list price ($1k rent vs $99k).
Location & tenants
- Location reads 67/100 on livability (#237 in IN) — a middle-class / working-renter tenant base. Strengths: crime A+, cost of living A+, housing A+; Watch: employment D+, amenities F, commute F.
- Central Noble Community School Corporation (rural): math 32% / reading 34% proficiency, ranked #207 of 301 in IN (top 69%) — families likely to look elsewhere, expect single-tenant / working-renter base with shorter leases.
- Zoned schools: Central Noble Primary School (249 students, 47% FRL); Central Noble Junior Senior Hs (math 23% / reading 37%, grade F, #307 of 369 statewide, top 83%, 654 students, 46% FRL) — zoned schools average 46% FRL vs 31% district-wide (16 pts higher); higher-poverty schools than district average — tighter screening recommended.
- Market conditions: 29 active listings in the ZIP; 131 units permitted in Noble County in 2024 (0 in 5+ unit buildings).
Forward outlook
- Local home prices are declining (-3.0%/yr); year-one equity from $684 of loan paydown is wiped out by about $3k of value loss. Plan a longer hold.
- Noble County population projected to shrink 8% by 2050 — rents likely to lag national; underwrite the cash flow, not the appreciation.
- At projected returns (-3.0% appreciation + 3.0% rent growth), your $28k cash investment doubles in ~9 years — after that, you're playing with house money.
Negotiation context
- Only 3 days on market — expect competitive offers; lowballing is unlikely to land.
- 3 sale attempts since 4y ago; this cycle's ask has dropped $30k (23%) from the opening price — seller is motivated, your offer sets the floor, not the list.
Risks & watch-outs
- Watch-outs: built in 1925 — expect roof / HVAC / electrical / plumbing capex.
- Climate carrying-cost: major flood risk — expect insurance premiums to compound above CPI over the hold.
Questions for the listing agent
- Built in 1925 — when were the roof, HVAC, electrical panel, plumbing, and water heater last replaced?
- Is there a deadline driving the sale (1031 exchange, divorce, estate, relocation)? That informs how much negotiation room exists.
- Schools are D-rated, which usually means shorter tenancies and higher turnover. Who's the typical renter profile here, and what's been the actual vacancy rate?
- What's the average days-on-market for RENTAL listings here right now (not sales)? A rising rental-DOM trend means longer vacancies and softer asking-rent achievability than the comps imply.
- What's the recent tenant-quality profile in this submarket — average credit score on applications, eviction rate, late-payment / NSF rate, and stable-employment percentage? A property-management company in the area should have these aggregated.
- How much new for-sale + rental construction is in the pipeline within 1–3 miles? Heavy new supply typically softens prices + rents 12–24 months out; constrained supply supports both.
Investment metrics
- 1% rule
- 1.23% ✓
- Cap rate
- 10.33%
- Cash-on-cash
- 14.43%
- DSCR
- 1.64
- GRM
- 6.8
CMA / ARV
- ARV (on-the-fly)
- $222,420
- Comps found
- 12
Show comp detail 12 sales within ~0.75 mi
| Address | Dist | Beds/Ba | Sqft | Sold | Price | $/sf | Match |
|---|---|---|---|---|---|---|---|
| 208 S Liberty St | 0.07mi | 3/2.0 | 1,472 (-13%) | 4mo | $225,000 | $153 | 68 |
| 307 S Orange St | 0.16mi | 3/2.0 | 1,562 (-7%) | 11mo | $200,000 | $128 | 67 |
| 301 S High St | 0.45mi | 3/1.0 | 1,552 (-8%) | 1mo | $210,000 | $135 | 65 |
| 506 N Liberty Dr | 0.39mi | 4/2.0 (+1) | 1,706 (+1%) | 10mo | $225,000 | $132 | 62 |
| 410 S Oak St | 0.29mi | 4/1.0 (+1) | 1,530 (-9%) | 6mo | $189,900 | $124 | 61 |
| 306 Riverview Dr | 0.51mi | 3/2.0 | 1,604 (-5%) | 10mo | $238,000 | $148 | 56 |
| 115 N Elm St | 0.18mi | 2/1.0 (-1) | 1,488 (-12%) | 18mo | $132,500 | $89 | 52 |
| 211 E Jefferson St | 0.20mi | 3/2.0 | 1,470 (-13%) | 18mo | $172,500 | $117 | 50 |
| 513 N Orange St | 0.47mi | 4/2.0 (+1) | 1,877 (+11%) | 0mo | $237,500 | $127 | 50 |
| 402 Riverview Dr | 0.53mi | 3/2.5 | 1,587 (-6%) | 12mo | $255,000 | $161 | 50 |
| 701 E South St | 0.26mi | 4/2.0 (+1) | 1,932 (+15%) | 17mo | $251,000 | $130 | 40 |
| 712 Taylor Ln | 0.71mi | 3/2.0 | 1,481 (-12%) | 4mo | $235,000 | $159 | 39 |
Match score weights: distance 35% · size 25% · config 20% · recency 20%. Top-matched comps best support the ARV.
Projected returns pro-forma
-3.0% appreciation · 3.0% rent growth · sell at horizon
- IRR
- 4.8%
- Equity multiple
- 1.19×
- Total profit
- $5,169
- Equity at exit
- $14,761
- IRR
- 14.3%
- Equity multiple
- 2.15×
- Total profit
- $31,768
- Equity at exit
- $8,560
Cash invested: $27,720 (down + closing). Projections, not guarantees.
Landlord ↔ Tenant lean methodology
- Overall (STATE)
- 90 Strongly Landlord-Friendly
- State Indiana
- 90 Strongly Landlord-Friendly · R+11
- County
- — inherits STATE
- City
- — inherits STATE
ZIP-level market 46701
- Home prices YoY
- -16.8%
- Active inventory
- 29
- Price-to-rent
- 6.8×
Monthly cashflow live
- Estimated rent
- $1,216 medium interval (Pro) →
- Mortgage (P&I)
- −$519
- Tax from tax record
- −$67 /mo · $799/yr
- Insurance
- −$41
- HOA
- −$0
- Vacancy / Maint / Mgmt
- −$255
- Net cashflow
- $333
Break-even live
Sensitivity live
| Price | -10% $389 | -5% $361 | +0% $333 | +5% $305 | +10% $277 |
|---|---|---|---|---|---|
| Rent | -10% $237 | -5% $285 | +0% $333 | +5% $381 | +10% $429 |
| Rate | -1.0pp $383 | -0.5pp $358 | base $333 | +0.5pp $308 | +1.0pp $282 |
UW: 25.0% down · 7.5% · 30yr · 1.5% tax · 5.0% vac · 8.0% maint · 8.0% mgmt
Financing live
Cash to close
- Down payment
- $24,750
- Closing costs
- $2,970
- Reserves months
- —
- Total cash needed
- —
Loan-product check · same deal, 3 products live
Conventional
25% down · 7.5% · 30yr
- Down + closing
- —
- Monthly P&I
- —
- Monthly cashflow
- —
- DSCR
- —
- Eligible?
- —
Personal DTI + credit; lowest rate.
DSCR
20% down · 8.5% · 30yr
- Down + closing
- —
- Monthly P&I
- —
- Monthly cashflow
- —
- DSCR
- —
- Eligible?
- —
No personal income docs; deal must DSCR.
Hard money
10% down · 12.0% · 12mo
- Down + closing
- —
- Monthly P&I
- —
- Monthly cashflow
- —
- DSCR
- —
- Eligible?
- —
Short-term bridge; refi at stabilization.
Listing history 3 events
-
2026-06-21days on market $99,000 Active 3 DOM
-
2026-06-17remarks 693-char remark
-
2026-06-17$99,000 Active 1 DOM
ⓘ Source: listings_history table (triggers on properties + properties_extension) + one-shot
backfill from property_details.listing_events for pre-trigger history.
Tax reassessment forecast IN · Partial reset (capped growth)
- Current annual tax
- $799 · $67/mo
- Projected year-2 tax
- $820 · $68/mo
- Expected delta
- +$21/yr (+$2/mo · 2.7%)
ⓘ Screening estimate from a state-policy table — verify with the county assessor before closing.
Climate risk First Street
- Flood 6/10 Major FEMA zone X (unshaded) · 55% chance over 30 yrs
- Wildfire 1/10 Low
- Heat 3/10 Moderate 7 d/yr ≥99°F today · 16 d/yr by 30 yrs out
- Wind 2/10 Low
- Air quality 2/10 Low 1 unhealthy d/yr today · 1 by 30 yrs out
Nearby sold comps map
Loading sold comps map…
Walkable amenities ~0.75 mi
Loading nearby amenities…
Taxation est. · year 1
- Rental income
- $14,586
- − Mortgage interest
- −$5,546
- − Property taxes
- −$799
- − Insurance
- −$495
- − Repairs & maintenance
- −$1,167
- − Management
- −$1,167
- − Depreciation
- −$2,880
- Taxable income
- $2,533
- Est. tax owed @ 24.0%
- −$608
- After-tax cash flow
- $3,392/yr
For passive investors: Depreciation is non-cash, so a rental often shows a tax loss while cash-flowing — sheltering income. Rental losses are passive: they offset passive income freely, and up to $25,000/yr can offset ordinary (W-2) income if you actively participate and your MAGI is under $100k (phasing out to $0 by $150k); unused losses carry forward. On sale, claimed depreciation is recaptured at up to 25%, and gains may owe capital-gains tax (a 1031 exchange can defer both). Figures are a year-1 estimate at your 24.0% rate — not tax advice; consult a CPA.
Schools (NCES district)
- District
- Central Noble Community School Corporation
- NCES district ID
- 1801710
- Math proficiency
- 32% ▼ -1.00%
- Reading proficiency
- 34% ▼ -7.00%
- Median HH income
- $48,911
- Composite
- 28.58/100
- National rank
- #6718
- State rank
- #207 of 301 in IN
Livability — Albion
- Score
- 67/100
- State rank
- #237
- US rank
- #10276
Category grades
Schools grade is shown separately in the Schools card above.
Census & demographics
- Census place
- Albion, IN
- Population (ZIP)
- 8,186
Population outlook (Noble County) Hauer SSP2
- Today (2025)
- 48,321 people
- By 2030
- 47,945 · -0.8%
- By 2040
- 46,521 · -3.7%
- By 2050
- 44,501 · -7.9%
- By 2075
- 38,962 · -19.4%
- By 2100
- 31,846 · -34.1%
Race, ethnicity, and origin ACS 2023
- Neighborhood character
- Predominantly White (95%)
- Race & ethnicity
- White 95% Two or more races 3% Hispanic / Latino 2%
- Common ancestry
- Italian 13% Romanian 3% Lithuanian 3%
- Foreign-born
- 1% · Canada
- Languages at home
- 98% English-only · Spanish 1% French/Haitian/Cajun 1% German/W. Germanic 1%
Political lean MEDSL · Noble
- 2024 margin
- Solid R (+51.4) · D 23.5% · R 74.9% · Other 1.5%
- 2008→2024 swing
- -36.0pp toward R · 2008: -15.4pp · 2024: -51.4pp
- All cycles
- 2024: R+51.4 2020: R+49.7 2016: R+49.1 2012: R+33.6 2008: R+15.4
Not yet ingested
- Civics
- —
Market trends
- HPI YoY
- ▼ -50.57%
- Current HPI
- 250.7517
- Rent YoY
- —
- Metro
- —
- State GDP YoY
- ▲ 2.90%
- F500 in state
- 18
Industry mix (Fortune 500 HQ in IN)
| Industry | F500 HQs | Revenue |
|---|---|---|
| Industrial Machinery | 2 | $37B |
|
||
| Healthcare | 1 | $177B |
|
||
| Pharmaceuticals | 1 | $45B |
|
||
| Metals / Steel | 1 | $18B |
|
||
| Agriculture | 1 | $17B |
|
||
| Packaging | 1 | $12B |
|
||
Price history
-16.8% since first listed9 events — show timeline
- 2026-06-17 Price Changed $99,000 IRMLS
- 2026-06-17 Listed $129,000 IRMLS
- 2026-03-16 Price Changed $129,000 IRMLS
- 2026-03-09 Price Changed $129,900 IRMLS
- 2026-03-02 Price Changed $135,500 IRMLS
- 2026-02-17 Listed $136,000 IRMLS
- 2022-07-26 Sold (MLS) $115,000 IRMLS
- 2022-06-22 Pending — IRMLS
- 2022-06-18 Listed $119,000 IRMLS
Property tax history
+14.3%/yrLatest (2024): $799 · +11.8% YoY. Source: county tax records.
Cash-flow waterfall
monthlySold comps — $/sqft
last 12 mo · ≤1 miLoading sold comps…