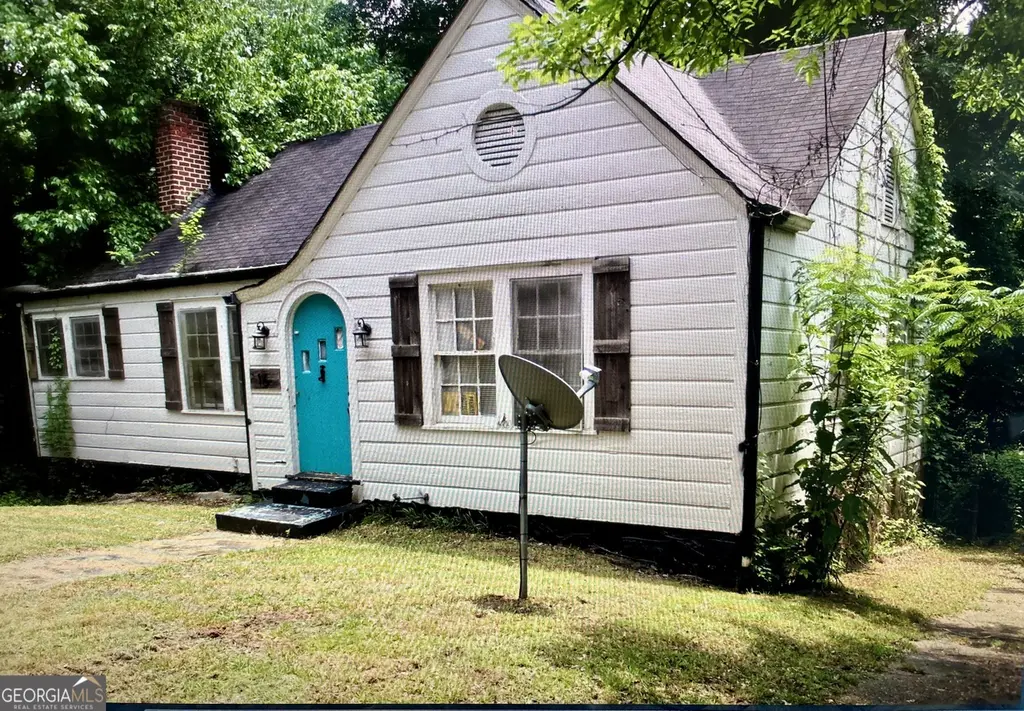
16 Grove Park Pl · Atlanta, GA
Flood risk 1/10 · Minimal
- FEMA flood zone
- X (unshaded)
- Chance of flooding over 30 yrs
- 0.0%
- Est. flood insurance / yr
- $473 – $860
Fire risk 3/10 · Minor
- Est. fire insurance / yr
- $963 – $1,789
Heat risk 5/10 · Moderate
- Hot days now (above 104°F)
- 7 days/yr
- Hot days in 30 yrs
- 16 days/yr
Wind risk 5/10 · Moderate
- Chance of severe wind over 30 yrs
- 25.0%
Air-quality risk 4/10 · Minor
- Unhealthy air days now
- 5 days/yr
- Unhealthy air days in 30 yrs
- 7 days/yr
Risk factors via First Street. Map © Google.
Why this score? — see what drove the C- grade
The composite is a weighted blend of 9 inputs, each scored 0–100. Each bar is that input's sub-score; the figure is the points it added to the 100-point composite (weight × sub-score).
- Cash flow +20.6/30.0
- ARV discount +8.9/15.0
- DSCR +6.5/10.0
- 1% rule +5.8/10.0
- Livability +4.2/5.0
- Rent growth +3.3/5.0
- Schools +2.7/10.0
- Condition / age +2.5/5.0
- Appreciation +0.0/10.0
$149,000
🖨 Deal sheet (PDF) 📄 Offer letter ✓ Due diligence
Listing remarks MLS
Calling all investors, renovators, and buyers with vision! 16 Grove Park Place is a true fixer-upper being sold strictly AS-IS, but the opportunity is real. This property needs a full renovation, giving the next owner a clean canvas to bring it back to life. Located in Atlanta's growing Grove Park community, this hidden jewel sits near Westside Park/Shirley Clarke Franklin Park, Proctor Creek Greenway, Bankhead MARTA access, the Atlanta BeltLine Westside connections, downtown Atlanta, Mercedes-Benz Stadium, and major Westside redevelopment. Whether you're looking for your next project, rental, flip, or long-term hold, this one has potential written all over it. Seller is motivated. Bring your contractor, bring your vision, and make this Grove Park opportunity shine again!
Key facts
- Grove park community
- Westside park
- 7,405 sq ft lot
Tags
Property features AI
Finance
- Other: Property contains finished and unfinished areas (above grade and below grade finished areas reported)
- Financial info: No financial details provided
- HOA & community: Community features include park, street lights, near Beltline, near trails/greenway, near schools, near public transport
Exterior
- Parking: Driveway with space for 3 vehicles; Open parking available
- Security: No security features listed
- Utilities: Public water; Public sewer; 220-volt electric service; Electricity, natural gas, phone, sewer and water available
- Home design: One and one-half story; Basement level present; Fixer condition
- Construction: Vinyl siding; Shingle roof; Block and slab foundation; Other structures present
- Exterior features: Back yard fencing; Other exterior features; Asphalt road frontage on a city street; Community amenities nearby: park, street lights, near Beltline, near trails/greenway, near schools, near public transport
Interior
- Kitchen: No kitchen features listed
- Bedrooms: 2 main-level bedrooms; No special bedroom features listed
- Flooring: Hardwood flooring
- Bathrooms: 1 full bathroom (main level)
- Heating & cooling: No heating or cooling details listed
- Interior features: One fireplace; Interior entry basement (unfinished); Common walls: no one above or below; Other interior features
- Laundry & utility: No laundry or utility appliances listed
Neighborhood map
What this means for you Summary
Snapshot
- This is a 2-bed/1.0-bath single-family listed at $149k.
Deal economics
- At list price, monthly cash flow is $199 ($2k/yr) — positive.
- The deal already cash-flows at list — no discount required.
- Meets the 1% rule at list price ($2k rent vs $149k).
- Cap rate 7.9% vs local median 3.1% in Atlanta — top-decile yield for the area; either an underpriced asset or a hidden risk that comps aren't pricing in. Stress-test before assuming the spread holds.
Location & tenants
- Location reads 83/100 on livability (#6 in GA, #919 nationally) — a professional / high-income tenant draw. Strengths: amenities A+, commute A+, housing A+; Watch: cost of living C-.
- Atlanta Public Schools (urban): math 28% / reading 35% proficiency, ranked #80 of 174 in GA (top 46%) — families likely to look elsewhere, expect single-tenant / working-renter base with shorter leases; 71% free/reduced lunch — lower-income household profile, screen leases tightly.
- Zoned schools: Woodson Park Academy School (math 2% / reading 2%, grade F, #1,204 of 1,228 statewide, top 100%, 863 students, 100% FRL); Frederick Douglass High School (math 24%, 1,112 students, 100% FRL) — zoned schools average 100% FRL vs 71% district-wide (29 pts higher); higher-poverty schools than district average — tighter screening recommended.
- Zoned-school proficiency averages 2% at this address vs 32% district-wide (-29 pts) — the specific schools serving this property underperform the Atlanta Public Schools average; the district grade overstates school quality for this exact location.
- Market conditions: Rents rising (+3.3%/yr); 732 active listings in the ZIP; 40 comparable units currently listed for rent nearby; rentals at typical pace (median 25d on market — plan ~3-4 weeks tenant-placement turnaround); solid renter incomes; 11,565 units permitted in Fulton County in 2024 (8,159 in 5+ unit buildings).
Forward outlook
- Local home prices are declining (-3.0%/yr); year-one equity from $1k of loan paydown is wiped out by about $4k of value loss. Plan a longer hold.
- Fulton County population projected at +38% by 2050 — long-run rental-demand tailwind backs the buy-and-hold thesis.
Negotiation context
- Only 7 days on market — expect competitive offers; lowballing is unlikely to land.
- 5 sale attempts with the ask held roughly flat each time — persistent listings suggest the price (not the market) is what's stuck; bring a comps-based counter.
Risks & watch-outs
- Watch-outs: built in 1950 — expect roof / HVAC / electrical / plumbing capex.
- Climate carrying-cost: moderate wind risk, 25% chance of damaging wind over 30y; extreme-heat days projected 7→16/yr by 2055 (HVAC capex compounding) — expect insurance premiums to compound above CPI over the hold.
Questions for the listing agent
- Built in 1950 — when were the roof, HVAC, electrical panel, plumbing, and water heater last replaced?
- Is there a deadline driving the sale (1031 exchange, divorce, estate, relocation)? That informs how much negotiation room exists.
- What's the average days-on-market for RENTAL listings here right now (not sales)? A rising rental-DOM trend means longer vacancies and softer asking-rent achievability than the comps imply.
- What's the recent tenant-quality profile in this submarket — average credit score on applications, eviction rate, late-payment / NSF rate, and stable-employment percentage? A property-management company in the area should have these aggregated.
- How much new for-sale + rental construction is in the pipeline within 1–3 miles? Heavy new supply typically softens prices + rents 12–24 months out; constrained supply supports both.
Investment metrics
- 1% rule
- 1.08% ✓
- Cap rate
- 7.89%
- Cash-on-cash
- 5.71%
- DSCR
- 1.25
- GRM
- 7.7
CMA / ARV
- ARV (on-the-fly)
- $153,872
- Comps found
- 7
Show comp detail 7 sales within ~0.75 mi
| Address | Dist | Beds/Ba | Sqft | Sold | Price | $/sf | Match |
|---|---|---|---|---|---|---|---|
| 817 N Evelyn NW | 0.44mi | 3/1.0 (+1) | 840 (-11%) | 11mo | $230,000 | $274 | 47 |
| 1650 North Ave NW | 0.63mi | 2/1.0 | 1,076 (+14%) | 1mo | $125,000 | $116 | 46 |
| 856 Margaret Pl NW | 0.70mi | 3/2.0 (+1) | 888 (-6%) | 3mo | $145,000 | $163 | 46 |
| 395 W Lake Ave NW | 0.73mi | 2/2.0 | 1,000 (+6%) | 12mo | $298,900 | $299 | 42 |
| 1000 Margaret Pl | 0.68mi | 3/2.0 (+1) | 1,008 (+7%) | 14mo | $282,500 | $280 | 36 |
| 502 S Evelyn Pl NW | 0.69mi | 2/1.0 | 808 (-14%) | 11mo | $115,500 | $143 | 35 |
| 1314 North Ave | 0.74mi | 3/2.0 (+1) | 1,041 (+10%) | 14mo | $109,000 | $105 | 28 |
Match score weights: distance 35% · size 25% · config 20% · recency 20%. Top-matched comps best support the ARV.
Projected returns pro-forma
-3.0% appreciation · 3.26% rent growth · sell at horizon
- IRR
- -7.1%
- Equity multiple
- 0.74×
- Total profit
- $-11,014
- Equity at exit
- $22,216
- IRR
- 2.8%
- Equity multiple
- 1.21×
- Total profit
- $8,667
- Equity at exit
- $12,883
Cash invested: $41,720 (down + closing). Projections, not guarantees.
Landlord ↔ Tenant lean methodology
- Overall (STATE)
- 90 Strongly Landlord-Friendly
- State Georgia
- 90 Strongly Landlord-Friendly · R+3
- County
- — inherits STATE
- City
- — inherits STATE
ZIP-level market 30318
- Rents YoY
- 3.3%
- Active inventory
- 732
- Price-to-rent
- 7.7×
Monthly cashflow live
- Estimated rent
- $1,615 high interval (Pro) →
- Mortgage (P&I)
- −$781
- Tax from tax record
- −$234 /mo · $2,805/yr
- Insurance
- −$62
- HOA
- −$0
- Vacancy / Maint / Mgmt
- −$339
- Net cashflow
- $199
Break-even live
Sensitivity live
| Price | -10% $283 | -5% $241 | +0% $199 | +5% $156 | +10% $114 |
|---|---|---|---|---|---|
| Rent | -10% $71 | -5% $135 | +0% $199 | +5% $262 | +10% $326 |
| Rate | -1.0pp $274 | -0.5pp $237 | base $199 | +0.5pp $160 | +1.0pp $121 |
UW: 25.0% down · 7.5% · 30yr · 1.5% tax · 5.0% vac · 8.0% maint · 8.0% mgmt
Financing live
Cash to close
- Down payment
- $37,250
- Closing costs
- $4,470
- Reserves months
- —
- Total cash needed
- —
Loan-product check · same deal, 3 products live
Conventional
25% down · 7.5% · 30yr
- Down + closing
- —
- Monthly P&I
- —
- Monthly cashflow
- —
- DSCR
- —
- Eligible?
- —
Personal DTI + credit; lowest rate.
DSCR
20% down · 8.5% · 30yr
- Down + closing
- —
- Monthly P&I
- —
- Monthly cashflow
- —
- DSCR
- —
- Eligible?
- —
No personal income docs; deal must DSCR.
Hard money
10% down · 12.0% · 12mo
- Down + closing
- —
- Monthly P&I
- —
- Monthly cashflow
- —
- DSCR
- —
- Eligible?
- —
Short-term bridge; refi at stabilization.
Rent comps 40 comps
| Address | Beds | Baths | Sqft | Rent | $/sqft | DOM | Units | Dist |
|---|---|---|---|---|---|---|---|---|
| 557 W Lake Ave NW Atlanta, GA | 1.0–3.0 | 1.0–2.0 | 1190 | $1,344 | $1.13 | 5d | 9 | 0.48mi |
| 788 W Marietta St NW Atlanta, GA | 1.0 | 1.0 | 685 | $1,800 | $2.63 | 25d | 2 | 0.68mi |
| 427 Holly St NW Atlanta, GA | 2.0 | 2.0 | 900 | $2,100 | $2.33 | 25d | 1 | 0.71mi |
| 1595 Carlisle St NW Unit 1 Atlanta, GA | 2.0 | 1.0 | 900 | $1,200 | $1.33 | 25d | 1 | 0.75mi |
| 399 Holly St NW Unit 6 Atlanta, GA | 2.0 | 1.0 | 775 | $1,500 | $1.94 | 19d | 1 | 0.76mi |
| 371 Lanier St NW #1 Atlanta, GA | 2.0 | 1.0 | 700 | $1,250 | $1.79 | 8d | 1 | 0.81mi |
| 1958 Maywood Pl NW Atlanta, GA | 2.0 | 1.0 | 829 | $1,425 | $1.72 | 6d | 1 | 0.88mi |
| 1894 North Ave NW Atlanta, GA | 2.0 | 1.5 | 1098 | $1,995 | $1.82 | 25d | 1 | 0.89mi |
| 511 Emily Pl NW Atlanta, GA | 3.0 | 1.0 | 1101 | $1,745 | $1.58 | 25d | 1 | 0.93mi |
| 280 Holly Rd NW Unit B Atlanta, GA | 2.0 | 2.0 | 1100 | $1,650 | $1.50 | 25d | 1 | 0.96mi |
| 518 Pelton Pl NW Atlanta, GA | 1.0 | 1.0 | 1036 | $750 | $0.72 | 25d | 1 | 1.02mi |
| 340 Dixie Hills Cir NW Unit C1 Atlanta, GA | 2.0 | 1.0 | 775 | $1,099 | $1.42 | 25d | 1 | 1.09mi |
| 340 Dixie Hills Cir NW Unit A1 Atlanta, GA | 1.0 | 1.0 | 695 | $899 | $1.29 | 25d | 1 | 1.09mi |
| 215 W Lake Dr NW Atlanta, GA | 1.0 | 1.0 | 650 | $1,075 | $1.65 | 8d | 1 | 1.12mi |
| 1916 Joseph E. Boone Blvd NW Unit B Atlanta, GA | 2.0 | 1.0 | 1000 | $1,195 | $1.20 | 25d | 1 | 1.13mi |
| 1916 Joseph E. Boone Blvd NW Unit A Atlanta, GA | 3.0 | 1.0 | 1100 | $1,550 | $1.41 | 21d | 1 | 1.13mi |
| 1441 Andrews St NW Unit 2 Atlanta, GA | 1.0 | 1.0 | 950 | $795 | $0.84 | 8d | 1 | 1.15mi |
| 1110 Cato St NW Atlanta, GA | 3.0 | 1.0 | 1050 | $1,400 | $1.33 | 25d | 1 | 1.19mi |
| 2059 Detroit Ave NW Atlanta, GA | 2.0 | 1.0 | 750 | $1,340 | $1.79 | 23d | 1 | 1.19mi |
| 900 Joseph E Lowery Blvd NW Atlanta, GA | 2.0 | 1.0–2.0 | 911 | $2,276 | $2.50 | 2d | 21 | 1.20mi |
| 1040 Huff Rd NW Atlanta, GA | 2.0 | 1.0–2.0 | 904 | $1,950 | $2.16 | 2d | 16 | 1.21mi |
| 590 Joseph E Lowery Blvd NW Atlanta, GA | 2.0 | 1.0 | 980 | $1,100 | $1.12 | 25d | 1 | 1.24mi |
| 564 Joseph E. Lowery Blvd NW Unit 3 Atlanta, GA | 2.0 | 1.0 | 980 | $1,100 | $1.12 | 25d | 1 | 1.25mi |
| 564 Joseph E Lowery Blvd NW Atlanta, GA | 2.0 | 1.0 | 980 | $1,100 | $1.12 | 25d | 1 | 1.25mi |
| 820 W Marietta St NW Atlanta, GA | 1.0–2.0 | 1.0–2.0 | 900 | $2,460 | $2.73 | 2d | 27 | 1.27mi |
| 245 Stafford St NW Unit A Atlanta, GA | 2.0 | 1.0 | 784 | $1,300 | $1.66 | 25d | 1 | 1.30mi |
| 1294 Longreen Ter NW #2 Atlanta, GA | 2.0 | 2.0 | 950 | $2,500 | $2.63 | 17d | 1 | 1.30mi |
| 882 Fox St NW Atlanta, GA | 2.0 | 1.0 | 980 | $1,350 | $1.38 | 25d | 1 | 1.30mi |
| 1330 Fairmont Ave NW Atlanta, GA | 2.0 | 1.0–2.0 | 904 | $2,403 | $2.66 | 2d | 34 | 1.31mi |
| 1293 Longreen Ter NW #4 Atlanta, GA | 2.0 | 2.0 | 1025 | $2,700 | $2.63 | 21d | 1 | 1.31mi |
| 865 Fox St NW Atlanta, GA | 2.0 | 1.0 | 980 | $1,200 | $1.22 | 25d | 1 | 1.32mi |
| 1200 Foster St NW Atlanta, GA | 1.0 | 1.0 | 915 | $1,995 | $2.18 | 25d | 1 | 1.34mi |
| 929 N Grand Ave NW Atlanta, GA | 3.0 | 2.0 | 1100 | $2,500 | $2.27 | 25d | 1 | 1.40mi |
| 605 Paines Ave NW Unit B3 Atlanta, GA | 2.0 | 1.0 | 670 | $1,099 | $1.64 | 21d | 1 | 1.43mi |
| 39 Holly Rd NW Atlanta, GA | 1.0 | 1.0 | 1120 | $775 | $0.69 | 25d | 1 | 1.44mi |
| 39 Holly Rd NW Atlanta, GA | 1.0 | 1.0 | 1120 | $970 | $0.87 | 8d | 1 | 1.44mi |
| 903 Huff Rd NW Atlanta, GA | 1.0–2.0 | 1.0–2.0 | 955 | $2,548 | $2.67 | 2d | 15 | 1.45mi |
| 555 Paines Ave NW Unit 3 Atlanta, GA | 1.0 | 1.0 | 1000 | $1,400 | $1.40 | 25d | 1 | 1.45mi |
| 555 Paines Ave NW Atlanta, GA | 1.0 | 1.0 | 1000 | $1,150 | $1.15 | 8d | 1 | 1.45mi |
| 800 W Marietta St NW Atlanta, GA | 2.0–4.0 | 2.0–4.0 | 1180 | $789 | $0.67 | 15d | 21 | 1.46mi |
Listing history 6 events
-
2026-06-21days on market $149,000 Active 7 DOM
-
2026-06-18days on market $149,000 Active 4 DOM
-
2026-06-17days on market $149,000 Active 3 DOM
-
2026-06-16days on market $149,000 Active 2 DOM
-
2026-06-15remarks 687-char remark
-
2026-06-15$149,000 Active 1 DOM
ⓘ Source: listings_history table (triggers on properties + properties_extension) + one-shot
backfill from property_details.listing_events for pre-trigger history.
Tax reassessment forecast GA · Resets to sale price
- Current annual tax
- $2,805 · $234/mo
- Projected year-2 tax
- $2,805 · $234/mo
- Expected delta
- $0/yr ($0/mo · 0.0%)
ⓘ Screening estimate from a state-policy table — verify with the county assessor before closing.
Climate risk First Street
- Flood 1/10 Low FEMA zone X (unshaded) · 0% chance over 30 yrs
- Wildfire 3/10 Moderate
- Heat 5/10 Major 7 d/yr ≥104°F today · 16 d/yr by 30 yrs out
- Wind 5/10 Major 25% chance of damaging wind over 30 yrs
- Air quality 4/10 Moderate 5 unhealthy d/yr today · 7 by 30 yrs out
Nearby sold comps map
Loading sold comps map…
Walkable amenities ~0.75 mi
Loading nearby amenities…
Taxation est. · year 1
- Rental income
- $19,380
- − Mortgage interest
- −$8,346
- − Property taxes
- −$2,805
- − Insurance
- −$745
- − Repairs & maintenance
- −$1,550
- − Management
- −$1,550
- − Depreciation
- −$4,335
- Taxable income
- $49
- Est. tax owed @ 24.0%
- −$12
- After-tax cash flow
- $2,372/yr
For passive investors: Depreciation is non-cash, so a rental often shows a tax loss while cash-flowing — sheltering income. Rental losses are passive: they offset passive income freely, and up to $25,000/yr can offset ordinary (W-2) income if you actively participate and your MAGI is under $100k (phasing out to $0 by $150k); unused losses carry forward. On sale, claimed depreciation is recaptured at up to 25%, and gains may owe capital-gains tax (a 1031 exchange can defer both). Figures are a year-1 estimate at your 24.0% rate — not tax advice; consult a CPA.
Schools (NCES district)
- District
- Atlanta Public Schools
- NCES district ID
- 1300120
- Math proficiency
- 28% ▼ -6.00%
- Reading proficiency
- 35% ▼ -2.00%
- Median HH income
- $48,306
- Composite
- 27.27/100
- National rank
- #7006
- State rank
- #80 of 174 in GA
Livability — Atlanta
- Score
- 83/100
- State rank
- #6
- US rank
- #919
Category grades
Schools grade is shown separately in the Schools card above.
Census & demographics
- Census place
- Atlanta, GA
- County
- Fulton County · 1,094,430 people
- City population
- 629,525
- Metro
- Atlanta-Sandy Springs-Alpharetta, GA
- Population (ZIP)
- 59,609
- Household income
- $83,116
- Rent vs Own
- Severe rent burden
- 4182.0
Population outlook (Fulton County) Hauer SSP2
- Today (2025)
- 1,203,707 people
- By 2030
- 1,299,706 · +8.0%
- By 2040
- 1,488,256 · +23.6%
- By 2050
- 1,664,580 · +38.3%
- By 2075
- 2,036,072 · +69.2%
- By 2100
- 2,222,402 · +84.6%
Race, ethnicity, and origin ACS 2023
- Neighborhood character
- Diverse neighborhood (Simpson 0.63)
- Race & ethnicity
- Black 49% White 35% Hispanic / Latino 7% Two or more races 6% Asian 5%
- Hispanic origin (detail)
- Mexican 2% Puerto Rican 1%
- Common ancestry
- Lithuanian 2% Slovak 2% Romanian 1%
- Foreign-born
- 8% · Canada, China, South Korea
- Languages at home
- 88% English-only · Spanish 4% Other Indo-European 2% Other Asian/Pacific 1%
Political lean MEDSL · Fulton
- 2024 margin
- Solid D (+44.9) · D 71.9% · R 27.0% · Other 1.1%
- 2008→2024 swing
- +9.8pp toward D · 2008: 35.0pp · 2024: 44.9pp
- All cycles
- 2024: D+44.9 2020: D+46.4 2016: D+42.1 2012: D+29.6 2008: D+35.0
Not yet ingested
- Civics
- —
Market trends
- HPI YoY
- ▼ -470.82%
- Current HPI
- 224.1493
- Rent YoY
- ▲ 3.26%
- Metro
- Atlanta-Sandy Springs-Alpharetta, GA
- State GDP YoY
- ▲ 2.66%
- F500 in state
- 28
Industry mix (Fortune 500 HQ in GA)
| Industry | F500 HQs | Revenue |
|---|---|---|
| Paper / Packaging | 2 | $29B |
|
||
| Retail | 1 | $160B |
|
||
| Transportation / Logistics | 1 | $91B |
|
||
| Airlines | 1 | $62B |
|
||
| Consumer Goods | 1 | $47B |
|
||
| Utilities | 1 | $25B |
|
||
Price history
-33.8% since first listed13 events — show timeline
- 2026-06-11 Listed $149,000 GAMLS
- 2026-06-11 Listed $149,000 FMLS
- 2025-12-31 Listing Removed — GAMLS
- 2025-10-23 Price Changed $145,000 GAMLS
- 2025-08-18 Listed $150,000 GAMLS
- 2025-06-30 Listing Removed — FMLS
- 2025-06-30 Listing Removed — GAMLS
- 2025-05-19 Price Changed $199,999 GAMLS
- 2025-05-19 Price Changed $199,999 FMLS
- 2025-05-02 Price Changed $200,000 GAMLS
- 2025-05-02 Price Changed $200,000 FMLS
- 2025-04-02 Listed $225,000 FMLS
- 2025-04-02 Listed $225,000 GAMLS
Property tax history
+33.8%/yrLatest (2025): $2,805 · -0.3% YoY. Source: county tax records.
Cash-flow waterfall
monthlySold comps — $/sqft
last 12 mo · ≤1 miLoading sold comps…