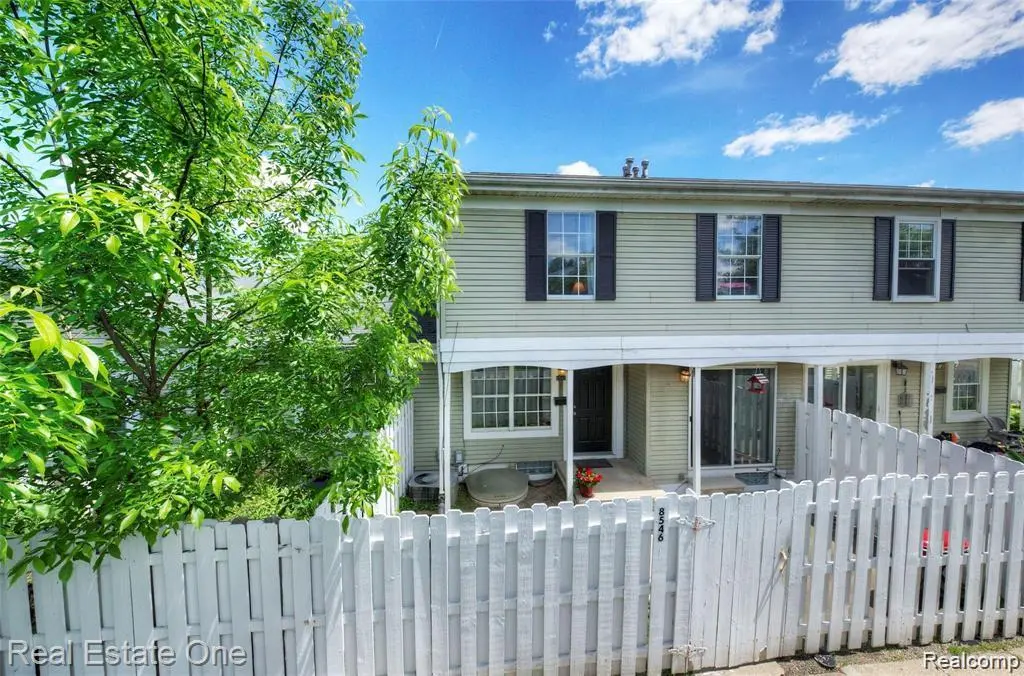
8542 Spinnaker Way · Ypsilanti, MI
Flood risk 1/10 · Minimal
- FEMA flood zone
- X (unshaded)
- Chance of flooding over 30 yrs
- 0.0%
- Est. flood insurance / yr
- $507 – $1,088
Fire risk 1/10 · Minimal
- Est. fire insurance / yr
- $784 – $1,456
Heat risk 3/10 · Minor
- Hot days now (above 97°F)
- 7 days/yr
- Hot days in 30 yrs
- 15 days/yr
Wind risk 2/10 · Minimal
- Chance of severe wind over 30 yrs
- —
Air-quality risk 2/10 · Minimal
- Unhealthy air days now
- 1 days/yr
- Unhealthy air days in 30 yrs
- 2 days/yr
Risk factors via First Street. Map © Google.
Why this score? — see what drove the C- grade
The composite is a weighted blend of 9 inputs, each scored 0–100. Each bar is that input's sub-score; the figure is the points it added to the 100-point composite (weight × sub-score).
- Cash flow +18.9/30.0
- ARV discount +7.5/15.0
- DSCR +6.0/10.0
- 1% rule +5.8/10.0
- Livability +4.0/5.0
- Rent growth +3.3/5.0
- Condition / age +2.5/5.0
- Schools +2.4/10.0
- Appreciation +0.0/10.0
$179,000
🖨 Deal sheet 📄 Offer letter ✓ Due diligence
Listing remarks
WELCOME TO THIS BEAUTIFUL TOWNHOUSE LOCATED IN THE DESIRABLE PORTS OF SCHOONER COVE. 3 SPACIOUS BEDROOMS 1.5 BATHROOMS WITH AN OPEN FLOOR PLAN. REMODELED WITH NEW KITCHEN, FLOORS, FRESH PAINT, AND BATHROOMS. VERY CLOSE TO FORD LAKE, FORD LAKE PARK, SHOPPING, ENTERTAINMENT, AND MORE! DONT MISS THIS OPPORTUNITY!!
Key facts
- Open floor plan
- Remodeled
- Close to ford lake
Tags
Property features AI
Finance
- Other: Pet restrictions — call for details
- Financial info: Property has a current lease
- HOA & community: Monthly association fee of $205; Association fee applies
Exterior
- Parking:
- Security:
- Utilities: Public water; Natural gas; Forced air heating
- Home design: Condominium; 2-story structure; Built in 1975; Basement present
- Construction: Vinyl siding exterior; Basement foundation
- Exterior features: Vinyl siding; Paved street access
Interior
- Kitchen: Kitchen on entry level (approx. 10 x 10); Kitchen floor with other (non-specified) covering
- Bedrooms: Three bedrooms located on the second floor (approx. 10 x 10, 10 x 10, and 10 wide); Carpet in one bedroom, other bedrooms with other flooring
- Flooring: Carpet in at least one bedroom; Other/non-specified flooring in kitchen, bedrooms, bathroom, and laundry
- Bathrooms: One full bathroom; Two lavatories total; Main bathroom on second floor (approx. 10 x 8)
- Heating & cooling: Forced air heating; Natural gas fuel
- Interior features: 7 total rooms; Partially finished basement
- Laundry & utility: Laundry room in basement (approx. 8 x 10); Laundry room floor with other (non-specified) covering
Neighborhood map
What this means for you Summary
Snapshot
- This is a 3-bed/1.5-bath condo listed at $179k.
Deal economics
- At list price, monthly cash flow is $185 ($2k/yr) — positive.
- The deal already cash-flows at list — no discount required.
- Meets the 1% rule at list price ($2k rent vs $179k).
- Cap rate 7.5% vs local median 4.0% in Ypsilanti — top-decile yield for the area; either an underpriced asset or a hidden risk that comps aren't pricing in. Stress-test before assuming the spread holds.
Location & tenants
- Location reads 81/100 on livability (#71 in MI, #1,539 nationally) — a professional / high-income tenant draw. Strengths: amenities A+, commute A+, cost of living A+; Watch: crime F, employment D-.
- Lincoln Consolidated School District (rural): math 17% / reading 33% proficiency, ranked #393 of 540 in MI (top 73%) — low school quality limits family demand, transient renter base, plan for 1-2y turnover.
- Market conditions: Rents rising (+3.4%/yr); 239 active listings in the ZIP; 3 comparable units currently listed for rent nearby; rentals leasing fast (median 10d on market — plan ~1-2 weeks tenant-placement turnaround); 996 units permitted in Washtenaw County in 2024 (492 in 5+ unit buildings).
- This rent runs 32% of the median local income ($74k/yr) — at the standard rent-burdened threshold; future hikes will face affordability resistance.
Forward outlook
- Local home prices are declining (-3.0%/yr); year-one equity from $1k of loan paydown is wiped out by about $5k of value loss. Plan a longer hold.
- Washtenaw County population projected at +25% by 2050 — long-run rental-demand tailwind backs the buy-and-hold thesis.
Negotiation context
- Only 4 days on market — expect competitive offers; lowballing is unlikely to land.
- 5 sale attempts since 5y ago with the ask held roughly flat each time — persistent listings suggest the price (not the market) is what's stuck; bring a comps-based counter.
- Current owner paid $150k; 19% above their basis — modest negotiation headroom, anchor on the comps not their cost.
Questions for the listing agent
- Built in 1975 — when were the roof, HVAC, electrical panel, plumbing, and water heater last replaced?
- What does the HOA fee cover, when was the last increase, and are there any pending special assessments or reserve-fund shortfalls?
- Any open or pending special assessments — roof, HVAC, plumbing, elevator, façade? What's the per-unit balance and payoff schedule, and is the seller paying it off at close or rolling it to the buyer?
- Is there a deadline driving the sale (1031 exchange, divorce, estate, relocation)? That informs how much negotiation room exists.
- Crime grade is F in this area — have there been break-ins, vandalism, or insurance claims at this property in the last 3 years? What carrier currently insures it and at what premium?
- What's the average days-on-market for RENTAL listings here right now (not sales)? A rising rental-DOM trend means longer vacancies and softer asking-rent achievability than the comps imply.
- What's the recent tenant-quality profile in this submarket — average credit score on applications, eviction rate, late-payment / NSF rate, and stable-employment percentage? A property-management company in the area should have these aggregated.
- How much new apartment / multifamily construction is in the pipeline within 1–3 miles? Heavy new supply (>2% of stock underway) typically softens rents 12–24 months out; light construction supports rent growth.
Investment metrics
- 1% rule
- 1.08% ✓
- Cap rate
- 7.53%
- Cash-on-cash
- 4.42%
- DSCR
- 1.20
- GRM
- 7.7
CMA / ARV
No comps found within radius.
Projected returns pro-forma
-3.0% appreciation · 3.36% rent growth · sell at horizon
- IRR
- -8.9%
- Equity multiple
- 0.67×
- Total profit
- $-16,444
- Equity at exit
- $26,689
- IRR
- 1.1%
- Equity multiple
- 1.08×
- Total profit
- $4,126
- Equity at exit
- $15,477
Cash invested: $50,120 (down + closing). Projections, not guarantees.
Landlord ↔ Tenant lean methodology
- Overall (STATE)
- 62 Landlord-Friendly
- State Michigan
- 62 Landlord-Friendly · EVEN
- County
- — inherits STATE
- City
- — inherits STATE
ZIP-level market 48197
- Rents YoY
- 3.4%
- Active inventory
- 239
- Price-to-rent
- 7.7×
Monthly cashflow live
- Estimated rent
- $1,936 medium interval (Pro) →
- Mortgage (P&I)
- −$939
- Tax from tax record
- −$127 /mo · $1,522/yr
- Insurance
- −$75
- HOA
- −$205
- Vacancy / Maint / Mgmt
- −$407
- Net cashflow
- $185
Break-even live
UW: 25.0% down · 7.5% · 30yr · 1.5% tax · 5.0% vac · 8.0% maint · 8.0% mgmt
Financing live
Cash to close
- Down payment
- $44,750
- Closing costs
- $5,370
- Reserves months
- —
- Total cash needed
- —
Loan-product check · same deal, 3 products live
Conventional
25% down · 7.5% · 30yr
- Down + closing
- —
- Monthly P&I
- —
- Monthly cashflow
- —
- DSCR
- —
- Eligible?
- —
Personal DTI + credit; lowest rate.
DSCR
20% down · 8.5% · 30yr
- Down + closing
- —
- Monthly P&I
- —
- Monthly cashflow
- —
- DSCR
- —
- Eligible?
- —
No personal income docs; deal must DSCR.
Hard money
10% down · 12.0% · 12mo
- Down + closing
- —
- Monthly P&I
- —
- Monthly cashflow
- —
- DSCR
- —
- Eligible?
- —
Short-term bridge; refi at stabilization.
Rent comps 3 comps
| Address | Beds | Baths | Sqft | Rent | $/sqft | DOM | Units | Dist |
|---|---|---|---|---|---|---|---|---|
| 8753 Spinnaker Way Ypsilanti, MI | 3.0 | 1.0–2.0 | 893 | $2,010 | $2.25 | 10d | 16 | 0.19mi |
| 1428 Village Ln Ypsilanti, MI | 1.0–2.0 | 1.0 | 860 | $1,550 | $1.80 | 43d | 1 | 1.23mi |
| 9226 White Wing Dr Ypsilanti Charter Twp, MI | 2.0 | 2.0 | 1500 | $2,726 | $1.82 | 1d | 2 | 1.25mi |
HOA detail condo
- Monthly dues
- $205 · $2,460/yr
- Assessments
- None detected in remarks — confirm with the listing agent.
Listing history 7 events
-
2026-06-18days on market $179,000 Active 4 DOM
-
2026-06-17days on market $179,000 Active 3 DOM
-
2026-06-16days on market $179,000 Active 2 DOM
-
2026-06-15days on market $179,000 Active 1 DOM
-
2026-06-15days on market $179,000 Active 3 DOM
-
2026-06-14remarks 312-char remark
-
2026-06-14$179,000 Active 1 DOM
ⓘ Source: listings_history table (triggers on properties + properties_extension) + one-shot
backfill from property_details.listing_events for pre-trigger history.
Tax reassessment forecast MI · Partial reset (capped growth)
- Current annual tax
- $1,522 · $127/mo
- Projected year-2 tax
- $2,139 · $178/mo
- Expected delta
- +$617/yr (+$51/mo · 40.6%)
ⓘ Screening estimate from a state-policy table — verify with the county assessor before closing.
Climate risk First Street
- Flood 1/10 Low FEMA zone X (unshaded) · 0% chance over 30 yrs
- Wildfire 1/10 Low
- Heat 3/10 Moderate 7 d/yr ≥97°F today · 15 d/yr by 30 yrs out
- Wind 2/10 Low
- Air quality 2/10 Low 1 unhealthy d/yr today · 2 by 30 yrs out
Nearby sold comps map
Loading sold comps map…
Walkable amenities ~0.75 mi
Loading nearby amenities…
Taxation est. · year 1
- Rental income
- $23,237
- − Mortgage interest
- −$10,027
- − Property taxes
- −$1,522
- − Insurance
- −$895
- − Repairs & maintenance
- −$1,859
- − Management
- −$1,859
- − HOA
- −$2,460
- − Depreciation
- −$5,207
- Taxable loss
- −$592
- Est. tax savings @ 24.0%
- +$142
- After-tax cash flow
- $2,358/yr
For passive investors: Depreciation is non-cash, so a rental often shows a tax loss while cash-flowing — sheltering income. Rental losses are passive: they offset passive income freely, and up to $25,000/yr can offset ordinary (W-2) income if you actively participate and your MAGI is under $100k (phasing out to $0 by $150k); unused losses carry forward. On sale, claimed depreciation is recaptured at up to 25%, and gains may owe capital-gains tax (a 1031 exchange can defer both). Figures are a year-1 estimate at your 24.0% rate — not tax advice; consult a CPA.
Schools (NCES district)
- District
- Lincoln Consolidated School District
- NCES district ID
- 2621570
- Math proficiency
- 17% ▼ -7.00%
- Reading proficiency
- 33% ▼ -3.00%
- Median HH income
- $68,001
- Composite
- 23.72/100
- National rank
- #7827
- State rank
- #393 of 540 in MI
Livability — Ypsilanti
- Score
- 81/100
- State rank
- #71
- US rank
- #1539
Category grades
Schools grade is shown separately in the Schools card above.
Census & demographics
- County
- Washtenaw County · 306,860 people
- City population
- 105,769
- Metro
- Ann Arbor, MI
- Population (ZIP)
- 66,525
- Household income
- $73,737
- Rent vs Own
- Severe rent burden
- 3134.0
Population outlook (Washtenaw County) Hauer SSP2
- Today (2025)
- 402,878 people
- By 2030
- 424,104 · +5.3%
- By 2040
- 464,633 · +15.3%
- By 2050
- 504,728 · +25.3%
- By 2075
- 614,463 · +52.5%
- By 2100
- 676,181 · +67.8%
Race, ethnicity, and origin ACS 2023
- Neighborhood character
- Diverse neighborhood (Simpson 0.62)
- Race & ethnicity
- White 57% Black 23% Two or more races 9% Hispanic / Latino 8% Asian 6%
- Hispanic origin (detail)
- Mexican 4%
- Common ancestry
- Romanian 5% Slovak 3% Lithuanian 3%
- Foreign-born
- 12% · Canada, China, Vietnam
- Languages at home
- 84% English-only · Spanish 4% Other Indo-European 3% Arabic 3%
Political lean MEDSL · Washtenaw
- 2024 margin
- Solid D (+44.4) · D 71.0% · R 26.6% · Other 2.4%
- 2008→2024 swing
- +3.5pp toward D · 2008: 41.0pp · 2024: 44.4pp
- All cycles
- 2024: D+44.4 2020: D+46.6 2016: D+41.5 2012: D+36.0 2008: D+41.0
Not yet ingested
- Civics
- —
Market trends
- HPI YoY
- ▼ -223.94%
- Current HPI
- 217.0173
- Rent YoY
- ▲ 3.36%
- Metro
- Ann Arbor, MI
- State GDP YoY
- ▲ 1.37%
- F500 in state
- 28
Industry mix (Fortune 500 HQ in MI)
| Industry | F500 HQs | Revenue |
|---|---|---|
| Automotive Parts | 3 | $48B |
|
||
| Automotive | 2 | $372B |
|
||
| Chemicals | 1 | $45B |
|
||
| Automotive Retail | 1 | $29B |
|
||
| Healthcare / Medical Devices | 1 | $23B |
|
||
| Automotive Technology | 1 | $20B |
|
||
Price history
+113.1% since first listed15 events — show timeline
- 2026-06-12 Listed $179,000 MiRealSource-MiMLS
- 2023-10-30 Sold (Public Records) $150,000 Public Records
- 2021-11-01 Listing Removed — REALCOMP
- 2021-11-01 Listing Removed — MiRealSource-MiMLS
- 2021-10-26 Listed $100,000 MiRealSource-MiMLS
- 2021-10-26 Listed $100,000 REALCOMP
- 2021-10-01 Listing Removed — REALCOMP
- 2021-09-30 Listing Removed — MiRealSource-MiMLS
- 2021-07-09 Listed $159,900 MiRealSource-MiMLS
- 2021-07-09 Listed $159,900 REALCOMP
- 2021-07-08 Coming Soon — MiRealSource-MiMLS
- 2021-07-08 Coming Soon — REALCOMP
- 2005-01-10 Sold (Public Records) $134,000 Public Records
- 2002-04-18 Sold (Public Records) $110,000 Public Records
- 1999-08-10 Sold (Public Records) $84,000 Public Records
Property tax history
+11.1%/yrLatest (2016): $1,522 · +4.7% YoY. Source: county tax records.
Cash-flow waterfall
monthlySold comps — $/sqft
last 12 mo · ≤1 miLoading sold comps…