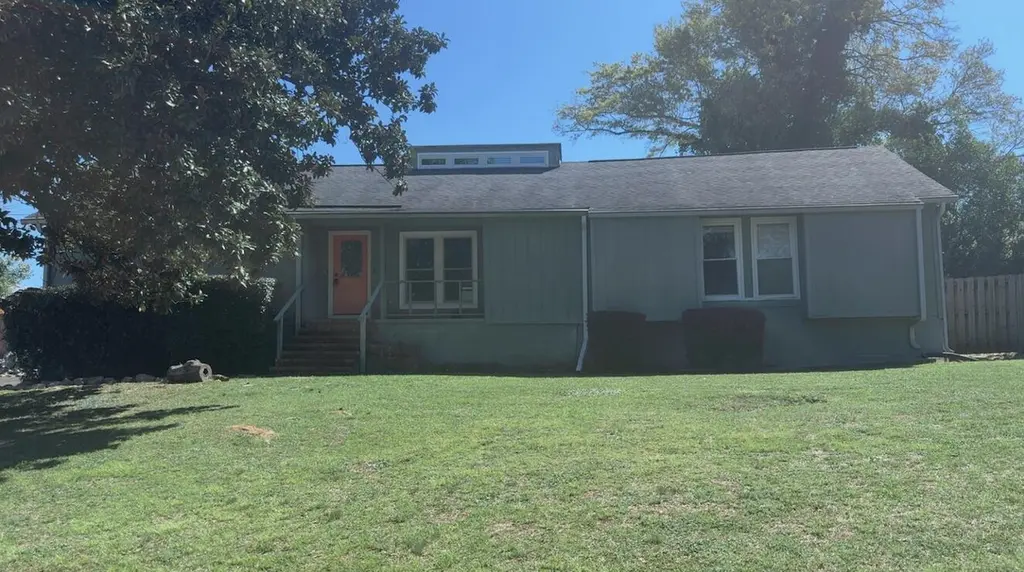
2200 Country Club Ct · Augusta-Richmond County consolidated government (balance), GA
Flood risk 1/10 · Minimal
- FEMA flood zone
- X (unshaded)
- Chance of flooding over 30 yrs
- 0.0%
- Est. flood insurance / yr
- $507 – $1,088
Fire risk 1/10 · Minimal
- Est. fire insurance / yr
- $963 – $1,789
Heat risk 7/10 · Major
- Hot days now (above 107°F)
- 7 days/yr
- Hot days in 30 yrs
- 16 days/yr
Wind risk 6/10 · Moderate
- Chance of severe wind over 30 yrs
- 72.0%
Air-quality risk 4/10 · Minor
- Unhealthy air days now
- 4 days/yr
- Unhealthy air days in 30 yrs
- 4 days/yr
Risk factors via First Street. Map © Google.
Why this score? — see what drove the B- grade
The composite is a weighted blend of 9 inputs, each scored 0–100. Each bar is that input's sub-score; the figure is the points it added to the 100-point composite (weight × sub-score).
- Cash flow +26.7/30.0
- ARV discount +13.8/15.0
- DSCR +9.1/10.0
- 1% rule +7.8/10.0
- Rent growth +3.6/5.0
- Livability +2.5/5.0
- Condition / age +2.5/5.0
- Schools +1.3/10.0
- Appreciation +0.0/10.0
$143,000
🖨 Deal sheet 📄 Offer letter ✓ Due diligence
Listing remarks MLS
Alot of house, As-Is, Owner finance or lease purchase possible.
Key facts
- 9,148 sq ft lot
- Built 1979
- Listed 20 days
Property features AI
Finance
- Financial info: Annual property tax approximately $2,951.26
Exterior
- Home design: Single family residence; Residential property
- Construction: Built on approximately 0.21-acre lot
- Exterior features: Fenced yard
Interior
- Bedrooms: 3 full bathrooms
- Bathrooms: 3 full bathrooms
- Interior features: No basement; 8 total rooms
Neighborhood map
What this means for you Summary
Snapshot
- This is a 4-bed/3.0-bath single-family listed at $143k.
Deal economics
- At list price, monthly cash flow is $385 ($5k/yr) — positive.
- The deal already cash-flows at list — no discount required.
- Meets the 1% rule at list price ($2k rent vs $143k).
- Recommended offer: $141k (1.5% below list) — sets the bar for market timing.
- Cap rate 9.5% vs local median 5.3% in Augusta-Richmond County consolidated government (balance) — top-decile yield for the area; either an underpriced asset or a hidden risk that comps aren't pricing in. Stress-test before assuming the spread holds.
Location & tenants
- Location reads: area grade B — affects rentability + tenant quality, not the cash-flow math above.
- Richmond County (urban): math 12% / reading 20% proficiency, ranked #154 of 174 in GA (top 88%) — low school quality limits family demand, transient renter base, plan for 1-2y turnover; 72% free/reduced lunch — lower-income household profile, screen leases tightly.
- Zoned schools: Merry Elementary School (math 12% / reading 17%, grade F, #996 of 1,228 statewide, top 83%, 397 students, 98% FRL); Tutt Middle School (math 7% / reading 21%, grade F, #405 of 470 statewide, top 86%, 476 students, 98% FRL); Westside High School (math 2% / reading 12%, grade F, #385 of 424 statewide, top 92%, 999 students, 98% FRL) — zoned schools average 98% FRL vs 72% district-wide (26 pts higher); higher-poverty schools than district average — tighter screening recommended.
- Market conditions: Rents rising fast (+4.3%/yr); 222 active listings in the ZIP; 15 comparable units currently listed for rent nearby; rentals lingering (median 44d on market — plan ~5-8 weeks vacancy on turnover, expect pricing pressure); 53% of comp listings sitting > 30 days — soft ceiling on asking rent; 561 units permitted in Richmond County in 2024 (0 in 5+ unit buildings).
- At $1,827/mo this rent would consume 47% of the median local household income ($47k/yr) (locally 1594% of renters already pay >50% of income on rent) — very limited rent-growth headroom before tenants either downsize or default.
Forward outlook
- Local home prices are declining (-3.0%/yr); year-one equity from $989 of loan paydown is wiped out by about $4k of value loss. Plan a longer hold.
- Richmond County population projected to shrink 5% by 2050 — rents likely to lag national; underwrite the cash flow, not the appreciation.
- At projected returns (-3.0% appreciation + 4.3% rent growth), your $40k cash investment doubles in ~9 years — after that, you're playing with house money.
Negotiation context
- It's been on market 20 days — a 2% lower offer ($141k) is reasonable based on typical stale-listing flexibility.
- 9 sale attempts since 23y ago; this cycle's ask has dropped $67k (32%) from the opening price — seller is motivated, your offer sets the floor, not the list.
- Current owner paid $70k; list at $143k implies a 105% gain — meaningful room to come down on a strong offer.
Risks & watch-outs
- Climate carrying-cost: major wind risk, 72% chance of damaging wind over 30y; extreme-heat days projected 7→16/yr by 2055 (HVAC capex compounding) — expect insurance premiums to compound above CPI over the hold.
Questions for the listing agent
- Built in 1979 — when were the roof, HVAC, electrical panel, plumbing, and water heater last replaced?
- Is there a deadline driving the sale (1031 exchange, divorce, estate, relocation)? That informs how much negotiation room exists.
- What's the average days-on-market for RENTAL listings here right now (not sales)? A rising rental-DOM trend means longer vacancies and softer asking-rent achievability than the comps imply.
- What's the recent tenant-quality profile in this submarket — average credit score on applications, eviction rate, late-payment / NSF rate, and stable-employment percentage? A property-management company in the area should have these aggregated.
- How much new for-sale + rental construction is in the pipeline within 1–3 miles? Heavy new supply typically softens prices + rents 12–24 months out; constrained supply supports both.
Investment metrics
- 1% rule
- 1.28% ✓
- Cap rate
- 9.52%
- Cash-on-cash
- 11.54%
- DSCR
- 1.51
- GRM
- 6.5
CMA / ARV
- ARV (median comp)
- $166,243
- List price
- $143,000
- Delta
- 23.31%
- Verdict
- OVERPRICED
- Comps
- 20 within 1.0 mi
Show comp detail 12 sales within ~0.75 mi
| Address | Dist | Beds/Ba | Sqft | Sold | Price | $/sf | Match |
|---|---|---|---|---|---|---|---|
| 2064 Ellis St | 0.33mi | 4/2.0 | 1,822 (-0%) | 6mo | $125,000 | $69 | 75 |
| 404 Brookside Ct | 0.09mi | 3/2.5 (-1) | 2,014 (+10%) | 6mo | $270,000 | $134 | 67 |
| 707 Hickman Rd | 0.49mi | 3/3.5 (-1) | 1,851 (+1%) | 2mo | $424,500 | $229 | 66 |
| 2210 Glendale Rd | 0.29mi | 3/2.0 (-1) | 1,883 (+3%) | 11mo | $275,000 | $146 | 63 |
| 2204 Country Club Ct | 0.05mi | 3/2.0 (-1) | 1,709 (-6%) | 21mo | $241,000 | $141 | 61 |
| 1940 Telfair St | 0.54mi | 3/2.0 (-1) | 1,825 (-0%) | 9mo | $135,000 | $74 | 58 |
| 801 Russell St | 0.67mi | 3/2.0 (-1) | 1,835 (+0%) | 12mo | $319,900 | $174 | 49 |
| 2406 Mohican Rd | 0.72mi | 3/2.0 (-1) | 1,893 (+4%) | 12mo | $358,000 | $189 | 42 |
| 2246 Overton Rd | 0.56mi | 3/2.0 (-1) | 1,740 (-5%) | 21mo | $319,900 | $184 | 40 |
| 2314 Redwood Dr | 0.47mi | 3/2.0 (-1) | 1,568 (-14%) | 13mo | $194,400 | $124 | 35 |
| 1922 Telfair Street St | 0.61mi | 4/2.0 | 1,554 (-15%) | 14mo | $90,000 | $58 | 31 |
| 811 Metcalf St | 0.75mi | 3/1.0 (-1) | 1,684 (-8%) | 23mo | $190,000 | $113 | 20 |
Match score weights: distance 35% · size 25% · config 20% · recency 20%. Top-matched comps best support the ARV.
Projected returns pro-forma
-3.0% appreciation · 4.29% rent growth · sell at horizon
- IRR
- 2.4%
- Equity multiple
- 1.10×
- Total profit
- $3,816
- Equity at exit
- $21,322
- IRR
- 13.3%
- Equity multiple
- 2.13×
- Total profit
- $45,295
- Equity at exit
- $12,364
Cash invested: $40,040 (down + closing). Projections, not guarantees.
Landlord ↔ Tenant lean methodology
- Overall (STATE)
- 90 Strongly Landlord-Friendly
- State Georgia
- 90 Strongly Landlord-Friendly · R+3
- County
- — inherits STATE
- City
- — inherits STATE
ZIP-level market 30904
- Rents YoY
- 4.3%
- Active inventory
- 222
- Price-to-rent
- 6.5×
Monthly cashflow live
- Estimated rent
- $1,827 high interval (Pro) →
- Mortgage (P&I)
- −$750
- Tax from tax record
- −$249 /mo · $2,985/yr
- Insurance
- −$60
- HOA
- −$0
- Vacancy / Maint / Mgmt
- −$384
- Net cashflow
- $385
Break-even live
UW: 25.0% down · 7.5% · 30yr · 1.5% tax · 5.0% vac · 8.0% maint · 8.0% mgmt
Financing live
Cash to close
- Down payment
- $35,750
- Closing costs
- $4,290
- Reserves months
- —
- Total cash needed
- —
Loan-product check · same deal, 3 products live
Conventional
25% down · 7.5% · 30yr
- Down + closing
- —
- Monthly P&I
- —
- Monthly cashflow
- —
- DSCR
- —
- Eligible?
- —
Personal DTI + credit; lowest rate.
DSCR
20% down · 8.5% · 30yr
- Down + closing
- —
- Monthly P&I
- —
- Monthly cashflow
- —
- DSCR
- —
- Eligible?
- —
No personal income docs; deal must DSCR.
Hard money
10% down · 12.0% · 12mo
- Down + closing
- —
- Monthly P&I
- —
- Monthly cashflow
- —
- DSCR
- —
- Eligible?
- —
Short-term bridge; refi at stabilization.
Rent comps 15 comps
| Address | Beds | Baths | Sqft | Rent | $/sqft | DOM | Units | Dist |
|---|---|---|---|---|---|---|---|---|
| 264 E Vineland Rd Augusta, GA | 3.0 | 2.0 | 1363 | $1,800 | $1.32 | 43d | 1 | 0.57mi |
| 264 E Vineland Rd Augusta, GA | 3.0 | 2.0 | 1363 | $1,700 | $1.25 | 23d | 1 | 0.57mi |
| 2404 Hiawassee Rd Augusta, GA | 3.0 | 1.0 | 1666 | $1,550 | $0.93 | 43d | 1 | 0.66mi |
| 2279 Overton Rd Augusta, GA | 3.0 | 2.5 | 2209 | $1,895 | $0.86 | 43d | 1 | 0.68mi |
| 217 E Vineland Rd Augusta, GA | 3.0 | 2.0 | 1551 | $1,550 | $1.00 | 23d | 1 | 0.81mi |
| 1742 Walker St Augusta, GA | 3.0 | 2.0 | 1384 | $1,600 | $1.16 | 44d | 1 | 0.91mi |
| 1701 Goodrich St Augusta, GA | 1.0–3.0 | 1.0–2.0 | 1056 | $2,756 | $2.61 | 14d | 11 | 1.06mi |
| 1105 Merry St Augusta, GA | 3.0 | 1.0 | 1281 | $1,350 | $1.05 | 23d | 1 | 1.09mi |
| 1812 Central Ave Unit 1 Augusta, GA | 3.0 | 1.5 | 1528 | $2,600 | $1.70 | 43d | 1 | 1.31mi |
| 1812 Central Ave Augusta, GA | 3.0 | 1.5 | 1568 | $2,200 | $1.40 | 23d | 1 | 1.31mi |
| 1812 Central Ave Augusta, GA | 3.0 | 1.5 | 1568 | $2,200 | $1.40 | 43d | 1 | 1.31mi |
| 1315 Merry St Augusta, GA | 3.0 | 2.0 | 1610 | $1,450 | $0.90 | 23d | 1 | 1.39mi |
| 2139 Holt St Augusta, GA | 3.0 | 2.0 | 1611 | $1,550 | $0.96 | 43d | 1 | 1.47mi |
| 2139 Holt St Augusta, GA | 3.0 | 2.0 | 1611 | $1,475 | $0.92 | 23d | 1 | 1.47mi |
| 2423 Brentwood Pl Augusta, GA | 3.0 | 2.0 | 1600 | $1,585 | $0.99 | 43d | 1 | 1.48mi |
Listing history 32 events
-
2026-06-09status $143,000 Pending 20 DOM
-
2026-06-08days on market $143,000 Active 20 DOM
-
2026-06-07days on market $143,000 Active 19 DOM
-
2026-06-03days on market $143,000 Active 15 DOM
-
2026-06-02days on market $143,000 Active 14 DOM
-
2026-06-01days on market $143,000 Active 13 DOM
-
2026-05-31days on market $143,000 Active 12 DOM
-
2026-05-30days on market $143,000 Active 11 DOM
-
2026-05-19status Active 563-char remark
-
2026-05-19price $143,000 563-char remark
-
2026-05-07status Pending
-
2026-05-07historical 563-char remark
-
2026-05-07historical
-
2026-04-15price $205,000
-
2026-03-17$210,000 Active
-
2026-03-17$205,000 563-char remark
-
2026-02-13price $87,000
Show marketing remark (63 chars)
Alot of house, As-Is, Owner finance or lease purchase possible.
-
2021-02-11soldstatus $69,750
Show marketing remark (63 chars)
Alot of house, As-Is, Owner finance or lease purchase possible.
-
2021-01-08$175,000
Show marketing remark (63 chars)
Alot of house, As-Is, Owner finance or lease purchase possible.
-
2015-12-16soldstatus $110,000
-
2015-12-10soldstatus $110,000
-
2015-12-10soldstatus $110,000
-
2015-06-12$109,900
-
2015-06-12$109,900
-
2013-05-30soldstatus $45,000
-
2013-05-30soldstatus $45,000
-
2013-04-15$57,120
-
2013-04-15$57,120
-
2007-06-22soldstatus $141,000
-
2004-08-12soldstatus $69,750 Closed
Show marketing remark (63 chars)
Alot of house, As-Is, Owner finance or lease purchase possible.
-
2004-08-12soldstatus $69,750
Show marketing remark (63 chars)
Alot of house, As-Is, Owner finance or lease purchase possible.
-
2003-10-07$87,000
ⓘ Source: listings_history table (triggers on properties + properties_extension) + one-shot
backfill from property_details.listing_events for pre-trigger history.
Tax reassessment forecast GA · Resets to sale price
- Current annual tax
- $2,985 · $249/mo
- Projected year-2 tax
- $2,985 · $249/mo
- Expected delta
- $0/yr ($0/mo · 0.0%)
ⓘ Screening estimate from a state-policy table — verify with the county assessor before closing.
Climate risk First Street
- Flood 1/10 Low FEMA zone X (unshaded) · 0% chance over 30 yrs
- Wildfire 1/10 Low
- Heat 7/10 Severe 7 d/yr ≥107°F today · 16 d/yr by 30 yrs out
- Wind 6/10 Major 72% chance of damaging wind over 30 yrs
- Air quality 4/10 Moderate 4 unhealthy d/yr today · 4 by 30 yrs out
Nearby sold comps map
Loading sold comps map…
Walkable amenities ~0.75 mi
Loading nearby amenities…
Taxation est. · year 1
- Rental income
- $21,921
- − Mortgage interest
- −$8,010
- − Property taxes
- −$2,985
- − Insurance
- −$715
- − Repairs & maintenance
- −$1,754
- − Management
- −$1,754
- − Depreciation
- −$4,160
- Taxable income
- $2,544
- Est. tax owed @ 24.0%
- −$611
- After-tax cash flow
- $4,009/yr
For passive investors: Depreciation is non-cash, so a rental often shows a tax loss while cash-flowing — sheltering income. Rental losses are passive: they offset passive income freely, and up to $25,000/yr can offset ordinary (W-2) income if you actively participate and your MAGI is under $100k (phasing out to $0 by $150k); unused losses carry forward. On sale, claimed depreciation is recaptured at up to 25%, and gains may owe capital-gains tax (a 1031 exchange can defer both). Figures are a year-1 estimate at your 24.0% rate — not tax advice; consult a CPA.
Schools (NCES district)
- District
- Richmond County
- NCES district ID
- 1304380
- Math proficiency
- 12% ▼ -9.00%
- Reading proficiency
- 20% ▼ -6.00%
- Median HH income
- $38,069
- Composite
- 13.43/100
- National rank
- #9524
- State rank
- #154 of 174 in GA
Livability — Augusta-Richmond County consolidated government (balance)
No livability data for this city. (Only ~50 U.S. cities are tracked.)
Census & demographics
- Census place
- Augusta-Richmond County consolidated government (balance), GA
- County
- Richmond County · 190,917 people
- City population
- 154,035
- Metro
- Augusta-Richmond County, GA-SC
- Population (ZIP)
- 23,400
- Household income
- $46,696
- Rent vs Own
- Severe rent burden
- 1594.0
Population outlook (Richmond County) Hauer SSP2
- Today (2025)
- 200,753 people
- By 2030
- 200,232 · -0.3%
- By 2040
- 196,813 · -2.0%
- By 2050
- 190,347 · -5.2%
- By 2075
- 172,496 · -14.1%
- By 2100
- 146,284 · -27.1%
Race, ethnicity, and origin ACS 2023
- Neighborhood character
- Diverse neighborhood (Simpson 0.61)
- Race & ethnicity
- Black 47% White 41% Hispanic / Latino 6% Two or more races 6% Asian 2%
- Hispanic origin (detail)
- Mexican 1%
- Common ancestry
- Italian 1% Slovak 1% Romanian 1%
- Foreign-born
- 3% · Canada, South Korea, Jamaica
- Languages at home
- 93% English-only · Spanish 4% Korean 1%
Political lean MEDSL · Richmond
- 2024 margin
- Solid D (+36.1) · D 67.8% · R 31.7%
- 2008→2024 swing
- +4.3pp toward D · 2008: 31.8pp · 2024: 36.1pp
- All cycles
- 2024: D+36.1 2020: D+37.2 2016: D+32.4 2012: D+33.8 2008: D+31.8
Not yet ingested
- Civics
- —
Market trends
- HPI YoY
- ▼ -211.97%
- Current HPI
- 199.0807
- Rent YoY
- ▲ 4.29%
- Metro
- Augusta-Richmond County, GA-SC
- State GDP YoY
- ▲ 2.66%
- F500 in state
- 28
Industry mix (Fortune 500 HQ in GA)
| Industry | F500 HQs | Revenue |
|---|---|---|
| Paper / Packaging | 2 | $29B |
|
||
| Retail | 1 | $160B |
|
||
| Transportation / Logistics | 1 | $91B |
|
||
| Airlines | 1 | $62B |
|
||
| Consumer Goods | 1 | $47B |
|
||
| Utilities | 1 | $25B |
|
||
Price history
+64.4% since first listed25 events — show timeline
- 2026-06-09 Pending — Hive MLS
- 2026-05-19 Relisted — Hive MLS
- 2026-05-19 Price Changed $143,000 Hive MLS
- 2026-05-07 Pending — Hive MLS
- 2026-05-07 Listing Removed — Hive MLS
- 2026-05-07 Listing Removed — Hive MLS
- 2026-04-15 Price Changed $205,000 Hive MLS
- 2026-03-17 Listed $210,000 Hive MLS
- 2026-03-17 Listed $205,000 Hive MLS
- 2026-02-13 Price Changed $87,000 Hive MLS
- 2021-02-11 Sold (MLS) $69,750 Hive MLS
- 2021-01-08 Listed $175,000 Hive MLS
- 2015-12-16 Sold (Public Records) $110,000 Public Records
- 2015-12-10 Sold (MLS) $110,000 Hive MLS
- 2015-12-10 Sold (MLS) $110,000 Hive MLS
- 2015-06-12 Listed $109,900 Hive MLS
- 2015-06-12 Listed $109,900 Hive MLS
- 2013-05-30 Sold (MLS) $45,000 Hive MLS
- 2013-05-30 Sold (MLS) $45,000 Hive MLS
- 2013-04-15 Listed $57,120 Hive MLS
- 2013-04-15 Listed $57,120 Hive MLS
- 2007-06-22 Sold (Public Records) $141,000 Public Records
- 2004-08-12 Sold (MLS) $69,750 Hive MLS
- 2004-08-12 Sold (MLS) $69,750 Hive MLS
- 2003-10-07 Listed $87,000 Hive MLS
Property tax history
+10.9%/yrLatest (2025): $2,985 · +31.2% YoY. Source: county tax records.
Cash-flow waterfall
monthlySold comps — $/sqft
last 12 mo · ≤1 miLoading sold comps…