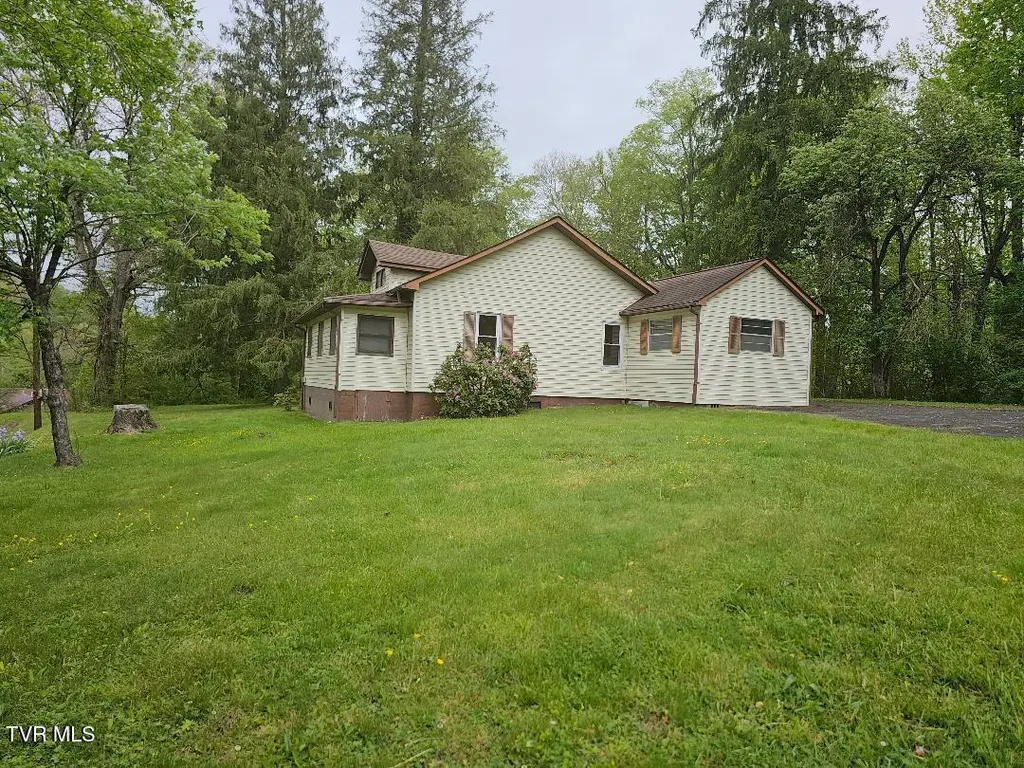
736 Park Ave · Norton, VA
Flood risk 1/10 · Minimal
- FEMA flood zone
- X (unshaded)
- Chance of flooding over 30 yrs
- 0.0%
- Est. flood insurance / yr
- $507 – $1,088
Fire risk 4/10 · Minor
- Est. fire insurance / yr
- $666 – $1,236
Heat risk 2/10 · Minimal
- Hot days now (above 92°F)
- 7 days/yr
- Hot days in 30 yrs
- 20 days/yr
Wind risk 2/10 · Minimal
- Chance of severe wind over 30 yrs
- 0.0%
Air-quality risk 1/10 · Minimal
- Unhealthy air days now
- 0 days/yr
- Unhealthy air days in 30 yrs
- 0 days/yr
Risk factors via First Street. Map © Google.
Why this score? — see what drove the C grade
The composite is a weighted blend of 9 inputs, each scored 0–100. Each bar is that input's sub-score; the figure is the points it added to the 100-point composite (weight × sub-score).
- Cash flow +20.6/30.0
- ARV discount +7.5/15.0
- DSCR +6.5/10.0
- Schools +6.3/10.0
- 1% rule +5.4/10.0
- Appreciation +5.1/10.0
- Livability +3.7/5.0
- Rent growth +2.5/5.0
- Condition / age +2.2/5.0
$115,000
🖨 Deal sheet 📄 Offer letter ✓ Due diligence
Listing remarks
This 3-bedroom, 1-bath home located in the City of Norton offers a great opportunity for investors, first-time buyers, or anyone looking for full-time living with plenty of outdoor space. Situated on approximately 1.77 acres on 2 adjoining lots, the property provides room to enjoy gardening, recreation, or future possibilities. Recent updates include a newer roof installed in 2018 and a new sewer line from the city connection to the home, helping provide peace of mind for years to come. The home also includes an electric range, refrigerator (new in 2024), washer, and dryer, making it immediately livable. Whether you are searching for an investment property, rental opportunity, or an afforda
Key facts
- Electric range
- Washer and dryer
- Refrigerator
Tags
Property features AI
Exterior
- Parking: Asphalt parking
- Utilities: Public water; Public sewer; Electricity connected; Water connected; Sewer connected
- Home design: Single-family residence; One-story house
- Construction: Vinyl siding; Shingle roof
- Exterior features: Storm door(s); Level, partially wooded, sloped lot with steep slope
Interior
- Kitchen: Electric range; Refrigerator
- Flooring: Carpet; Vinyl
- Bathrooms: 1 full bathroom
- Heating & cooling: Heat pump heating; Heat pump cooling
- Interior features: Entrance foyer; Laminate counters; Pantry; Double pane windows; Crawl space basement
- Laundry & utility: Washer hookup; Electric dryer hookup; Washer; Dryer
Neighborhood map
What this means for you Summary
Snapshot
- This is a 3-bed/1.0-bath single-family listed at $115k. Condition is rated fair.
Deal economics
- At list price, monthly cash flow is $153 ($2k/yr) — positive.
- The deal already cash-flows at list — no discount required.
- Meets the 1% rule at list price ($1k rent vs $115k).
- Recommended offer: $112k (3.0% below list) — sets the bar for market timing.
- Cap rate 7.9% vs local median 4.4% in Norton — top-decile yield for the area; either an underpriced asset or a hidden risk that comps aren't pricing in. Stress-test before assuming the spread holds.
Location & tenants
- Location reads 74/100 on livability (#139 in VA, #4,441 nationally) — a middle-class / working-renter tenant base. Strengths: cost of living A+, health & safety A+; Watch: commute D, crime F, amenities F.
- Norton City Public School District (town): math 68% / reading 85% proficiency, ranked #12 of 131 in VA (top 9%) — strong family-tenant draw, lease renewals of 3-5y typical.
- Zoned schools: Norton Elementary (math 67% / reading 82%, grade A, #220 of 1,108 statewide, top 22%, 501 students, 96% FRL); J.I. Burton High (math 72% / reading 92%, grade A, #40 of 319 statewide, top 15%, 312 students, 96% FRL) — zoned schools average 96% FRL vs 58% district-wide (38 pts higher); higher-poverty schools than district average — tighter screening recommended.
- Market conditions: 40 active listings in the ZIP.
Forward outlook
- In year one you build about $958 of equity ($795 loan paydown + $163 appreciation (0.1% local appreciation)).
- Norton County population projected to shrink 4% by 2050 — rents likely to lag national; underwrite the cash flow, not the appreciation.
- At projected returns (0.1% appreciation + 3.0% rent growth), your $32k cash investment doubles in ~8 years — after that, you're playing with house money.
Negotiation context
- It's been on market 49 days — a 3% lower offer ($112k) is reasonable based on typical stale-listing flexibility.
- 2 sale attempts; this cycle's ask has dropped $14k (11%) from the opening price — seller is motivated, your offer sets the floor, not the list.
Risks & watch-outs
- Watch-outs: built in 1925 — expect roof / HVAC / electrical / plumbing capex.
Questions for the listing agent
- It's been on market 49 days. Have you received any prior offers? Is the seller open to a 3% concession, seller financing, or rate buy-down credit?
- Have any recent inspections been done? Can we get a copy of the seller's disclosures and any deferred-maintenance estimates?
- Built in 1925 — when were the roof, HVAC, electrical panel, plumbing, and water heater last replaced?
- Is there a deadline driving the sale (1031 exchange, divorce, estate, relocation)? That informs how much negotiation room exists.
- Schools are A-rated — typically a magnet for longer-tenancy family renters. What's the average tenant stay here, and is there a school-zone premium baked into asking?
- Crime grade is F in this area — have there been break-ins, vandalism, or insurance claims at this property in the last 3 years? What carrier currently insures it and at what premium?
- What's the average days-on-market for RENTAL listings here right now (not sales)? A rising rental-DOM trend means longer vacancies and softer asking-rent achievability than the comps imply.
- What's the recent tenant-quality profile in this submarket — average credit score on applications, eviction rate, late-payment / NSF rate, and stable-employment percentage? A property-management company in the area should have these aggregated.
- How much new for-sale + rental construction is in the pipeline within 1–3 miles? Heavy new supply typically softens prices + rents 12–24 months out; constrained supply supports both.
Investment metrics
- 1% rule
- 1.04% ✓
- Cap rate
- 7.89%
- Cash-on-cash
- 5.70%
- DSCR
- 1.25
- GRM
- 8.0
CMA / ARV
- ARV (median comp)
- $61,400
- List price
- $115,000
- Delta
- 87.29%
- Verdict
- OVERPRICED
- Comps
- 11 within 1.0 mi
Show comp detail 3 sales within ~0.75 mi
| Address | Dist | Beds/Ba | Sqft | Sold | Price | $/sf | Match |
|---|---|---|---|---|---|---|---|
| 617 Va Ave Ave | 0.23mi | 3/1.0 | 1,239 (+1%) | 8mo | $31,500 | $25 | 81 |
| 692 Hamner Ave | 0.26mi | 3/2.0 | 1,344 (+9%) | 9mo | $105,000 | $78 | 61 |
| 726 Virginia Ave Ave | 0.07mi | 2/1.0 (-1) | 1,406 (+14%) | 12mo | $56,800 | $40 | 58 |
Match score weights: distance 35% · size 25% · config 20% · recency 20%. Top-matched comps best support the ARV.
Projected returns pro-forma
0.14% appreciation · 3.0% rent growth · sell at horizon
- IRR
- 4.6%
- Equity multiple
- 1.22×
- Total profit
- $7,157
- Equity at exit
- $34,211
- IRR
- 9.8%
- Equity multiple
- 2.08×
- Total profit
- $34,801
- Equity at exit
- $41,782
Cash invested: $32,200 (down + closing). Projections, not guarantees.
Landlord ↔ Tenant lean methodology
- Overall (STATE)
- 55 Moderately Landlord-Leaning
- State Virginia
- 55 Moderately Landlord-Leaning · D+2
- County
- — inherits STATE
- City
- — inherits STATE
ZIP-level market 24273
- Home prices YoY
- 0.1%
- Active inventory
- 40
- Price-to-rent
- 8.0×
Monthly cashflow live
- Estimated rent
- $1,199 medium interval (Pro) →
- Mortgage (P&I)
- −$603
- Tax est. 1.5%
- −$144 /mo · $1,725/yr
- Insurance
- −$48
- HOA
- −$0
- Vacancy / Maint / Mgmt
- −$252
- Net cashflow
- $153
Break-even live
UW: 25.0% down · 7.5% · 30yr · 1.5% tax · 5.0% vac · 8.0% maint · 8.0% mgmt
Financing live
Cash to close
- Down payment
- $28,750
- Closing costs
- $3,450
- Reserves months
- —
- Total cash needed
- —
Loan-product check · same deal, 3 products live
Conventional
25% down · 7.5% · 30yr
- Down + closing
- —
- Monthly P&I
- —
- Monthly cashflow
- —
- DSCR
- —
- Eligible?
- —
Personal DTI + credit; lowest rate.
DSCR
20% down · 8.5% · 30yr
- Down + closing
- —
- Monthly P&I
- —
- Monthly cashflow
- —
- DSCR
- —
- Eligible?
- —
No personal income docs; deal must DSCR.
Hard money
10% down · 12.0% · 12mo
- Down + closing
- —
- Monthly P&I
- —
- Monthly cashflow
- —
- DSCR
- —
- Eligible?
- —
Short-term bridge; refi at stabilization.
Listing history 16 events
-
2026-06-18days on market $115,000 Active 49 DOM
-
2026-06-17days on market $115,000 Active 48 DOM
-
2026-06-16days on market $115,000 Active 47 DOM
-
2026-06-15days on market $115,000 Active 46 DOM
-
2026-06-15days on market $115,000 Active 45 DOM
-
2026-06-13days on market $115,000 Active 44 DOM
-
2026-06-12statusdays on market $115,000 Active 43 DOM
-
2026-06-09days on market $115,000 Active Under Contract 40 DOM
-
2026-06-08days on market $115,000 Active Under Contract 39 DOM
-
2026-06-08days on market $115,000 Active Under Contract 38 DOM
-
2026-06-05days on market $115,000 Active Under Contract 36 DOM
-
2026-06-03days on market $115,000 Active Under Contract 34 DOM
-
2026-06-02days on market $115,000 Active Under Contract 33 DOM
-
2026-06-01days on market $115,000 Active Under Contract 32 DOM
-
2026-05-31days on market $115,000 Active Under Contract 31 DOM
-
2026-04-28$129,000 Active 875-char remark
ⓘ Source: listings_history table (triggers on properties + properties_extension) + one-shot
backfill from property_details.listing_events for pre-trigger history.
Climate risk First Street
- Flood 1/10 Low FEMA zone X (unshaded) · 0% chance over 30 yrs
- Wildfire 4/10 Moderate
- Heat 2/10 Low 7 d/yr ≥92°F today · 20 d/yr by 30 yrs out
- Wind 2/10 Low 0% chance of damaging wind over 30 yrs
- Air quality 1/10 Low 0 unhealthy d/yr today · 0 by 30 yrs out
Nearby sold comps map
Loading sold comps map…
Walkable amenities ~0.75 mi
Loading nearby amenities…
Taxation est. · year 1
- Rental income
- $14,394
- − Mortgage interest
- −$6,442
- − Property taxes
- −$1,725
- − Insurance
- −$575
- − Repairs & maintenance
- −$1,151
- − Management
- −$1,151
- − Depreciation
- −$3,345
- Taxable income
- $3
- Est. tax owed @ 24.0%
- −$1
- After-tax cash flow
- $1,833/yr
For passive investors: Depreciation is non-cash, so a rental often shows a tax loss while cash-flowing — sheltering income. Rental losses are passive: they offset passive income freely, and up to $25,000/yr can offset ordinary (W-2) income if you actively participate and your MAGI is under $100k (phasing out to $0 by $150k); unused losses carry forward. On sale, claimed depreciation is recaptured at up to 25%, and gains may owe capital-gains tax (a 1031 exchange can defer both). Figures are a year-1 estimate at your 24.0% rate — not tax advice; consult a CPA.
Condition & rehab AI · 13 photos
This home requires significant repairs and maintenance, including a new roof, exterior painting, HVAC system replacement, and window replacement. The home's condition is fair, and with these updates, it could become a move-in-ready property with increased resale and rental value.
Repairs flagged
- Major roof — The roof appears to be in poor condition, with visible wear and tear.
- Major exterior siding — The siding is peeling and the paint is chipping.
- Major HVAC system — The HVAC system appears to be old and may need replacement.
- Major windows — The windows appear to be old and may need replacement.
- Major interior walls — The interior walls have peeling paint and the ceiling appears to have some discoloration.
- Major landscaping — The landscaping is overgrown and the overall curb appeal is low.
Value-add opportunities
- Both paint the exterior — Painting the exterior can improve the curb appeal and increase the home's value.
- Both repair the roof — Repairing the roof can improve the home's structural integrity and increase its value.
- Both replace the HVAC system — Replacing the HVAC system can improve the home's comfort and energy efficiency, increasing its value.
- Both replace the windows — Replacing the windows can improve the home's energy efficiency and increase its value.
- Both repair the interior walls — Repairing the interior walls can improve the home's appearance and increase its value.
- Both landscape the yard — Landscape the yard can improve the home's curb appeal and increase its value.
Renovation cost estimate screening
| Repair item | Severity | Est. cost |
|---|---|---|
| roof · The roof appears to be in poor condition, with visible wear and tear. | Major | $15,000–50,000 |
| exterior siding · The siding is peeling and the paint is chipping. | Major | $15,000–50,000 |
| HVAC system · The HVAC system appears to be old and may need replacement. | Major | $15,000–50,000 |
| windows · The windows appear to be old and may need replacement. | Major | $15,000–50,000 |
| interior walls · The interior walls have peeling paint and the ceiling appears to have some discoloration. | Major | $15,000–50,000 |
| landscaping · The landscaping is overgrown and the overall curb appeal is low. | Major | $15,000–50,000 |
| Total estimated repair cost · 6 items | $90,000–300,000 |
Value-add ROI direction
- Both paint the exterior — Painting the exterior can improve the curb appeal and increase the home's value. ↑
- Both repair the roof — Repairing the roof can improve the home's structural integrity and increase its value. ↑
- Both replace the HVAC system — Replacing the HVAC system can improve the home's comfort and energy efficiency, increasing its value. ↑
- Both replace the windows — Replacing the windows can improve the home's energy efficiency and increase its value. ↑
- Both repair the interior walls — Repairing the interior walls can improve the home's appearance and increase its value. ↑
- Both landscape the yard — Landscape the yard can improve the home's curb appeal and increase its value. ↑
ⓘ Cost ranges are severity-bucket heuristics (US national rule-of-thumb). Get contractor quotes + a written scope before underwriting a rehab budget.
Schools (NCES district)
- District
- Norton City Public School District
- NCES district ID
- 5102760
- Math proficiency
- 68% ▼ -20.00%
- Reading proficiency
- 85% ▲ 2.00%
- Median HH income
- $34,636
- Composite
- 63.22/100
- National rank
- #636
- State rank
- #12 of 131 in VA
Livability — Norton
- Score
- 74/100
- State rank
- #139
- US rank
- #4441
Category grades
Schools grade is shown separately in the Schools card above.
Census & demographics
- Census place
- Norton, VA
- Population (ZIP)
- 5,860
Population outlook (Norton County) Hauer SSP2
- Today (2025)
- 3,919 people
- By 2030
- 3,899 · -0.5%
- By 2040
- 3,838 · -2.1%
- By 2050
- 3,778 · -3.6%
- By 2075
- 3,584 · -8.5%
- By 2100
- 3,154 · -19.5%
Race, ethnicity, and origin ACS 2023
- Neighborhood character
- Predominantly White (95%)
- Race & ethnicity
- White 95% Two or more races 3% Hispanic / Latino 2%
- Common ancestry
- Italian 2% Romanian 2% Lithuanian 2%
- Foreign-born
- 1% · Canada
- Languages at home
- 98% English-only · Spanish 1%
Political lean MEDSL · Norton
- 2024 margin
- Solid R (+43.6) · D 27.9% · R 71.5%
- 2008→2024 swing
- -43.5pp toward R · 2008: -0.1pp · 2024: -43.6pp
- All cycles
- 2024: R+43.6 2020: R+40.3 2016: R+43.8 2012: R+22.1 2008: R+0.1
Not yet ingested
- Civics
- —
Market trends
- HPI YoY
- ▲ 0.14%
- Current HPI
- 140.9507
- Rent YoY
- —
- Metro
- —
- State GDP YoY
- ▲ 2.40%
- F500 in state
- 50
Industry mix (Fortune 500 HQ in VA)
| Industry | F500 HQs | Revenue |
|---|---|---|
| Aerospace / Defense | 4 | $236B |
|
||
| Technology / Defense | 3 | $32B |
|
||
| Financial Services | 2 | $176B |
|
||
| Utilities | 2 | $27B |
|
||
| Insurance | 2 | $25B |
|
||
| Technology | 2 | $15B |
|
||
Price history
-10.9% since first listed4 events — show timeline
- 2026-06-10 Relisted — TVRMLS
- 2026-05-29 Contingent — TVRMLS
- 2026-05-27 Price Changed $115,000 TVRMLS
- 2026-04-28 Listed $129,000 TVRMLS
Cash-flow waterfall
monthlySold comps — $/sqft
last 12 mo · ≤1 miLoading sold comps…