490 Broad Ave S Unit H490 · Naples, FL
Flood risk 8/10 · Major
- FEMA flood zone
- AE
- Chance of flooding over 30 yrs
- 0.99%
- Est. flood insurance / yr
- $1,737 – $8,500
Fire risk 1/10 · Minimal
- Est. fire insurance / yr
- $947 – $1,759
Heat risk 10/10 · Severe
- Hot days now (above 107°F)
- 7 days/yr
- Hot days in 30 yrs
- 27 days/yr
Wind risk 10/10 · Severe
- Chance of severe wind over 30 yrs
- 99.0%
Air-quality risk 3/10 · Minor
- Unhealthy air days now
- 3 days/yr
- Unhealthy air days in 30 yrs
- 3 days/yr
Risk factors via First Street. Map © Google.
Why this score? — see what drove the D+ grade
The composite is a weighted blend of 9 inputs, each scored 0–100. Each bar is that input's sub-score; the figure is the points it added to the 100-point composite (weight × sub-score).
- Cash flow +10.8/30.0
- ARV discount +7.5/15.0
- Appreciation +7.0/10.0
- Schools +5.0/10.0
- Rent growth +4.7/5.0
- 1% rule +4.1/10.0
- Livability +4.0/5.0
- DSCR +3.1/10.0
- Condition / age +2.5/5.0
$560,000
🖨 Deal sheet (PDF) 📄 Offer letter ✓ Due diligence
Listing remarks MLS
HERON CLUB BUYERS MAY NOW BE ANY AGE! NO 55+YRS LIMITATION LIKE OTHER VILLAGE GREEN CONDOS. LOVELY 2 BEDROOM, 2 BATH, FURNISHED, SECOND FLOOR CONDO WITH ELEVATOR. DETACHED CARPORT AND GUEST PARKING SPACES. LOCATED IN THE HEART OF OLDE NAPLES. ACROSS THE STREET FROM THE COMMUNITY POOL AND CLUBHOUSE. A GREAT BUY FOR BUYERS WHO WANT TO BE CLOSE TO THE BEACH, NAPLES PIER, 3RD STREET SHOPS AND RESTAURANTS. LOWEST PRICE UNIT IN THE BUILDING!
Key facts
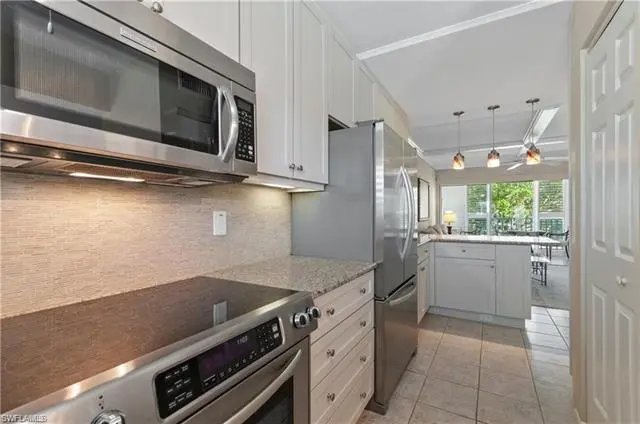
- Custom cabinetry
- Breakfast island
- Extra storage
Tags
Property features AI
Finance
- Other: Deeded restrictions: no motorcycles, no RV
- Financial info: Multi-unit property: 2 units per floor, 42 units in building, 313 units in complex, single-story building
- HOA & community: Quarterly condo fee; Professional management; Community amenities include BBQ/picnic, bike storage, bocce court, clubhouse, common laundry, community pool, community room, extra storage, internet access, library, shuffleboard, sidewalks, streetlights, underground utilities, and vehicle wash area; Maintenance covers insurance, irrigation water, laundry facilities, lawn/land maintenance, legal/accounting, manager, master association fee, pest control (interior & exterior), recreation facilities, repairs, reserves, sewer, trash removal and water; Total annual recurring fees indicated; One-time fees apply
Exterior
- Parking: 1 assigned covered parking space; Driveway paved; Guest parking available; Detached 1-car carport
- Security: Impact resistant doors and windows
- Utilities: Central water; Central sewer; Cable available
- Home design: Residential condo in a low-rise (1–3) building; Florida / Traditional style; Rear exposure faces south; Located in Village Green / Heron Club development
- Construction: Concrete block construction; Stucco exterior finish; Built-up or flat roof; Originally built in 1969
- Exterior features: Outdoor kitchen; Patio; Storage
Interior
- Kitchen: Island; Pantry; Dishwasher; Disposal; Microwave; Range; Refrigerator/freezer; Self-cleaning oven
- Bedrooms: 2 bedrooms (split bedroom floor plan)
- Flooring: Carpet; Tile
- Bathrooms: 2 full bathrooms; Master bath with shower only
- Heating & cooling: Central electric heat; Central electric air conditioning; Ceiling fans
- Interior features: Bar; Built-in cabinets; Cable prewire; High-speed internet available; Smoke detectors; Walk-in closet; Window coverings; Common elevator access; Partially furnished; Den / study; Guest bath; Screened lanai/porch; Island and pantry in kitchen; Breakfast bar / dining in living area; Four ceiling fans
- Laundry & utility: Laundry facilities available (community)
Neighborhood map
What this means for you Summary
Snapshot
- This is a 2-bed/2.0-bath condo listed at $560k.
Deal economics
- At list price, monthly cash flow is $-681 ($-8k/yr) — negative.
- To cash-flow at today's rent, offer at most $440k (21.5% below list).
- To meet the 1% rule (rent ≥ 1% of price), the offer needs to be $510k (8.9% below list).
- Recommended offer: $440k (21.5% below list) — sets the bar for cash-flow.
Location & tenants
- Location reads 80/100 on livability (#126 in FL, #1,903 nationally) — a professional / high-income tenant draw. Strengths: crime A+, amenities A+, employment A+; Watch: commute D+, cost of living F.
- Collier (suburban): math 60% / reading 56% proficiency, ranked #16 of 73 in FL (top 22%) — acceptable for families but not a draw, mixed tenant base, ~2y average lease.
- Zoned schools: Lake Park Elementary School (math 76% / reading 77%, grade A, #185 of 2,144 statewide, top 9%, 502 students, 39% FRL); Gulfview Middle School (math 78% / reading 68%, grade A, #44 of 571 statewide, top 8%, 582 students, 40% FRL); Naples High School (math 47% / reading 52%, grade D, #179 of 667 statewide, top 29%, 1,719 students, 39% FRL) — zoned schools average 39% FRL vs 55% district-wide (16 pts lower); this property's tenant base skews higher-income than the district average.
- Market conditions: Rents rising fast (+8.8%/yr); 616 active listings in the ZIP; 40 comparable units currently listed for rent nearby; rentals at typical pace (median 25d on market — plan ~3-4 weeks tenant-placement turnaround); high-income renter base; 3,520 units permitted in Collier County in 2024 (959 in 5+ unit buildings).
- At $5,101/mo this rent would consume 47% of the median local household income ($131k/yr) (locally 333% of renters already pay >50% of income on rent) — very limited rent-growth headroom before tenants either downsize or default.
Forward outlook
- In year one you build about $27k of equity ($4k loan paydown + $23k appreciation (4.1% local appreciation)).
- Collier County population projected at +30% by 2050 — long-run rental-demand tailwind backs the buy-and-hold thesis.
- By year 2, paydown + projected appreciation supports a ~$43k cash-out refi (75% LTV) — recoverable capital for the next deal without selling this one.
Negotiation context
- It's been on market 51 days — a 3% lower offer ($543k) is reasonable based on typical stale-listing flexibility.
- 4 sale attempts since 17y ago with the ask held roughly flat each time — persistent listings suggest the price (not the market) is what's stuck; bring a comps-based counter.
- Current owner paid $210k; list at $560k implies a 167% gain — meaningful room to come down on a strong offer.
Risks & watch-outs
- Watch-outs: flood insurance adds $427/mo.
- Climate carrying-cost: in FEMA flood zone AE (mandatory federal flood insurance); severe wind risk, 99% chance of damaging wind over 30y; extreme-heat days projected 7→27/yr by 2055 (HVAC capex compounding) — expect insurance premiums to compound above CPI over the hold.
Questions for the listing agent
- What do current leases actually rent for vs. the listed asking? Can we see a recent rent roll and the last 12 months of T-12 income?
- It's been on market 51 days. Have you received any prior offers? Is the seller open to a 21% concession, seller financing, or rate buy-down credit?
- Built in 1969 — when were the roof, HVAC, electrical panel, plumbing, and water heater last replaced?
- What's the actual annual flood-insurance premium (NFIP or private), and is the property in a SFHA with mandatory coverage?
- What does the HOA fee cover, when was the last increase, and are there any pending special assessments or reserve-fund shortfalls?
- Any open or pending special assessments — roof, HVAC, plumbing, elevator, façade? What's the per-unit balance and payoff schedule, and is the seller paying it off at close or rolling it to the buyer?
- Is there a deadline driving the sale (1031 exchange, divorce, estate, relocation)? That informs how much negotiation room exists.
- Schools are B-rated — typically a magnet for longer-tenancy family renters. What's the average tenant stay here, and is there a school-zone premium baked into asking?
- The area grade is low — what's the realistic commute time and amenity access for the typical tenant pool here? Any planned neighborhood developments (good or bad) we should know about?
- What's the average days-on-market for RENTAL listings here right now (not sales)? A rising rental-DOM trend means longer vacancies and softer asking-rent achievability than the comps imply.
- What's the recent tenant-quality profile in this submarket — average credit score on applications, eviction rate, late-payment / NSF rate, and stable-employment percentage? A property-management company in the area should have these aggregated.
- How much new apartment / multifamily construction is in the pipeline within 1–3 miles? Heavy new supply (>2% of stock underway) typically softens rents 12–24 months out; light construction supports rent growth.
Investment metrics
- 1% rule
- 0.91% ✗
- Cap rate
- 5.75%
- Cash-on-cash
- -1.95%
- DSCR
- 0.91
- GRM
- 9.1
CMA / ARV
No comps found within radius.
Projected returns pro-forma
4.08% appreciation · 8.0% rent growth · sell at horizon
- IRR
- 8.6%
- Equity multiple
- 1.54×
- Total profit
- $84,384
- Equity at exit
- $286,665
- IRR
- 13.1%
- Equity multiple
- 3.38×
- Total profit
- $373,682
- Equity at exit
- $471,061
Cash invested: $156,800 (down + closing). Projections, not guarantees.
Landlord ↔ Tenant lean methodology
- Overall (STATE)
- 87 Strongly Landlord-Friendly
- State Florida
- 87 Strongly Landlord-Friendly · R+3
- County
- — inherits STATE
- City
- — inherits STATE
ZIP-level market 34102
- Home prices YoY
- 1.3%
- Rents YoY
- 8.8%
- Active inventory
- 616
- Price-to-rent
- 9.1×
Monthly cashflow live
- Estimated rent
- $5,101 medium interval (Pro) →
- Mortgage (P&I)
- −$2,937
- Tax from tax record
- −$384 /mo · $4,613/yr
- Insurance
- −$233
- Flood insurance flood zone
- −$427 /mo · $5,118/yr
- HOA
- −$730
- Vacancy / Maint / Mgmt
- −$1,071
- Net cashflow
- $-681
Break-even live
Sensitivity live
| Price | -10% $-364 | -5% $-523 | +0% $-681 | +5% $-840 | +10% $-998 |
|---|---|---|---|---|---|
| Rent | -10% $-1,084 | -5% $-883 | +0% $-681 | +5% $-480 | +10% $-278 |
| Rate | -1.0pp $-399 | -0.5pp $-539 | base $-681 | +0.5pp $-827 | +1.0pp $-974 |
UW: 25.0% down · 7.5% · 30yr · 1.5% tax · 5.0% vac · 8.0% maint · 8.0% mgmt
Financing live
Cash to close
- Down payment
- $140,000
- Closing costs
- $16,800
- Reserves months
- —
- Total cash needed
- —
Loan-product check · same deal, 3 products live
Conventional
25% down · 7.5% · 30yr
- Down + closing
- —
- Monthly P&I
- —
- Monthly cashflow
- —
- DSCR
- —
- Eligible?
- —
Personal DTI + credit; lowest rate.
DSCR
20% down · 8.5% · 30yr
- Down + closing
- —
- Monthly P&I
- —
- Monthly cashflow
- —
- DSCR
- —
- Eligible?
- —
No personal income docs; deal must DSCR.
Hard money
10% down · 12.0% · 12mo
- Down + closing
- —
- Monthly P&I
- —
- Monthly cashflow
- —
- DSCR
- —
- Eligible?
- —
Short-term bridge; refi at stabilization.
Rent comps 40 comps
| Address | Beds | Baths | Sqft | Rent | $/sqft | DOM | Units | Dist |
|---|---|---|---|---|---|---|---|---|
| 546 Broad Ave S #546 Naples, FL | 2.0 | 2.0 | 890 | $4,800 | $5.39 | 25d | 1 | 0.03mi |
| 473 12th Ave S Naples, FL | 1.0–2.0 | 1.0–2.0 | 700 | $7,200 | $10.29 | 25d | 2 | 0.04mi |
| 421 12th Ave S Unit A1 Naples, FL | 2.0 | 1.0 | 760 | $6,400 | $8.42 | 15d | 1 | 0.08mi |
| 404 Broad Ave S Unit H404 Naples, FL | 2.0 | 2.0 | 890 | $9,995 | $11.23 | 25d | 1 | 0.08mi |
| 609 12th Ave S #609 Naples, FL | 2.0 | 2.0 | 860 | $8,000 | $9.30 | 25d | 1 | 0.12mi |
| 636 Broad Ave S Unit 1259386P Naples, FL | 2.0 | 2.0 | 882 | $4,307 | $4.88 | 15d | 1 | 0.12mi |
| 960 7th St S #103 Naples, FL | 1.0 | 1.0 | 534 | $5,000 | $9.36 | 25d | 1 | 0.26mi |
| 940 3rd St S Naples, FL | 1.0–2.0 | 1.0–2.0 | 870 | $3,995 | $4.59 | 25d | 2 | 0.32mi |
| 1295 Gulf Shore Blvd S #218 Naples, FL | 2.0 | 2.0 | 662 | $10,479 | $15.83 | 25d | 1 | 0.35mi |
| 351 8th Ave S #351 Naples, FL | 2.0 | 2.0 | 930 | $4,000 | $4.30 | 25d | 1 | 0.40mi |
| 291 8th Ave S Unit 291A Naples, FL | 1.0 | 1.0 | 550 | $3,900 | $7.09 | 25d | 1 | 0.43mi |
| 250 7th Ave S #301 Naples, FL | 2.0 | 2.0 | 1000 | $10,000 | $10.00 | 25d | 1 | 0.46mi |
| 666 3rd St S Naples, FL | 1.0–2.0 | 1.0–2.0 | 932 | $8,000 | $8.58 | 15d | 2 | 0.49mi |
| 950 7th Ave S #23 Naples, FL | 1.0 | 1.0 | 631 | $3,250 | $5.15 | 15d | 1 | 0.56mi |
| 980 7th Ave S Naples, FL | 1.0 | 1.0 | 540 | $7,500 | $13.89 | 25d | 2 | 0.57mi |
| 365 5th Ave S #303 Naples, FL | 2.0 | 2.0 | 1090 | $13,000 | $11.93 | 25d | 1 | 0.60mi |
| 1100 8th Ave S Naples, FL | 2.0 | 2.0 | 1218 | $9,000 | $7.39 | 15d | 5 | 0.62mi |
| 480 5th St S #102 Naples, FL | 1.0 | 1.0 | 600 | $6,500 | $10.83 | 25d | 1 | 0.62mi |
| 540 4th Ave S #13 Naples, FL | 1.0 | 1.0 | 580 | $5,000 | $8.62 | 25d | 1 | 0.62mi |
| 388 4th Ave S #388 Naples, FL | 2.0 | 2.0 | 965 | $13,000 | $13.47 | 25d | 1 | 0.65mi |
| 175 5th Ave S Naples, FL | 2.0 | 2.0 | 732 | $14,000 | $19.13 | 25d | 2 | 0.66mi |
| 296 4th Ave S #296 Naples, FL | 2.0 | 2.5 | 1120 | $2,950 | $2.63 | 23d | 1 | 0.67mi |
| 230 3rd Ave S #4 Naples, FL | 2.0 | 2.5 | 978 | $12,000 | $12.27 | 25d | 1 | 0.75mi |
| 290 4th St S #202 Naples, FL | 2.0 | 2.0 | 1058 | $10,000 | $9.45 | 25d | 1 | 0.76mi |
| 282 4th St S Naples, FL | 2.0 | 2.0 | 1058 | $11,000 | $10.40 | 25d | 1 | 0.76mi |
| 286 4th St S #203 Naples, FL | 2.0 | 2.0 | 1058 | $10,000 | $9.45 | 25d | 1 | 0.76mi |
| 284 4th St S #103 Naples, FL | 2.0 | 2.0 | 979 | $9,000 | $9.19 | 25d | 1 | 0.76mi |
| 1360 Chesapeake Ave Unit 1372 Naples, FL | 1.0 | 1.0 | 600 | $1,850 | $3.08 | 25d | 1 | 0.76mi |
| 805 River Point Dr Unit 307C Naples, FL | 1.0 | 1.0 | 816 | $2,700 | $3.31 | 25d | 1 | 0.79mi |
| 803 River Point Dr Unit 201B Naples, FL | 1.0 | 1.0 | 715 | $2,300 | $3.22 | 25d | 1 | 0.80mi |
| 1395 Curlew Ave Unit 4-3 Naples, FL | 2.0 | 2.0 | 975 | $7,000 | $7.18 | 25d | 1 | 0.82mi |
| 801 River Point Dr Unit 303A Naples, FL | 1.0 | 1.0 | 815 | $5,000 | $6.13 | 23d | 1 | 0.82mi |
| 1435 Curlew Ave #1 Naples, FL | 2.0 | 2.0 | 975 | $2,850 | $2.92 | 25d | 1 | 0.85mi |
| 1435 Curlew Ave #1 Naples, FL | 2.0 | 2.0 | 975 | $2,850 | $2.92 | 23d | 1 | 0.85mi |
| 1555 Blue Point Ave Unit 3 Naples, FL | 2.0 | 2.0 | 1025 | $1,745 | $1.70 | 15d | 1 | 0.88mi |
| 101 8th St S Naples, FL | 1.0 | 1.0–2.0 | 940 | $12,600 | $13.40 | 25d | 4 | 0.90mi |
| 101 8th St S Naples, FL | 1.0 | 1.0–2.0 | 940 | $12,600 | $13.40 | 15d | 4 | 0.90mi |
| 1535 Chesapeake Ave Unit A2 Naples, FL | 2.0 | 2.0 | 1080 | $2,000 | $1.85 | 25d | 1 | 0.91mi |
| 450 Bayfront Pl Naples, FL | 1.0–3.0 | 1.0–2.5 | 1324 | $8,750 | $6.61 | 25d | 6 | 0.92mi |
| 766 Central Ave Naples, FL | 2.0–3.0 | 2.0 | 855 | $6,300 | $7.37 | 23d | 3 | 0.94mi |
HOA detail condo
- Monthly dues
- $730 · $8,760/yr
- Likely covers
- pool
- Assessments
- None detected in remarks — confirm with the listing agent.
Listing history 23 events
-
2026-06-21days on market $560,000 Active 51 DOM
-
2026-06-18days on market $560,000 Active 48 DOM
-
2026-06-17days on market $560,000 Active 47 DOM
-
2026-06-16days on market $560,000 Active 46 DOM
-
2026-06-15days on market $560,000 Active 45 DOM
-
2026-06-14days on market $560,000 Active 43 DOM
-
2026-06-10days on market $560,000 Active 40 DOM
-
2026-06-09days on market $560,000 Active 39 DOM
-
2026-06-08days on market $560,000 Active 38 DOM
-
2026-06-07days on market $560,000 Active 37 DOM
-
2026-06-03days on market $560,000 Active 33 DOM
-
2026-06-02days on market $560,000 Active 32 DOM
-
2026-06-01days on market $560,000 Active 31 DOM
-
2026-05-31days on market $560,000 Active 30 DOM
-
2026-05-30days on market $560,000 Active 29 DOM
-
2026-05-01$560,000 Active
-
2026-01-01historical $2,600
-
2025-07-02$2,600
-
2011-04-18soldstatus $210,000 440-char remark
Show marketing remark (440 chars)
HERON CLUB BUYERS MAY NOW BE ANY AGE! NO 55+YRS LIMITATION LIKE OTHER VILLAGE GREEN CONDOS. LOVELY 2 BEDROOM, 2 BATH, FURNISHED, SECOND FLOOR CONDO WITH ELEVATOR. DETACHED CARPORT AND GUEST PARKING SPACES. LOCATED IN THE HEART OF OLDE NAPLES. ACROSS THE STREET FROM THE COMMUNITY POOL AND CLUBHOUSE. A GREAT BUY FOR BUYERS WHO WANT TO BE CLOSE TO THE BEACH, NAPLES PIER, 3RD STREET SHOPS AND RESTAURANTS. LOWEST PRICE UNIT IN THE BUILDING!
-
2011-04-18soldstatus $210,000
Show marketing remark (440 chars)
HERON CLUB BUYERS MAY NOW BE ANY AGE! NO 55+YRS LIMITATION LIKE OTHER VILLAGE GREEN CONDOS. LOVELY 2 BEDROOM, 2 BATH, FURNISHED, SECOND FLOOR CONDO WITH ELEVATOR. DETACHED CARPORT AND GUEST PARKING SPACES. LOCATED IN THE HEART OF OLDE NAPLES. ACROSS THE STREET FROM THE COMMUNITY POOL AND CLUBHOUSE. A GREAT BUY FOR BUYERS WHO WANT TO BE CLOSE TO THE BEACH, NAPLES PIER, 3RD STREET SHOPS AND RESTAURANTS. LOWEST PRICE UNIT IN THE BUILDING!
-
2010-09-17$225,000 440-char remark
Show marketing remark (440 chars)
HERON CLUB BUYERS MAY NOW BE ANY AGE! NO 55+YRS LIMITATION LIKE OTHER VILLAGE GREEN CONDOS. LOVELY 2 BEDROOM, 2 BATH, FURNISHED, SECOND FLOOR CONDO WITH ELEVATOR. DETACHED CARPORT AND GUEST PARKING SPACES. LOCATED IN THE HEART OF OLDE NAPLES. ACROSS THE STREET FROM THE COMMUNITY POOL AND CLUBHOUSE. A GREAT BUY FOR BUYERS WHO WANT TO BE CLOSE TO THE BEACH, NAPLES PIER, 3RD STREET SHOPS AND RESTAURANTS. LOWEST PRICE UNIT IN THE BUILDING!
-
2009-02-10$240,000
-
1998-05-19soldstatus $97,000
ⓘ Source: listings_history table (triggers on properties + properties_extension) + one-shot
backfill from property_details.listing_events for pre-trigger history.
Tax reassessment forecast FL · Resets to sale price
- Current annual tax
- $4,613 · $384/mo
- Projected year-2 tax
- $4,648 · $387/mo
- Expected delta
- +$35/yr (+$3/mo · 0.8%)
ⓘ Screening estimate from a state-policy table — verify with the county assessor before closing.
Climate risk First Street
- Flood 8/10 Severe FEMA zone AE · 99% chance over 30 yrs
- Wildfire 1/10 Low
- Heat 10/10 Extreme 7 d/yr ≥107°F today · 27 d/yr by 30 yrs out
- Wind 10/10 Extreme 99% chance of damaging wind over 30 yrs
- Air quality 3/10 Moderate 3 unhealthy d/yr today · 3 by 30 yrs out
Nearby sold comps map
Loading sold comps map…
Walkable amenities ~0.75 mi
Loading nearby amenities…
Taxation est. · year 1
- Rental income
- $61,209
- − Mortgage interest
- −$31,369
- − Property taxes
- −$4,613
- − Insurance
- −$7,918
- − Repairs & maintenance
- −$4,897
- − Management
- −$4,897
- − HOA
- −$8,760
- − Depreciation
- −$16,291
- Taxable loss
- −$17,536
- Est. tax savings @ 24.0%
- +$4,209
- After-tax cash flow
- $-3,968/yr
For passive investors: Depreciation is non-cash, so a rental often shows a tax loss while cash-flowing — sheltering income. Rental losses are passive: they offset passive income freely, and up to $25,000/yr can offset ordinary (W-2) income if you actively participate and your MAGI is under $100k (phasing out to $0 by $150k); unused losses carry forward. On sale, claimed depreciation is recaptured at up to 25%, and gains may owe capital-gains tax (a 1031 exchange can defer both). Figures are a year-1 estimate at your 24.0% rate — not tax advice; consult a CPA.
Schools (NCES district)
- District
- Collier
- NCES district ID
- 1200330
- Math proficiency
- 60% ▼ -4.00%
- Reading proficiency
- 56% ▼ -2.00%
- Median HH income
- $58,275
- Composite
- 50.23/100
- National rank
- #1892
- State rank
- #16 of 73 in FL
Livability — Naples
- Score
- 80/100
- State rank
- #126
- US rank
- #1903
Category grades
Schools grade is shown separately in the Schools card above.
Census & demographics
- Census place
- Naples, FL
- County
- Collier County · 396,295 people
- City population
- 344,941
- Metro
- Naples-Marco Island, FL
- Population (ZIP)
- 11,179
- Household income
- $130,929
- Rent vs Own
- Severe rent burden
- 333.0
Population outlook (Collier County) Hauer SSP2
- Today (2025)
- 420,858 people
- By 2030
- 450,054 · +6.9%
- By 2040
- 502,232 · +19.3%
- By 2050
- 544,932 · +29.5%
- By 2075
- 627,203 · +49.0%
- By 2100
- 659,015 · +56.6%
Race, ethnicity, and origin ACS 2023
- Neighborhood character
- Predominantly White (79%)
- Race & ethnicity
- White 79% Hispanic / Latino 9% Two or more races 8% Black 8% Asian 1%
- Hispanic origin (detail)
- Cuban 6%
- Common ancestry
- Hispanic 4% Lithuanian 4% Romanian 4%
- Foreign-born
- 17% · Canada, China
- Languages at home
- 87% English-only · Spanish 7% French/Haitian/Cajun 4% German/W. Germanic 1%
Political lean MEDSL · Collier
- 2024 margin
- Solid R (+33.1) · D 33.1% · R 66.2%
- 2008→2024 swing
- -10.6pp toward R · 2008: -22.5pp · 2024: -33.1pp
- All cycles
- 2024: R+33.1 2020: R+24.7 2016: R+26.0 2012: R+30.1 2008: R+22.5
Not yet ingested
- Civics
- —
Market trends
- HPI YoY
- ▲ 4.08%
- Current HPI
- 328.2755
- Rent YoY
- ▲ 8.75%
- Metro
- Naples-Marco Island, FL
- State GDP YoY
- ▲ 3.28%
- F500 in state
- 36
Industry mix (Fortune 500 HQ in FL)
| Industry | F500 HQs | Revenue |
|---|---|---|
| Industrial Technology | 2 | $29B |
|
||
| Insurance | 2 | $17B |
|
||
| Retail | 1 | $60B |
|
||
| Technology Distribution | 1 | $58B |
|
||
| Homebuilding | 1 | $35B |
|
||
| Technology Manufacturing | 1 | $35B |
|
||
Price history
+477.3% since first listed8 events — show timeline
- 2026-05-01 Listed $560,000 NAPLESMLS
- 2026-01-01 Rental Removed $2,600 NAPLESMLS
- 2025-07-02 Listed for Rent $2,600 NAPLESMLS
- 2011-04-18 Sold (Public Records) $210,000 Public Records
- 2011-04-18 Sold (MLS) $210,000 NAPLESMLS
- 2010-09-17 Listed $225,000 NAPLESMLS
- 2009-02-10 Listed $240,000 NAPLESMLS
- 1998-05-19 Sold (Public Records) $97,000 Public Records
Property tax history
+9.4%/yrLatest (2025): $4,613 · -3.5% YoY. Source: county tax records.
Cash-flow waterfall
monthlySold comps — $/sqft
last 12 mo · ≤1 miLoading sold comps…