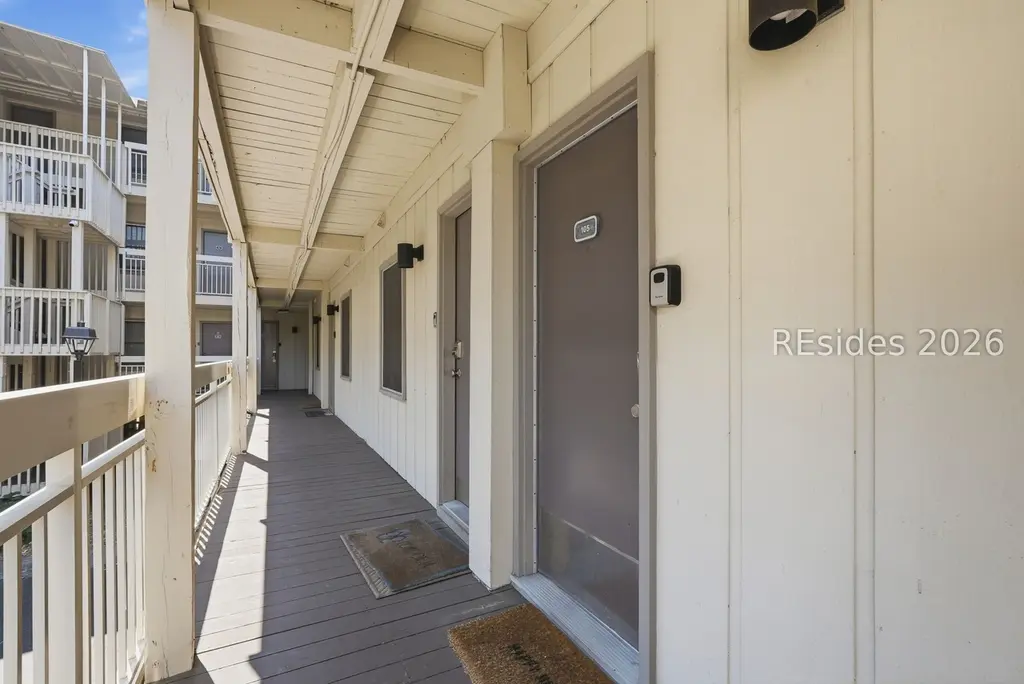
4 N Forest Beach Dr #105 · Hilton Head Island, SC
Flood risk No data
- FEMA flood zone
- —
- Chance of flooding over 30 yrs
- —
- Est. flood insurance / yr
- —
Fire risk No data
- Est. fire insurance / yr
- —
Heat risk No data
- Hot days now (above threshold)
- —
- Hot days in 30 yrs
- —
Wind risk No data
- Chance of severe wind over 30 yrs
- —
Air-quality risk No data
- Unhealthy air days now
- —
- Unhealthy air days in 30 yrs
- —
Risk factors via First Street. Map © Google.
Why this score? — see what drove the C- grade
The composite is a weighted blend of 9 inputs, each scored 0–100. Each bar is that input's sub-score; the figure is the points it added to the 100-point composite (weight × sub-score).
- ARV discount +15.0/15.0
- Cash flow +10.7/30.0
- Appreciation +6.6/10.0
- 1% rule +4.6/10.0
- Schools +4.1/10.0
- Rent growth +3.3/5.0
- Livability +3.2/5.0
- DSCR +3.1/10.0
- Condition / age +2.5/5.0
$359,000
🖨 Deal sheet 📄 Offer letter ✓ Due diligence
Listing remarks MLS
Beautifully renovated condo on the beach. Close to Coligny Plaza, restaurants, shopping. Granite countertops, Newer cabinets, appliances, LVP flooring, and turn-key furnishings. HVAC system replaced in 2021. Elevators newly installed in the complex. Peek-a-boo view of ocean. Home Warranty included. Great rental income!
Key facts
- Community pool
- Built 1979
- Listed 49 days
Property features AI
Finance
- Other: Pets not allowed
- HOA & community: HOA covers association management, common areas, grounds maintenance, structure maintenance, pest control, sewer, trash and water; Community amenities include beach access/rights, elevator(s), playground, pool and trails
Exterior
- Parking: Unassigned parking
- Security: Security guard
- Utilities: Public water
- Home design: Condominium / multi-story (unit in a building)
- Construction: Built with wood siding; Asphalt roof
- Exterior features: Patio; Has view; Community pool with solar heating
Interior
- Kitchen: Dishwasher; Microwave; Stove
- Flooring: Tile
- Bathrooms: 1 full bathroom
- Heating & cooling: Electric heating; Electric cooling; Heat pump
- Interior features: Furnished; Main level primary; Cable TV; Tile flooring; Family room
- Laundry & utility: Washer; Dryer
Neighborhood map
What this means for you Summary
Snapshot
- This is a 1-bed/1.0-bath condo listed at $359k.
Deal economics
- At list price, monthly cash flow is $-173 ($-2k/yr) — negative.
- The deal already cash-flows at list — no discount required.
- To meet the 1% rule (rent ≥ 1% of price), the offer needs to be $344k (4.3% below list).
- Recommended offer: $344k (4.3% below list) — sets the bar for 1% rule.
- Cap rate 5.7% vs local median 3.0% in Hilton Head Island — top-decile yield for the area; either an underpriced asset or a hidden risk that comps aren't pricing in. Stress-test before assuming the spread holds.
Location & tenants
- Location reads 64/100 on livability (#157 in SC) — a middle-class / working-renter tenant base. Strengths: employment A+, crime A-; Watch: amenities F, commute F, cost of living F.
- Beaufort 01 (town): math 42% / reading 51% proficiency, ranked #17 of 80 in SC (top 21%) — families likely to look elsewhere, expect single-tenant / working-renter base with shorter leases.
- Market conditions: Rents rising (+3.2%/yr); 838 active listings in the ZIP; 4 comparable units currently listed for rent nearby; rentals at typical pace (median 21d on market — plan ~3-4 weeks tenant-placement turnaround); solid renter incomes; 1,824 units permitted in Beaufort County in 2024 (618 in 5+ unit buildings).
- This rent runs 42% of the median local income ($98k/yr) — at the standard rent-burdened threshold; future hikes will face affordability resistance.
Forward outlook
- In year one you build about $14k of equity ($2k loan paydown + $12k appreciation (3.2% local appreciation)).
- Beaufort County population projected at +30% by 2050 — long-run rental-demand tailwind backs the buy-and-hold thesis.
- By year 3, paydown + projected appreciation supports a ~$35k cash-out refi (75% LTV) — recoverable capital for the next deal without selling this one.
Negotiation context
- It's been on market 49 days — a 3% lower offer ($348k) is reasonable based on typical stale-listing flexibility.
- 6 sale attempts since 12y ago with the ask held roughly flat each time — persistent listings suggest the price (not the market) is what's stuck; bring a comps-based counter.
Questions for the listing agent
- What do current leases actually rent for vs. the listed asking? Can we see a recent rent roll and the last 12 months of T-12 income?
- It's been on market 49 days. Have you received any prior offers? Is the seller open to a 4% concession, seller financing, or rate buy-down credit?
- Built in 1979 — when were the roof, HVAC, electrical panel, plumbing, and water heater last replaced?
- What does the HOA fee cover, when was the last increase, and are there any pending special assessments or reserve-fund shortfalls?
- Any open or pending special assessments — roof, HVAC, plumbing, elevator, façade? What's the per-unit balance and payoff schedule, and is the seller paying it off at close or rolling it to the buyer?
- Is there a deadline driving the sale (1031 exchange, divorce, estate, relocation)? That informs how much negotiation room exists.
- Schools are B-rated — typically a magnet for longer-tenancy family renters. What's the average tenant stay here, and is there a school-zone premium baked into asking?
- What's the average days-on-market for RENTAL listings here right now (not sales)? A rising rental-DOM trend means longer vacancies and softer asking-rent achievability than the comps imply.
- What's the recent tenant-quality profile in this submarket — average credit score on applications, eviction rate, late-payment / NSF rate, and stable-employment percentage? A property-management company in the area should have these aggregated.
- How much new apartment / multifamily construction is in the pipeline within 1–3 miles? Heavy new supply (>2% of stock underway) typically softens rents 12–24 months out; light construction supports rent growth.
Investment metrics
- 1% rule
- 0.96% ✗
- Cap rate
- 5.71%
- Cash-on-cash
- -2.07%
- DSCR
- 0.91
- GRM
- 8.7
CMA / ARV
- ARV (median comp)
- $453,995
- List price
- $359,000
- Delta
- -20.92%
- Verdict
- UNDERPRICED
- Comps
- 20 within 1.0 mi
Projected returns pro-forma
3.21% appreciation · 3.23% rent growth · sell at horizon
- IRR
- 6.4%
- Equity multiple
- 1.37×
- Total profit
- $37,266
- Equity at exit
- $165,631
- IRR
- 9.3%
- Equity multiple
- 2.44×
- Total profit
- $144,880
- Equity at exit
- $258,579
Cash invested: $100,520 (down + closing). Projections, not guarantees.
Landlord ↔ Tenant lean methodology
- Overall (STATE)
- 90 Strongly Landlord-Friendly
- State South Carolina
- 90 Strongly Landlord-Friendly · R+6
- County
- — inherits STATE
- City
- — inherits STATE
ZIP-level market 29928
- Home prices YoY
- 1.3%
- Rents YoY
- 3.2%
- Active inventory
- 838
- Price-to-rent
- 8.7×
Monthly cashflow live
- Estimated rent
- $3,437 medium interval (Pro) →
- Mortgage (P&I)
- −$1,883
- Tax from tax record
- −$306 /mo · $3,671/yr
- Insurance
- −$150
- HOA est. from 15 same-building comps
- −$550
- Vacancy / Maint / Mgmt
- −$722
- Net cashflow
- $-173
Break-even live
UW: 25.0% down · 7.5% · 30yr · 1.5% tax · 5.0% vac · 8.0% maint · 8.0% mgmt
Financing live
Cash to close
- Down payment
- $89,750
- Closing costs
- $10,770
- Reserves months
- —
- Total cash needed
- —
Loan-product check · same deal, 3 products live
Conventional
25% down · 7.5% · 30yr
- Down + closing
- —
- Monthly P&I
- —
- Monthly cashflow
- —
- DSCR
- —
- Eligible?
- —
Personal DTI + credit; lowest rate.
DSCR
20% down · 8.5% · 30yr
- Down + closing
- —
- Monthly P&I
- —
- Monthly cashflow
- —
- DSCR
- —
- Eligible?
- —
No personal income docs; deal must DSCR.
Hard money
10% down · 12.0% · 12mo
- Down + closing
- —
- Monthly P&I
- —
- Monthly cashflow
- —
- DSCR
- —
- Eligible?
- —
Short-term bridge; refi at stabilization.
Rent comps 4 comps
| Address | Beds | Baths | Sqft | Rent | $/sqft | DOM | Units | Dist |
|---|---|---|---|---|---|---|---|---|
| 4 N Forest Beach Dr Unit 1436439P Hilton Head Island, SC | 1.0 | 1.0 | 516 | $4,092 | $7.93 | 44d | 1 | 0.03mi |
| 21 Lagoon Rd Unit 1508866P Hilton Head Island, SC | 2.0 | 2.0 | 742 | $2,687 | $3.62 | 13d | 1 | 0.25mi |
| 23 S Forest Beach Dr Unit 1316238P Hilton Head Island, SC | 1.0 | 1.0 | 645 | $3,185 | $4.94 | 21d | 1 | 0.40mi |
| 10 Lemoyne Ave Hilton Head Island, SC | 1.0 | 1.0 | 500 | $1,700 | $3.40 | 13d | 1 | 0.62mi |
HOA detail condo
- Monthly dues
- $0 · $0/yr
- Assessments
- None detected in remarks — confirm with the listing agent.
Listing history 33 events
-
2026-06-18days on market $359,000 Active 49 DOM
-
2026-06-17days on market $359,000 Active 48 DOM
-
2026-06-16days on market $359,000 Active 47 DOM
-
2026-06-15days on market $359,000 Active 46 DOM
-
2026-06-14days on market $359,000 Active 44 DOM
-
2026-06-13days on market $359,000 Active 43 DOM
-
2026-06-10days on market $359,000 Active 41 DOM
-
2026-06-09days on market $359,000 Active 40 DOM
-
2026-06-08days on market $359,000 Active 39 DOM
-
2026-06-07days on market $359,000 Active 38 DOM
-
2026-06-05days on market $359,000 Active 35 DOM
-
2026-06-03days on market $359,000 Active 34 DOM
-
2026-06-02days on market $359,000 Active 33 DOM
-
2026-06-01days on market $359,000 Active 32 DOM
-
2026-05-31days on market $359,000 Active 31 DOM
-
2026-04-30$359,000 Active 656-char remark
-
2026-04-27$359,000 Active
-
2022-09-01soldstatus $409,000 Closed
Show marketing remark (320 chars)
Beautifully renovated condo on the beach. Close to Coligny Plaza, restaurants, shopping. Granite countertops, Newer cabinets, appliances, LVP flooring, and turn-key furnishings. HVAC system replaced in 2021. Elevators newly installed in the complex. Peek-a-boo view of ocean. Home Warranty included. Great rental income!
-
2022-08-10soldstatus $409,000
-
2022-06-14historical
Show marketing remark (320 chars)
Beautifully renovated condo on the beach. Close to Coligny Plaza, restaurants, shopping. Granite countertops, Newer cabinets, appliances, LVP flooring, and turn-key furnishings. HVAC system replaced in 2021. Elevators newly installed in the complex. Peek-a-boo view of ocean. Home Warranty included. Great rental income!
-
2022-06-08$409,000
Show marketing remark (320 chars)
Beautifully renovated condo on the beach. Close to Coligny Plaza, restaurants, shopping. Granite countertops, Newer cabinets, appliances, LVP flooring, and turn-key furnishings. HVAC system replaced in 2021. Elevators newly installed in the complex. Peek-a-boo view of ocean. Home Warranty included. Great rental income!
-
2020-07-30soldstatus $210,000
-
2020-07-22soldstatus $210,000
-
2020-01-09$219,000
-
2019-03-01soldstatus $208,000
-
2018-10-25$215,000
-
2015-08-21soldstatus $123,000
-
2015-08-18soldstatus $123,000
-
2014-03-15$129,900
-
1991-04-18soldstatus $47,500
-
1982-05-01soldstatus $60,000
-
1982-05-01soldstatus $60,000
-
1979-09-01soldstatus $48,900
ⓘ Source: listings_history table (triggers on properties + properties_extension) + one-shot
backfill from property_details.listing_events for pre-trigger history.
Tax reassessment forecast SC · Resets to sale price
- Current annual tax
- $3,671 · $306/mo
- Projected year-2 tax
- $3,671 · $306/mo
- Expected delta
- $0/yr ($0/mo · -0.0%)
ⓘ Screening estimate from a state-policy table — verify with the county assessor before closing.
Nearby sold comps map
Loading sold comps map…
Walkable amenities ~0.75 mi
Loading nearby amenities…
Taxation est. · year 1
- Rental income
- $41,239
- − Mortgage interest
- −$20,110
- − Property taxes
- −$3,671
- − Insurance
- −$1,795
- − Repairs & maintenance
- −$3,299
- − Management
- −$3,299
- − HOA
- −$6,600
- − Depreciation
- −$10,444
- Taxable loss
- −$7,979
- Est. tax savings @ 24.0%
- +$1,915
- After-tax cash flow
- $-164/yr
For passive investors: Depreciation is non-cash, so a rental often shows a tax loss while cash-flowing — sheltering income. Rental losses are passive: they offset passive income freely, and up to $25,000/yr can offset ordinary (W-2) income if you actively participate and your MAGI is under $100k (phasing out to $0 by $150k); unused losses carry forward. On sale, claimed depreciation is recaptured at up to 25%, and gains may owe capital-gains tax (a 1031 exchange can defer both). Figures are a year-1 estimate at your 24.0% rate — not tax advice; consult a CPA.
Schools (NCES district)
- District
- Beaufort 01
- NCES district ID
- 4501110
- Math proficiency
- 42% ▼ -8.00%
- Reading proficiency
- 51% ▲ 2.00%
- Median HH income
- $57,430
- Composite
- 40.56/100
- National rank
- #3699
- State rank
- #17 of 80 in SC
Livability — Hilton Head Island
- Score
- 64/100
- State rank
- #157
- US rank
- #14648
Category grades
Schools grade is shown separately in the Schools card above.
Census & demographics
- Census place
- Hilton Head Island, SC
- County
- Beaufort County · 163,770 people
- City population
- 40,243
- Metro
- Hilton Head Island-Bluffton, SC
- Population (ZIP)
- 15,785
- Household income
- $97,576
- Rent vs Own
- Severe rent burden
- 216.0
Population outlook (Beaufort County) Hauer SSP2
- Today (2025)
- 211,915 people
- By 2030
- 227,272 · +7.2%
- By 2040
- 253,861 · +19.8%
- By 2050
- 275,126 · +29.8%
- By 2075
- 311,022 · +46.8%
- By 2100
- 321,286 · +51.6%
Race, ethnicity, and origin ACS 2023
- Neighborhood character
- Predominantly White (87%)
- Race & ethnicity
- White 87% Hispanic / Latino 6% Two or more races 2% Black 2% Asian 1%
- Hispanic origin (detail)
- Mexican 3%
- Common ancestry
- Lithuanian 4% Slovak 4% Romanian 4%
- Foreign-born
- 9% · Canada, China
- Languages at home
- 91% English-only · Spanish 5% French/Haitian/Cajun 1% Chinese 1%
Political lean MEDSL · Beaufort
- 2024 margin
- R (+14.5) · D 42.1% · R 56.6% · Other 1.2%
- 2008→2024 swing
- -3.7pp toward R · 2008: -10.8pp · 2024: -14.5pp
- All cycles
- 2024: R+14.5 2020: R+10.0 2016: R+14.3 2012: R+17.5 2008: R+10.8
Not yet ingested
- Civics
- —
Market trends
- HPI YoY
- ▲ 3.21%
- Current HPI
- 243.4136
- Rent YoY
- ▲ 3.23%
- Metro
- Hilton Head Island-Bluffton, SC
- State GDP YoY
- ▲ 4.51%
- F500 in state
- 2
Industry mix (Fortune 500 HQ in SC)
| Industry | F500 HQs | Revenue |
|---|---|---|
| Packaging | 1 | $7B |
|
||
Price history
+634.2% since first listed18 events — show timeline
- 2026-04-30 Listed $359,000 RSMLS
- 2026-04-27 Listed $359,000 RSMLS
- 2022-09-01 Sold (MLS) $409,000 RSMLS
- 2022-08-10 Sold (Public Records) $409,000 Public Records
- 2022-06-14 Delisted — RSMLS
- 2022-06-08 Listed $409,000 RSMLS
- 2020-07-30 Sold (Public Records) $210,000 Public Records
- 2020-07-22 Sold (MLS) $210,000 RSMLS
- 2020-01-09 Listed $219,000 RSMLS
- 2019-03-01 Sold (MLS) $208,000 RSMLS
- 2018-10-25 Listed $215,000 RSMLS
- 2015-08-21 Sold (Public Records) $123,000 Public Records
- 2015-08-18 Sold (MLS) $123,000 RSMLS
- 2014-03-15 Listed $129,900 RSMLS
- 1991-04-18 Sold (Public Records) $47,500 Public Records
- 1982-05-01 Sold (Public Records) $60,000 Public Records
- 1982-05-01 Sold (Public Records) $60,000 Public Records
- 1979-09-01 Sold (Public Records) $48,900 Public Records
Property tax history
+5.5%/yrLatest (2025): $3,671 · +1.1% YoY. Source: county tax records.
Cash-flow waterfall
monthlySold comps — $/sqft
last 12 mo · ≤1 miLoading sold comps…