 Duplex
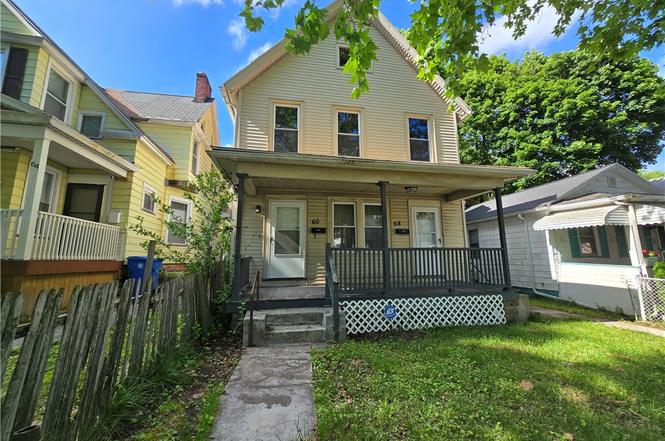
58 Champlain St · Rochester, NY
Flood risk 1/10 · Minimal
- FEMA flood zone
- X (unshaded)
- Chance of flooding over 30 yrs
- 0.0%
- Est. flood insurance / yr
- $473 – $860
Fire risk 1/10 · Minimal
- Est. fire insurance / yr
- $691 – $1,283
Heat risk 2/10 · Minimal
- Hot days now (above 96°F)
- 7 days/yr
- Hot days in 30 yrs
- 15 days/yr
Wind risk 1/10 · Minimal
- Chance of severe wind over 30 yrs
- —
Air-quality risk 2/10 · Minimal
- Unhealthy air days now
- 1 days/yr
- Unhealthy air days in 30 yrs
- 1 days/yr
Risk factors via First Street. Map © Google.
Why this score? — see what drove the C- grade
The composite is a weighted blend of 9 inputs, each scored 0–100. Each bar is that input's sub-score; the figure is the points it added to the 100-point composite (weight × sub-score).
- Cash flow +15.0/30.0
- ARV discount +7.5/15.0
- Appreciation +6.8/10.0
- 1% rule +5.0/10.0
- DSCR +5.0/10.0
- Rent growth +4.2/5.0
- Livability +3.8/5.0
- Condition / age +3.8/5.0
- Schools +1.9/10.0
$74,900
🖨 Deal sheet 📄 Offer letter ✓ Due diligence
Multi-family units
County records classify this as Multi-Family (2-4 Unit). Listing-text estimate: 2 units. confirmed
Listing remarks
Outstanding opportunity for investors or owner-occupants! This well-maintained two-family home offers excellent income potential with a projected gross annual rental income of $22,800. Each spacious unit features 3 bedrooms and 1 full bath, making it ideal for tenants or multi-generational living. Major improvements include a newer architectural roof, thermopane windows and exterior doors, high-efficiency furnaces, hot water tanks, and updated electrical panel boxes. The exterior features low-maintenance vinyl siding, a welcoming front porch, a partially fenced backyard, and a 1.5-car detached garage. Whether you're looking to generate rental income or offset your mortgage by living in one
Key facts
- Two-family home
- Thermopane windows
- 4,687 sq ft lot
Tags
Property features AI
Finance
- Financial info: Two-unit property with separate gas and electric meters; Gross annual income reported: $22,800; Operating expenses reported: $650 (includes water/sewer); Owner pays cable TV and water; rent includes cable TV and water; Typical rent per unit reported: $950
Exterior
- Parking: Garage (paved); Approximately 1.5 garage spaces
- Security: Leased security system
- Utilities: Electricity available and connected (circuit breakers); Public water connected; Sewer connected; Cable available
- Home design: 2-story multi-family property; Resale condition
- Construction: Vinyl siding; Copper plumbing; Asphalt shingle roof; Stone foundation; Existing (previously built) structure
- Exterior features: Partial fencing; Open porch; Near public transit; Rectangular residential lot; City street frontage
Interior
- Kitchen: Eat-in kitchen in each unit
- Bedrooms: Two separate 3-bedroom units (each unit has 3 bedrooms)
- Flooring: Carpet, hardwood, laminate, vinyl (varies by area)
- Bathrooms: Two full bathrooms total (one full bathroom per unit)
- Heating & cooling: Gas forced-air heating
- Interior features: Ceiling fans; Window treatments; Drapes, storm windows, thermal windows with wood frames
- Laundry & utility: Gas water heater
Neighborhood map
What this means for you Summary
Snapshot
- This is a 2 × 3-bed/1.0-bath units multifamily listed at $75k. Condition is rated good.
Deal economics
- At list price, monthly cash flow is $2k ($28k/yr) — positive. Per door: $1k/mo.
- The deal already cash-flows at list — no discount required.
- Meets the 1% rule at list price ($4k rent vs $75k).
- Cap rate 43.7% vs local median 9.3% in Rochester — top-decile yield for the area; either an underpriced asset or a hidden risk that comps aren't pricing in. Stress-test before assuming the spread holds.
Location & tenants
- Location reads 76/100 on livability (#222 in NY, #3,482 nationally) — a middle-class / working-renter tenant base. Strengths: commute A+, cost of living A+, housing A+; Watch: schools D+, crime F, employment F.
- Rochester City School District (urban): math 21% / reading 26% proficiency, ranked #589 of 590 in NY (top 100%) — low school quality limits family demand, transient renter base, plan for 1-2y turnover; 82% free/reduced lunch — lower-income household profile, screen leases tightly.
- Market conditions: Rents rising fast (+6.6%/yr); 51 active listings in the ZIP; 1 comparable units currently listed for rent nearby; lower-income renter base — watch delinquency; 1,169 units permitted in Monroe County in 2024 (591 in 5+ unit buildings).
- At $3,608/mo this rent would consume 107% of the median local household income ($41k/yr) (locally 1300% of renters already pay >50% of income on rent) — very limited rent-growth headroom before tenants either downsize or default.
Forward outlook
- In year one you build about $3k of equity ($518 loan paydown + $3k appreciation (3.7% local appreciation)).
- Monroe County population projected to shrink 6% by 2050 — rents likely to lag national; underwrite the cash flow, not the appreciation.
- At projected returns (3.7% appreciation + 6.6% rent growth), your $21k cash investment doubles in ~1 year — after that, you're playing with house money.
- By year 10, paydown + projected appreciation supports a ~$32k cash-out refi (75% LTV) — recoverable capital for the next deal without selling this one.
Negotiation context
- Only 7 days on market — expect competitive offers; lowballing is unlikely to land.
Risks & watch-outs
- Watch-outs: built in 1910 — expect roof / HVAC / electrical / plumbing capex.
Questions for the listing agent
- Can we see the unit-by-unit rent roll, current vacancy, and any below-market leases? What's the average tenancy length?
- What capital expenditures (roof, boiler, parking lot, exteriors) have been made in the last 5 years, and what's planned in the next 2?
- Built in 1910 — when were the roof, HVAC, electrical panel, plumbing, and water heater last replaced?
- Is there a deadline driving the sale (1031 exchange, divorce, estate, relocation)? That informs how much negotiation room exists.
- Schools are D-rated, which usually means shorter tenancies and higher turnover. Who's the typical renter profile here, and what's been the actual vacancy rate?
- Crime grade is F in this area — have there been break-ins, vandalism, or insurance claims at this property in the last 3 years? What carrier currently insures it and at what premium?
- What's the average days-on-market for RENTAL listings here right now (not sales)? A rising rental-DOM trend means longer vacancies and softer asking-rent achievability than the comps imply.
- What's the recent tenant-quality profile in this submarket — average credit score on applications, eviction rate, late-payment / NSF rate, and stable-employment percentage? A property-management company in the area should have these aggregated.
- How much new apartment / multifamily construction is in the pipeline within 1–3 miles? Heavy new supply (>2% of stock underway) typically softens rents 12–24 months out; light construction supports rent growth.
Investment metrics
- 1% rule
- 4.82% ✓
- Cap rate
- 43.67%
- Cash-on-cash
- 133.48%
- DSCR
- 6.94
- GRM
- 1.7
CMA / ARV
- ARV (on-the-fly)
- $152,586
- Comps found
- 12
Show comp detail 12 sales within ~0.75 mi
| Address | Dist | Beds/Ba | Sqft | Sold | Price | $/sf | Match |
|---|---|---|---|---|---|---|---|
| 363 Flint St | 0.54mi | 6/2.0 | 2,394 (-1%) | 3mo | $77,000 | $32 | 70 |
| 268 Champlain St | 0.30mi | 6/2.0 | 2,232 (-8%) | 10mo | $130,000 | $58 | 64 |
| 21 Arnett Blvd | 0.63mi | 5/2.0 (-1) | 2,322 (-4%) | 5mo | $79,777 | $34 | 54 |
| 355 Champlain St #353 | 0.43mi | 7/2.0 (+1) | 2,216 (-8%) | 10mo | $140,000 | $63 | 53 |
| 87 Sanford St | 0.62mi | 5/3.0 (-1) | 2,507 (+4%) | 12mo | $305,000 | $122 | 46 |
| 122-124 Shelter St #2 | 0.69mi | 5/2.0 (-1) | 2,640 (+9%) | 2mo | $85,000 | $32 | 46 |
| 537 Flint St | 0.74mi | 6/4.0 | 2,505 (+3%) | 13mo | $160,000 | $64 | 41 |
| 410 Genesee St | 0.75mi | 6/2.0 | 2,170 (-10%) | 8mo | $152,000 | $70 | 41 |
| 290 Frost Ave | 0.27mi | 5/2.0 (-1) | 2,764 (+14%) | 22mo | $85,000 | $31 | 40 |
| 31 Sanford St #29 | 0.55mi | 5/3.0 (-1) | 2,248 (-7%) | 20mo | $275,000 | $122 | 37 |
| 101 Jefferson Ave | 0.69mi | 5/2.0 (-1) | 2,258 (-7%) | 18mo | $85,000 | $38 | 36 |
| 20 Madison St | 0.65mi | 5/3.0 (-1) | 2,778 (+15%) | 3mo | $175,000 | $63 | 34 |
Match score weights: distance 35% · size 25% · config 20% · recency 20%. Top-matched comps best support the ARV.
Projected returns pro-forma
3.69% appreciation · 6.61% rent growth · sell at horizon
- IRR
- —
- Equity multiple
- 9.30×
- Total profit
- $174,003
- Equity at exit
- $36,630
- IRR
- —
- Equity multiple
- 21.57×
- Total profit
- $431,476
- Equity at exit
- $58,863
Cash invested: $20,972 (down + closing). Projections, not guarantees.
Landlord ↔ Tenant lean methodology
- Overall (STATE)
- 15 Strongly Tenant-Friendly
- State New York
- 15 Strongly Tenant-Friendly · D+10
- County
- — inherits STATE
- City
- — inherits STATE
ZIP-level market 14608
- Home prices YoY
- 1.3%
- Rents YoY
- 6.6%
- Active inventory
- 51
- Price-to-rent
- 3.5×
Monthly cashflow live
- Estimated rent
- $3,608 high interval (Pro) →
- Mortgage (P&I)
- −$393
- Tax est. 1.5%
- −$94 /mo · $1,124/yr
- Insurance
- −$31
- HOA
- −$0
- Vacancy / Maint / Mgmt
- −$758
- Net cashflow
- $2,333
Break-even live
2-unit breakdown (identical units grouped — click to expand)
| Units | Beds | Baths | Est. rent |
|---|---|---|---|
| 2× units | 3 | 1 | $3,608 |
| #1 | 3 | 1 | $1,804 |
| #2 | 3 | 1 | $1,804 |
| Total (2 units) | $3,608 | ||
UW: 25.0% down · 7.5% · 30yr · 1.5% tax · 5.0% vac · 8.0% maint · 8.0% mgmt
Financing live
Cash to close
- Down payment
- $18,725
- Closing costs
- $2,247
- Reserves months
- —
- Total cash needed
- —
Loan-product check · same deal, 3 products live
Conventional
25% down · 7.5% · 30yr
- Down + closing
- —
- Monthly P&I
- —
- Monthly cashflow
- —
- DSCR
- —
- Eligible?
- —
Personal DTI + credit; lowest rate.
DSCR
20% down · 8.5% · 30yr
- Down + closing
- —
- Monthly P&I
- —
- Monthly cashflow
- —
- DSCR
- —
- Eligible?
- —
No personal income docs; deal must DSCR.
Hard money
10% down · 12.0% · 12mo
- Down + closing
- —
- Monthly P&I
- —
- Monthly cashflow
- —
- DSCR
- —
- Eligible?
- —
Short-term bridge; refi at stabilization.
Rent comps 1 comps
| Address | Beds | Baths | Sqft | Rent | $/sqft | DOM | Units | Dist |
|---|---|---|---|---|---|---|---|---|
| 649 Jay St Rochester, NY | 5.0 | 2.0 | 2144 | $2,000 | $0.93 | 3d | 1 | 1.27mi |
Listing history 7 events
-
2026-06-18days on market $74,900 Active 7 DOM
-
2026-06-17days on market $74,900 Active 6 DOM
-
2026-06-16days on market $74,900 Active 5 DOM
-
2026-06-15days on market $74,900 Active 4 DOM
-
2026-06-13days on market $74,900 Active 2 DOM
-
2026-06-13remarks 699-char remark
-
2026-06-13$74,900 Active 1 DOM
ⓘ Source: listings_history table (triggers on properties + properties_extension) + one-shot
backfill from property_details.listing_events for pre-trigger history.
Climate risk First Street
- Flood 1/10 Low FEMA zone X (unshaded) · 0% chance over 30 yrs
- Wildfire 1/10 Low
- Heat 2/10 Low 7 d/yr ≥96°F today · 15 d/yr by 30 yrs out
- Wind 1/10 Low
- Air quality 2/10 Low 1 unhealthy d/yr today · 1 by 30 yrs out
Nearby sold comps map
Loading sold comps map…
Walkable amenities ~0.75 mi
Loading nearby amenities…
Taxation est. · year 1
- Rental income
- $43,296
- − Mortgage interest
- −$4,196
- − Property taxes
- −$1,124
- − Insurance
- −$374
- − Repairs & maintenance
- −$3,464
- − Management
- −$3,464
- − Depreciation
- −$2,179
- Taxable income
- $28,496
- Est. tax owed @ 24.0%
- −$6,839
- After-tax cash flow
- $21,153/yr
For passive investors: Depreciation is non-cash, so a rental often shows a tax loss while cash-flowing — sheltering income. Rental losses are passive: they offset passive income freely, and up to $25,000/yr can offset ordinary (W-2) income if you actively participate and your MAGI is under $100k (phasing out to $0 by $150k); unused losses carry forward. On sale, claimed depreciation is recaptured at up to 25%, and gains may owe capital-gains tax (a 1031 exchange can defer both). Figures are a year-1 estimate at your 24.0% rate — not tax advice; consult a CPA.
Condition & rehab AI · 1 photo
This well-maintained two-family home offers excellent income potential with a projected gross annual rental income of $22,800. The property features newer architectural roof, thermopane windows, and high-efficiency furnaces, making it ideal for investors or owner-occupants.
Value-add opportunities
- Both Landscaping improvements — Enhances curb appeal and rental value
- Both Painting exterior — Fresh paint improves curb appeal and rental value
- Both Landscaping and curb appeal — Enhances curb appeal and rental value
Renovation cost estimate screening
Value-add ROI direction
- Both Landscaping improvements — Enhances curb appeal and rental value ↑
- Both Painting exterior — Fresh paint improves curb appeal and rental value ↑
- Both Landscaping and curb appeal — Enhances curb appeal and rental value ↑
ⓘ Cost ranges are severity-bucket heuristics (US national rule-of-thumb). Get contractor quotes + a written scope before underwriting a rehab budget.
Schools (NCES district)
- District
- Rochester City School District
- NCES district ID
- 3624750
- Math proficiency
- 21% ▬ 0.00%
- Reading proficiency
- 26% ▲ 4.00%
- Median HH income
- $30,923
- Composite
- 18.98/100
- National rank
- #8850
- State rank
- #589 of 590 in NY
Livability — Rochester
- Score
- 76/100
- State rank
- #222
- US rank
- #3482
Category grades
Schools grade is shown separately in the Schools card above.
Census & demographics
- Census place
- Rochester, NY
- County
- Monroe County · 674,131 people
- City population
- 432,803
- Metro
- Rochester, NY
- Population (ZIP)
- 12,792
- Household income
- $40,646
- Rent vs Own
- Severe rent burden
- 1300.0
Population outlook (Monroe County) Hauer SSP2
- Today (2025)
- 759,460 people
- By 2030
- 757,154 · -0.3%
- By 2040
- 740,644 · -2.5%
- By 2050
- 714,443 · -5.9%
- By 2075
- 645,883 · -15.0%
- By 2100
- 547,084 · -28.0%
Race, ethnicity, and origin ACS 2023
- Neighborhood character
- Diverse neighborhood (Simpson 0.67)
- Race & ethnicity
- Black 50% White 25% Two or more races 13% Hispanic / Latino 12% Asian 4%
- Hispanic origin (detail)
- Puerto Rican 10%
- Common ancestry
- Lithuanian 1% Romanian 1% Iranian 1%
- Foreign-born
- 8% · Canada, India
- Languages at home
- 85% English-only · Spanish 8% Other Indo-European 3% French/Haitian/Cajun 1%
Political lean MEDSL · Monroe
- 2024 margin
- D (+19.1) · D 59.5% · R 40.5%
- 2008→2024 swing
- +1.4pp toward D · 2008: 17.7pp · 2024: 19.1pp
- All cycles
- 2024: D+19.1 2020: D+21.0 2016: D+14.1 2012: D+17.4 2008: D+17.7
Not yet ingested
- Civics
- —
Market trends
- HPI YoY
- ▲ 3.69%
- Current HPI
- 280.2411
- Rent YoY
- ▲ 6.61%
- Metro
- Rochester, NY
- State GDP YoY
- ▲ 2.60%
- F500 in state
- 92
Industry mix (Fortune 500 HQ in NY)
| Industry | F500 HQs | Revenue |
|---|---|---|
| Financial Services | 10 | $950B |
|
||
| Consumer Goods | 9 | $162B |
|
||
| Insurance | 4 | $225B |
|
||
| Telecommunications | 2 | $144B |
|
||
| Pharmaceuticals | 2 | $112B |
|
||
| Media / Entertainment | 2 | $69B |
|
||
Price history
1 event — show timeline
- 2026-06-11 Listed $74,900 UNYREIS
Cash-flow waterfall
monthlySold comps — $/sqft
last 12 mo · ≤1 miLoading sold comps…