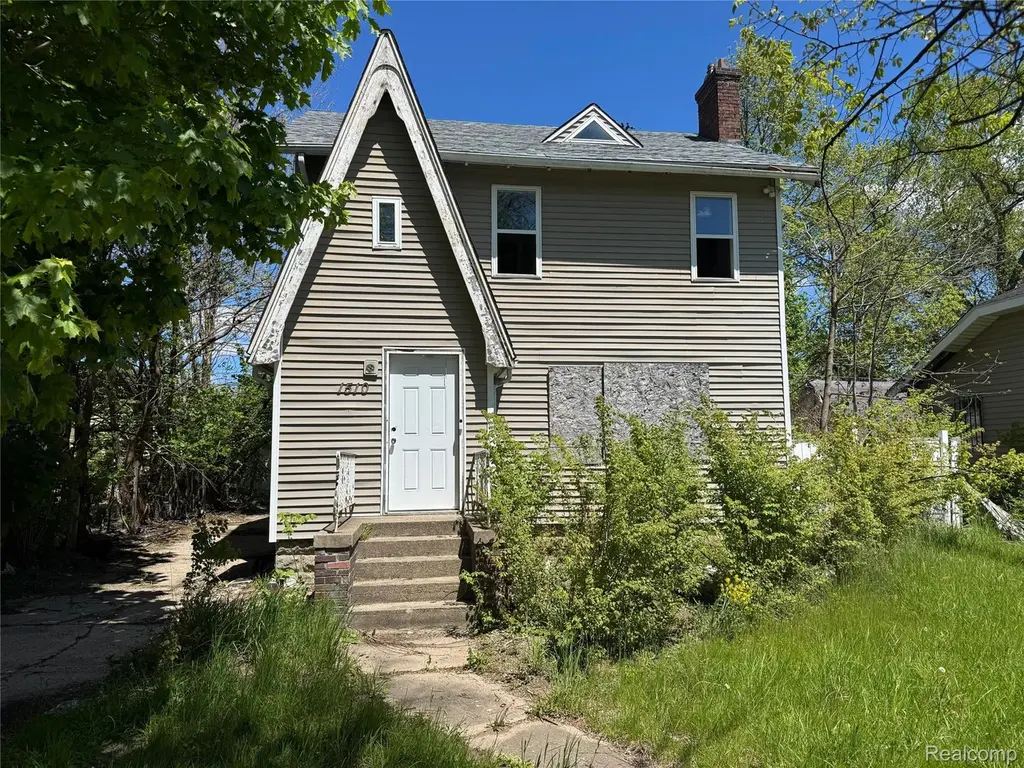
1510 Copeman Blvd · Flint, MI
Flood risk 1/10 · Minimal
- FEMA flood zone
- X (unshaded)
- Chance of flooding over 30 yrs
- 0.0%
- Est. flood insurance / yr
- $473 – $860
Fire risk 1/10 · Minimal
- Est. fire insurance / yr
- $784 – $1,456
Heat risk 2/10 · Minimal
- Hot days now (above 96°F)
- 7 days/yr
- Hot days in 30 yrs
- 15 days/yr
Wind risk 2/10 · Minimal
- Chance of severe wind over 30 yrs
- —
Air-quality risk 3/10 · Minor
- Unhealthy air days now
- 3 days/yr
- Unhealthy air days in 30 yrs
- 4 days/yr
Risk factors via First Street. Map © Google.
Why this score? — see what drove the B grade
The composite is a weighted blend of 9 inputs, each scored 0–100. Each bar is that input's sub-score; the figure is the points it added to the 100-point composite (weight × sub-score).
- Cash flow +30.0/30.0
- ARV discount +15.0/15.0
- 1% rule +10.0/10.0
- DSCR +10.0/10.0
- Livability +3.7/5.0
- Rent growth +2.5/5.0
- Condition / age +2.5/5.0
- Schools +1.1/10.0
- Appreciation +0.0/10.0
$29,900
🖨 Deal sheet (PDF) 📄 Offer letter ✓ Due diligence
Listing remarks MLS
Large three bedroom home now available, with the right vision and quality of work, this home could be worth north of 100k! Schedule your private tour today!
Key facts
- 5,227 sq ft lot
- Garage
- Built 1928
Property features AI
Finance
- Other: Residential property
Exterior
- Parking: Detached 1-car garage
- Utilities: Municipal water available; Sewer available
- Home design: Single-family residence; Ground-level entry
- Construction: Vinyl siding; Block foundation
- Exterior features: Paved road access; Lot approximately 50 x 100 (0.12 acre); Subdivision: MODERN HOUSING CORP ADD; Directions: From Welch turn south on Lavender, east on Copeman, home is on north side of street
Interior
- Bathrooms: 1 full bathroom; 1 half bathroom
- Heating & cooling: Forced air heating; Natural gas heating; No central cooling
- Interior features: Total of 6 rooms; Unfinished basement
Neighborhood map
What this means for you Summary
Snapshot
- This is a 3-bed/1.5-bath single-family listed at $30k.
Deal economics
- At list price, monthly cash flow is $570 ($7k/yr) — positive.
- The deal already cash-flows at list — no discount required.
- Meets the 1% rule at list price ($964 rent vs $30k).
- Recommended offer: $29k (1.5% below list) — sets the bar for market timing.
- Cap rate 29.2% vs local median 11.5% in Flint — top-decile yield for the area; either an underpriced asset or a hidden risk that comps aren't pricing in. Stress-test before assuming the spread holds.
Location & tenants
- Location reads 74/100 on livability (#196 in MI, #4,946 nationally) — a middle-class / working-renter tenant base. Strengths: commute A+, cost of living A+, housing A+; Watch: schools F, crime F, employment F.
- Flint School District (urban): math 7% / reading 13% proficiency, ranked #714 of 760 in MI (top 94%) — low school quality limits family demand, transient renter base, plan for 1-2y turnover; 83% free/reduced lunch — lower-income household profile, screen leases tightly.
- Market conditions: 131 active listings in the ZIP; 12 comparable units currently listed for rent nearby; rentals lingering (median 44d on market — plan ~5-8 weeks vacancy on turnover, expect pricing pressure); 58% of comp listings sitting > 30 days — soft ceiling on asking rent; 419 units permitted in Genesee County in 2024 (68 in 5+ unit buildings).
Forward outlook
- Local home prices are declining (-3.0%/yr); year-one equity from $207 of loan paydown is wiped out by about $897 of value loss. Plan a longer hold.
- Genesee County population projected at -27% by 2050 — secular population decline; favor cash flow + early exit over multi-decade hold.
- At projected returns (-3.0% appreciation + 3.0% rent growth), your $8k cash investment doubles in ~2 years — after that, you're playing with house money.
Negotiation context
- It's been on market 29 days — a 2% lower offer ($29k) is reasonable based on typical stale-listing flexibility.
- 4 sale attempts since 31y ago with the ask held roughly flat each time — persistent listings suggest the price (not the market) is what's stuck; bring a comps-based counter.
- Current owner paid $16k; list at $30k implies a 87% gain — meaningful room to come down on a strong offer.
Risks & watch-outs
- Watch-outs: built in 1928 — expect roof / HVAC / electrical / plumbing capex.
Questions for the listing agent
- Built in 1928 — when were the roof, HVAC, electrical panel, plumbing, and water heater last replaced?
- Is there a deadline driving the sale (1031 exchange, divorce, estate, relocation)? That informs how much negotiation room exists.
- Schools are F-rated, which usually means shorter tenancies and higher turnover. Who's the typical renter profile here, and what's been the actual vacancy rate?
- Crime grade is F in this area — have there been break-ins, vandalism, or insurance claims at this property in the last 3 years? What carrier currently insures it and at what premium?
- What's the average days-on-market for RENTAL listings here right now (not sales)? A rising rental-DOM trend means longer vacancies and softer asking-rent achievability than the comps imply.
- What's the recent tenant-quality profile in this submarket — average credit score on applications, eviction rate, late-payment / NSF rate, and stable-employment percentage? A property-management company in the area should have these aggregated.
- How much new for-sale + rental construction is in the pipeline within 1–3 miles? Heavy new supply typically softens prices + rents 12–24 months out; constrained supply supports both.
Investment metrics
- 1% rule
- 3.22% ✓
- Cap rate
- 29.17%
- Cash-on-cash
- 81.70%
- DSCR
- 4.64
- GRM
- 2.6
CMA / ARV
- ARV (on-the-fly)
- $46,407
- Comps found
- 12
Show comp detail 12 sales within ~0.75 mi
| Address | Dist | Beds/Ba | Sqft | Sold | Price | $/sf | Match |
|---|---|---|---|---|---|---|---|
| 2917 Mallery St | 0.25mi | 3/2.0 | 1,495 (-0%) | 4mo | $85,000 | $57 | 83 |
| 1909 Welch Blvd | 0.22mi | 3/1.5 | 1,435 (-4%) | 4mo | $28,600 | $20 | 80 |
| 1407 Greenway Ave | 0.16mi | 3/1.5 | 1,688 (+13%) | 4mo | $14,000 | $8 | 68 |
| 2730 Berkley St | 0.51mi | 3/1.0 | 1,427 (-5%) | 6mo | $69,900 | $49 | 62 |
| 2112 Winona St | 0.31mi | 3/1.5 | 1,292 (-14%) | 1mo | $30,000 | $23 | 62 |
| 1413 Greenway Ave | 0.15mi | 4/1.5 (+1) | 1,711 (+14%) | 7mo | $14,000 | $8 | 58 |
| 1801 Clement St | 0.69mi | 3/2.0 | 1,430 (-4%) | 2mo | $41,000 | $29 | 57 |
| 3310 Concord St | 0.57mi | 3/2.0 | 1,622 (+8%) | 3mo | $61,003 | $38 | 55 |
| 617 W Witherbee St | 0.55mi | 3/1.0 | 1,330 (-11%) | 4mo | $15,525 | $12 | 50 |
| 3307 Mackin Rd | 0.63mi | 3/1.5 | 1,345 (-10%) | 9mo | $104,000 | $77 | 46 |
| 506 Green St | 0.68mi | 3/1.0 | 1,312 (-12%) | 1mo | $52,000 | $40 | 45 |
| 501 W Witherbee St | 0.65mi | 3/1.0 | 1,274 (-15%) | 3mo | $39,000 | $31 | 41 |
Match score weights: distance 35% · size 25% · config 20% · recency 20%. Top-matched comps best support the ARV.
Projected returns pro-forma
-3.0% appreciation · 3.0% rent growth · sell at horizon
- IRR
- 82.0%
- Equity multiple
- 4.76×
- Total profit
- $31,463
- Equity at exit
- $4,458
- IRR
- 85.3%
- Equity multiple
- 9.86×
- Total profit
- $74,165
- Equity at exit
- $2,585
Cash invested: $8,372 (down + closing). Projections, not guarantees.
Landlord ↔ Tenant lean methodology
- Overall (STATE)
- 62 Landlord-Friendly
- State Michigan
- 62 Landlord-Friendly · EVEN
- County
- — inherits STATE
- City
- — inherits STATE
ZIP-level market 48504
- Active inventory
- 131
- Price-to-rent
- 2.6×
Monthly cashflow live
- Estimated rent
- $964 high interval (Pro) →
- Mortgage (P&I)
- −$157
- Tax from tax record
- −$22 /mo · $265/yr
- Insurance
- −$12
- HOA
- −$0
- Vacancy / Maint / Mgmt
- −$202
- Net cashflow
- $570
Break-even live
Sensitivity live
| Price | -10% $587 | -5% $578 | +0% $570 | +5% $562 | +10% $553 |
|---|---|---|---|---|---|
| Rent | -10% $494 | -5% $532 | +0% $570 | +5% $608 | +10% $646 |
| Rate | -1.0pp $585 | -0.5pp $578 | base $570 | +0.5pp $562 | +1.0pp $554 |
UW: 25.0% down · 7.5% · 30yr · 1.5% tax · 5.0% vac · 8.0% maint · 8.0% mgmt
Financing live
Cash to close
- Down payment
- $7,475
- Closing costs
- $897
- Reserves months
- —
- Total cash needed
- —
Loan-product check · same deal, 3 products live
Conventional
25% down · 7.5% · 30yr
- Down + closing
- —
- Monthly P&I
- —
- Monthly cashflow
- —
- DSCR
- —
- Eligible?
- —
Personal DTI + credit; lowest rate.
DSCR
20% down · 8.5% · 30yr
- Down + closing
- —
- Monthly P&I
- —
- Monthly cashflow
- —
- DSCR
- —
- Eligible?
- —
No personal income docs; deal must DSCR.
Hard money
10% down · 12.0% · 12mo
- Down + closing
- —
- Monthly P&I
- —
- Monthly cashflow
- —
- DSCR
- —
- Eligible?
- —
Short-term bridge; refi at stabilization.
Rent comps 12 comps
| Address | Beds | Baths | Sqft | Rent | $/sqft | DOM | Units | Dist |
|---|---|---|---|---|---|---|---|---|
| 2544 Tyrone St Flint, MI | 2.0 | 1.0 | 1440 | $825 | $0.57 | 14d | 1 | 0.93mi |
| 711 W Dewey St Flint, MI | 3.0 | 1.0 | 1011 | $925 | $0.91 | 21d | 1 | 0.96mi |
| 1540 Garland St Flint, MI | 3.0 | 2.5 | 1344 | $1,017 | $0.76 | 21d | 1 | 0.99mi |
| 2428 Norbert St Flint, MI | 3.0 | 1.0 | 1200 | $1,250 | $1.04 | 21d | 1 | 1.05mi |
| 2410 Gena Ann Ln Flint, MI | 3.0 | 2.0 | 960 | $895 | $0.93 | 45d | 1 | 1.39mi |
| 2410 Gena Ann Ln Unit GEN2410 Flint, MI | 3.0 | 2.0 | 960 | $895 | $0.93 | 44d | 1 | 1.39mi |
| 3616 Concord St Unit CON3616 Flint, MI | 3.0 | 2.0 | 960 | $895 | $0.93 | 44d | 1 | 1.42mi |
| 2419 Gena Ann Ln Unit GEN2419 Flint, MI | 3.0 | 2.0 | 960 | $895 | $0.93 | 44d | 1 | 1.43mi |
| 314 Sheffield Ave Flint, MI | 2.0 | 1.0 | 896 | $1,250 | $1.40 | 21d | 1 | 1.43mi |
| 2462 Gena Ann Ln Unit GEN2462 Flint, MI | 3.0 | 2.0 | 960 | $895 | $0.93 | 44d | 1 | 1.45mi |
| 3376 Preston Pl Unit PRE3376 Flint, MI | 3.0 | 2.0 | 960 | $895 | $0.93 | 44d | 1 | 1.47mi |
| 2332 Fredonia Ave Unit FRE2332 Flint, MI | 3.0 | 2.0 | 960 | $895 | $0.93 | 44d | 1 | 1.47mi |
Listing history 23 events
-
2026-06-18days on market $29,900 Active 29 DOM
-
2026-06-17days on market $29,900 Active 28 DOM
-
2026-06-16days on market $29,900 Active 27 DOM
-
2026-06-15days on market $29,900 Active 26 DOM
-
2026-06-14days on market $29,900 Active 24 DOM
-
2026-06-13days on market $29,900 Active 23 DOM
-
2026-06-10days on market $29,900 Active 21 DOM
-
2026-06-09days on market $29,900 Active 20 DOM
-
2026-06-08days on market $29,900 Active 19 DOM
-
2026-06-07days on market $29,900 Active 18 DOM
-
2026-06-05days on market $29,900 Active 15 DOM
-
2026-06-03days on market $29,900 Active 14 DOM
-
2026-06-02days on market $29,900 Active 13 DOM
-
2026-06-01days on market $29,900 Active 12 DOM
-
2026-05-31days on market $29,900 Active 11 DOM
-
2026-05-30days on market $29,900 Active 10 DOM
-
2026-05-20$29,900 Active
Show marketing remark (156 chars)
Large three bedroom home now available, with the right vision and quality of work, this home could be worth north of 100k! Schedule your private tour today!
-
2026-05-20$29,900 Active 156-char remark
Show marketing remark (156 chars)
Large three bedroom home now available, with the right vision and quality of work, this home could be worth north of 100k! Schedule your private tour today!
-
1995-10-14soldstatus $16,000 241-char remark
Show marketing remark (241 chars)
This House Is In Beautiful Condition Inside, This Is Not A Drive By!! Has Lots Of Character. Outside Of Home Needs Painting. Buyer To Assume All City Conditions. home Warranty. Comb. L/B. Call Lister, Betty Doyle 810-69-9226. * $20.Mls Fee.
-
1995-10-14soldstatus $16,000
Show marketing remark (241 chars)
This House Is In Beautiful Condition Inside, This Is Not A Drive By!! Has Lots Of Character. Outside Of Home Needs Painting. Buyer To Assume All City Conditions. home Warranty. Comb. L/B. Call Lister, Betty Doyle 810-69-9226. * $20.Mls Fee.
-
1995-09-21historical 241-char remark
Show marketing remark (241 chars)
This House Is In Beautiful Condition Inside, This Is Not A Drive By!! Has Lots Of Character. Outside Of Home Needs Painting. Buyer To Assume All City Conditions. home Warranty. Comb. L/B. Call Lister, Betty Doyle 810-69-9226. * $20.Mls Fee.
-
1995-08-30$20,000 241-char remark
Show marketing remark (241 chars)
This House Is In Beautiful Condition Inside, This Is Not A Drive By!! Has Lots Of Character. Outside Of Home Needs Painting. Buyer To Assume All City Conditions. home Warranty. Comb. L/B. Call Lister, Betty Doyle 810-69-9226. * $20.Mls Fee.
-
1995-08-30$20,000
Show marketing remark (241 chars)
This House Is In Beautiful Condition Inside, This Is Not A Drive By!! Has Lots Of Character. Outside Of Home Needs Painting. Buyer To Assume All City Conditions. home Warranty. Comb. L/B. Call Lister, Betty Doyle 810-69-9226. * $20.Mls Fee.
ⓘ Source: listings_history table (triggers on properties + properties_extension) + one-shot
backfill from property_details.listing_events for pre-trigger history.
Tax reassessment forecast MI · Partial reset (capped growth)
- Current annual tax
- $265 · $22/mo
- Projected year-2 tax
- $363 · $30/mo
- Expected delta
- +$98/yr (+$8/mo · 37.0%)
ⓘ Screening estimate from a state-policy table — verify with the county assessor before closing.
Climate risk First Street
- Flood 1/10 Low FEMA zone X (unshaded) · 0% chance over 30 yrs
- Wildfire 1/10 Low
- Heat 2/10 Low 7 d/yr ≥96°F today · 15 d/yr by 30 yrs out
- Wind 2/10 Low
- Air quality 3/10 Moderate 3 unhealthy d/yr today · 4 by 30 yrs out
Nearby sold comps map
Loading sold comps map…
Walkable amenities ~0.75 mi
Loading nearby amenities…
Taxation est. · year 1
- Rental income
- $11,564
- − Mortgage interest
- −$1,675
- − Property taxes
- −$265
- − Insurance
- −$150
- − Repairs & maintenance
- −$925
- − Management
- −$925
- − Depreciation
- −$870
- Taxable income
- $6,755
- Est. tax owed @ 24.0%
- −$1,621
- After-tax cash flow
- $5,219/yr
For passive investors: Depreciation is non-cash, so a rental often shows a tax loss while cash-flowing — sheltering income. Rental losses are passive: they offset passive income freely, and up to $25,000/yr can offset ordinary (W-2) income if you actively participate and your MAGI is under $100k (phasing out to $0 by $150k); unused losses carry forward. On sale, claimed depreciation is recaptured at up to 25%, and gains may owe capital-gains tax (a 1031 exchange can defer both). Figures are a year-1 estimate at your 24.0% rate — not tax advice; consult a CPA.
Schools (NCES district)
- District
- Flint School District
- NCES district ID
- 2614520
- Math proficiency
- 7% ▬ 0.00%
- Reading proficiency
- 13% ▲ 3.00%
- Median HH income
- $25,954
- Composite
- 10.97/100
- National rank
- #14642
- State rank
- #714 of 760 in MI
Livability — Flint
- Score
- 74/100
- State rank
- #196
- US rank
- #4946
Category grades
Schools grade is shown separately in the Schools card above.
Census & demographics
- Census place
- Flint, MI
- City population
- 93,814
- Population (ZIP)
- 23,873
Population outlook (Genesee County) Hauer SSP2
- Today (2025)
- 381,312 people
- By 2030
- 362,731 · -4.9%
- By 2040
- 321,550 · -15.7%
- By 2050
- 279,212 · -26.8%
- By 2075
- 193,336 · -49.3%
- By 2100
- 128,118 · -66.4%
Race, ethnicity, and origin ACS 2023
- Neighborhood character
- Predominantly Black (66%)
- Race & ethnicity
- Black 66% White 24% Two or more races 6% Hispanic / Latino 5% Asian 1%
- Common ancestry
- Romanian 2% Lithuanian 1% Italian 1%
- Foreign-born
- 3% · Canada, China
- Languages at home
- 96% English-only · Spanish 2%
Political lean MEDSL · Genesee
- 2024 margin
- Toss-up / Even · D 51.4% · R 47.2% · Other 1.4%
- 2008→2024 swing
- -28.3pp toward R · 2008: 32.5pp · 2024: 4.2pp
- All cycles
- 2024: D+4.2 2020: D+9.3 2016: D+9.5 2012: D+28.2 2008: D+32.5
Not yet ingested
- Civics
- —
Market trends
- HPI YoY
- ▼ -101.67%
- Current HPI
- 94.3111
- Rent YoY
- —
- Metro
- —
- State GDP YoY
- ▲ 1.37%
- F500 in state
- 28
Industry mix (Fortune 500 HQ in MI)
| Industry | F500 HQs | Revenue |
|---|---|---|
| Automotive Parts | 3 | $48B |
|
||
| Automotive | 2 | $372B |
|
||
| Chemicals | 1 | $45B |
|
||
| Automotive Retail | 1 | $29B |
|
||
| Healthcare / Medical Devices | 1 | $23B |
|
||
| Automotive Technology | 1 | $20B |
|
||
Price history
+49.5% since first listed7 events — show timeline
- 2026-05-20 Listed $29,900 MiRealSource-MiMLS
- 2026-05-20 Listed $29,900 REALCOMP
- 1995-10-14 Sold (MLS) $16,000 REALCOMP
- 1995-10-14 Sold (MLS) $16,000 MiRealSource-MiMLS
- 1995-09-21 Listing Removed — MiRealSource-MiMLS
- 1995-08-30 Listed $20,000 REALCOMP
- 1995-08-30 Listed $20,000 MiRealSource-MiMLS
Property tax history
-10.6%/yrLatest (2025): $265 · +19.6% YoY. Source: county tax records.
Cash-flow waterfall
monthlySold comps — $/sqft
last 12 mo · ≤1 miLoading sold comps…