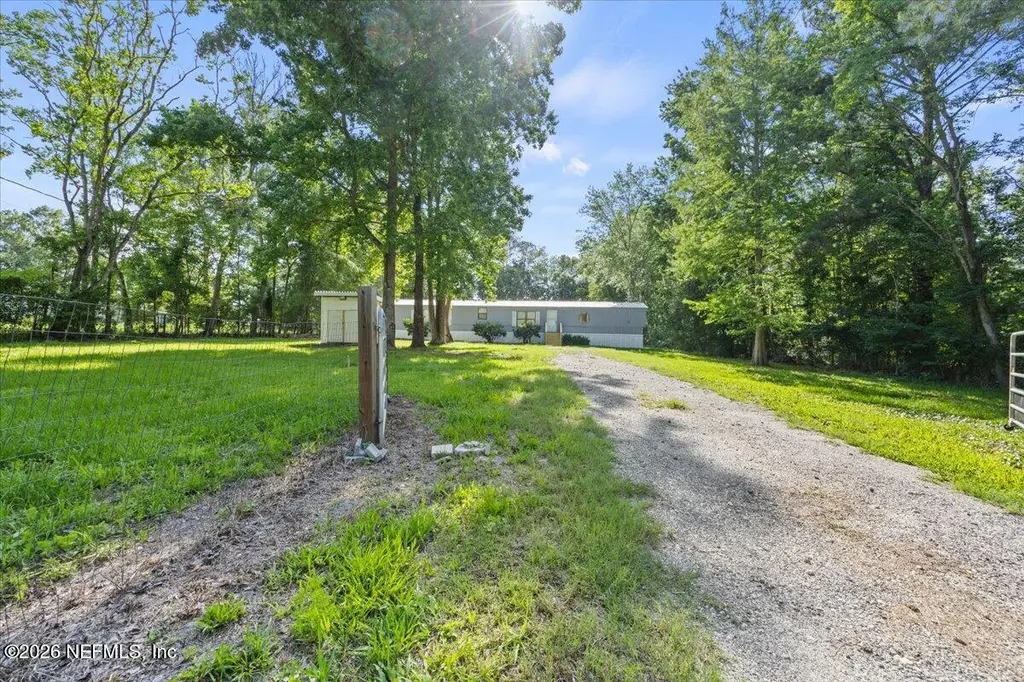
3197 Valley Vw · Middleburg, FL
Flood risk 1/10 · Minimal
- FEMA flood zone
- X (unshaded)
- Chance of flooding over 30 yrs
- 0.0%
- Est. flood insurance / yr
- $507 – $1,088
Fire risk 8/10 · Major
- Est. fire insurance / yr
- $947 – $1,759
Heat risk 8/10 · Major
- Hot days now (above 108°F)
- 7 days/yr
- Hot days in 30 yrs
- 18 days/yr
Wind risk 9/10 · Severe
- Chance of severe wind over 30 yrs
- 99.0%
Air-quality risk 3/10 · Minor
- Unhealthy air days now
- 2 days/yr
- Unhealthy air days in 30 yrs
- 3 days/yr
Risk factors via First Street. Map © Google.
Why this score? — see what drove the B- grade
The composite is a weighted blend of 9 inputs, each scored 0–100. Each bar is that input's sub-score; the figure is the points it added to the 100-point composite (weight × sub-score).
- Cash flow +26.6/30.0
- ARV discount +9.9/15.0
- DSCR +9.1/10.0
- 1% rule +6.0/10.0
- Schools +5.1/10.0
- Rent growth +3.3/5.0
- Livability +3.2/5.0
- Condition / age +2.5/5.0
- Appreciation +0.0/10.0
$174,900
🖨 Deal sheet (PDF) 📄 Offer letter ✓ Due diligence
Listing remarks
Charming and affordable country living! This well-maintained 1990 single-wide mobile home offers 3 bedrooms, 2 full bathrooms, and approximately 1,100 square feet of comfortable living space, all situated on a beautiful 1-acre lot. Enjoy the peace and privacy of rural living with plenty of room for gardening, pets, outdoor activities, or future improvements. Inside, you'll find a functional split-bedroom floor plan with a spacious living area, a cozy kitchen with ample cabinet space, and a primary suite featuring a private bathroom. The additional two bedrooms and second full bath provide plenty of space for family, guests, or a home office. Outside, the expansive lot offers endless possibi
Key facts
- Expansive lot
- Well maintained
- Private bathroom
Tags
Property features AI
Finance
- HOA & community: Not a senior community
Exterior
- Parking: Unassigned parking
- Utilities: Electricity available
- Home design: Manufactured home; Property is attached
- Exterior features: 1.04-acre lot
Interior
- Bedrooms: 3 bedrooms
- Bathrooms: 2 full bathrooms
- Heating & cooling: Central heating; Central air conditioning
- Interior features: Refrigerator included
Neighborhood map
What this means for you Summary
Snapshot
- This is a 3-bed/2.0-bath manufactured listed at $175k.
Deal economics
- At list price, monthly cash flow is $467 ($6k/yr) — positive.
- The deal already cash-flows at list — no discount required.
- Meets the 1% rule at list price ($2k rent vs $175k).
- Recommended offer: $170k (3.0% below list) — sets the bar for market timing.
- Cap rate 9.5% vs local median 3.8% in Middleburg — top-decile yield for the area; either an underpriced asset or a hidden risk that comps aren't pricing in. Stress-test before assuming the spread holds.
Location & tenants
- Location reads 65/100 on livability (#657 in FL) — a middle-class / working-renter tenant base. Strengths: cost of living A+, housing A+; Watch: amenities F, commute F, health & safety F.
- Clay (suburban): math 58% / reading 59% proficiency, ranked #14 of 73 in FL (top 19%) — acceptable for families but not a draw, mixed tenant base, ~2y average lease.
- Zoned schools: Shadowlawn Elementary School (math 70% / reading 63%, grade B+, #473 of 2,144 statewide, top 23%, 735 students, 49% FRL); Lake Asbury Junior High School (math 65% / reading 58%, grade B+, #124 of 571 statewide, top 22%, 1,037 students, 41% FRL); Clay High School (math 37% / reading 53%, grade D-, #228 of 667 statewide, top 35%, 1,666 students, 43% FRL).
- Market conditions: Rents rising (+3.4%/yr); 610 active listings in the ZIP; solid renter incomes; 1,876 units permitted in Clay County in 2024 (14 in 5+ unit buildings).
Forward outlook
- Local home prices are declining (-3.0%/yr); year-one equity from $1k of loan paydown is wiped out by about $5k of value loss. Plan a longer hold.
- Clay County population projected at +19% by 2050 — long-run rental-demand tailwind backs the buy-and-hold thesis.
- At projected returns (-3.0% appreciation + 3.4% rent growth), your $49k cash investment doubles in ~10 years — after that, you're playing with house money.
Negotiation context
- It's been on market 34 days — a 3% lower offer ($170k) is reasonable based on typical stale-listing flexibility.
- Current owner paid $1k; list at $175k implies a 17390% gain — meaningful room to come down on a strong offer.
Risks & watch-outs
- Climate carrying-cost: severe wind risk, 99% chance of damaging wind over 30y; severe wildfire risk; extreme-heat days projected 7→18/yr by 2055 (HVAC capex compounding) — expect insurance premiums to compound above CPI over the hold.
Questions for the listing agent
- It's been on market 34 days. Have you received any prior offers? Is the seller open to a 3% concession, seller financing, or rate buy-down credit?
- Is there a deadline driving the sale (1031 exchange, divorce, estate, relocation)? That informs how much negotiation room exists.
- Schools are B-rated — typically a magnet for longer-tenancy family renters. What's the average tenant stay here, and is there a school-zone premium baked into asking?
- What's the average days-on-market for RENTAL listings here right now (not sales)? A rising rental-DOM trend means longer vacancies and softer asking-rent achievability than the comps imply.
- What's the recent tenant-quality profile in this submarket — average credit score on applications, eviction rate, late-payment / NSF rate, and stable-employment percentage? A property-management company in the area should have these aggregated.
- How much new for-sale + rental construction is in the pipeline within 1–3 miles? Heavy new supply typically softens prices + rents 12–24 months out; constrained supply supports both.
Investment metrics
- 1% rule
- 1.10% ✓
- Cap rate
- 9.50%
- Cash-on-cash
- 11.45%
- DSCR
- 1.51
- GRM
- 7.6
CMA / ARV
- ARV (on-the-fly)
- $184,800
- Comps found
- 2
Show comp detail 2 sales within ~0.75 mi
| Address | Dist | Beds/Ba | Sqft | Sold | Price | $/sf | Match |
|---|---|---|---|---|---|---|---|
| 4249 Deer Trl | 0.52mi | 3/2.0 | 1,078 (-2%) | 7mo | $175,000 | $162 | 67 |
| 4053 Sunnyside Dr | 0.66mi | 3/1.0 | 952 (-14%) | 3mo | $160,000 | $168 | 40 |
Match score weights: distance 35% · size 25% · config 20% · recency 20%. Top-matched comps best support the ARV.
Projected returns pro-forma
-3.0% appreciation · 3.35% rent growth · sell at horizon
- IRR
- 1.1%
- Equity multiple
- 1.04×
- Total profit
- $2,024
- Equity at exit
- $26,078
- IRR
- 11.0%
- Equity multiple
- 1.87×
- Total profit
- $42,608
- Equity at exit
- $15,122
Cash invested: $48,972 (down + closing). Projections, not guarantees.
Landlord ↔ Tenant lean methodology
- Overall (STATE)
- 87 Strongly Landlord-Friendly
- State Florida
- 87 Strongly Landlord-Friendly · R+3
- County
- — inherits STATE
- City
- — inherits STATE
ZIP-level market 32068
- Home prices YoY
- -27.5%
- Rents YoY
- 3.4%
- Active inventory
- 610
- Price-to-rent
- 7.6×
Monthly cashflow live
- Estimated rent
- $1,922 medium interval (Pro) →
- Mortgage (P&I)
- −$917
- Tax from tax record
- −$61 /mo · $734/yr
- Insurance
- −$73
- HOA
- −$0
- Vacancy / Maint / Mgmt
- −$404
- Net cashflow
- $467
Break-even live
Sensitivity live
| Price | -10% $566 | -5% $517 | +0% $467 | +5% $418 | +10% $368 |
|---|---|---|---|---|---|
| Rent | -10% $315 | -5% $391 | +0% $467 | +5% $543 | +10% $619 |
| Rate | -1.0pp $555 | -0.5pp $512 | base $467 | +0.5pp $422 | +1.0pp $376 |
UW: 25.0% down · 7.5% · 30yr · 1.5% tax · 5.0% vac · 8.0% maint · 8.0% mgmt
Financing live
Cash to close
- Down payment
- $43,725
- Closing costs
- $5,247
- Reserves months
- —
- Total cash needed
- —
Loan-product check · same deal, 3 products live
Conventional
25% down · 7.5% · 30yr
- Down + closing
- —
- Monthly P&I
- —
- Monthly cashflow
- —
- DSCR
- —
- Eligible?
- —
Personal DTI + credit; lowest rate.
DSCR
20% down · 8.5% · 30yr
- Down + closing
- —
- Monthly P&I
- —
- Monthly cashflow
- —
- DSCR
- —
- Eligible?
- —
No personal income docs; deal must DSCR.
Hard money
10% down · 12.0% · 12mo
- Down + closing
- —
- Monthly P&I
- —
- Monthly cashflow
- —
- DSCR
- —
- Eligible?
- —
Short-term bridge; refi at stabilization.
Listing history 21 events
-
2026-06-21days on market $174,900 Active 34 DOM
-
2026-06-18days on market $174,900 Active 31 DOM
-
2026-06-17days on market $174,900 Active 30 DOM
-
2026-06-16days on market $174,900 Active 29 DOM
-
2026-06-15days on market $174,900 Active 28 DOM
-
2026-06-13days on market $174,900 Active 26 DOM
-
2026-06-13pricedays on market $174,900 Active 25 DOM
-
2026-06-09days on market $179,900 Active 22 DOM
-
2026-06-08days on market $179,900 Active 21 DOM
-
2026-06-07days on market $179,900 Active 20 DOM
-
2026-06-03days on market $179,900 Active 16 DOM
-
2026-06-02days on market $179,900 Active 15 DOM
-
2026-06-01days on market $179,900 Active 14 DOM
-
2026-05-31days on market $179,900 Active 13 DOM
-
2026-05-18price $179,900
-
2026-05-18$599,000 Active
-
2022-11-25historical
-
2004-07-30soldstatus $1,000
-
2001-02-20soldstatus $16,000
-
1988-09-06soldstatus $12,000
-
1982-11-01soldstatus $6,000
ⓘ Source: listings_history table (triggers on properties + properties_extension) + one-shot
backfill from property_details.listing_events for pre-trigger history.
Tax reassessment forecast FL · Resets to sale price
- Current annual tax
- $734 · $61/mo
- Projected year-2 tax
- $1,452 · $121/mo
- Expected delta
- +$718/yr (+$60/mo · 97.8%)
ⓘ Screening estimate from a state-policy table — verify with the county assessor before closing.
Climate risk First Street
- Flood 1/10 Low FEMA zone X (unshaded) · 0% chance over 30 yrs
- Wildfire 8/10 Severe
- Heat 8/10 Severe 7 d/yr ≥108°F today · 18 d/yr by 30 yrs out
- Wind 9/10 Extreme 99% chance of damaging wind over 30 yrs
- Air quality 3/10 Moderate 2 unhealthy d/yr today · 3 by 30 yrs out
Nearby sold comps map
Loading sold comps map…
Walkable amenities ~0.75 mi
Loading nearby amenities…
Taxation est. · year 1
- Rental income
- $23,064
- − Mortgage interest
- −$9,797
- − Property taxes
- −$734
- − Insurance
- −$874
- − Repairs & maintenance
- −$1,845
- − Management
- −$1,845
- − Depreciation
- −$5,088
- Taxable income
- $2,880
- Est. tax owed @ 24.0%
- −$691
- After-tax cash flow
- $4,915/yr
For passive investors: Depreciation is non-cash, so a rental often shows a tax loss while cash-flowing — sheltering income. Rental losses are passive: they offset passive income freely, and up to $25,000/yr can offset ordinary (W-2) income if you actively participate and your MAGI is under $100k (phasing out to $0 by $150k); unused losses carry forward. On sale, claimed depreciation is recaptured at up to 25%, and gains may owe capital-gains tax (a 1031 exchange can defer both). Figures are a year-1 estimate at your 24.0% rate — not tax advice; consult a CPA.
Schools (NCES district)
- District
- Clay
- NCES district ID
- 1200300
- Math proficiency
- 58% ▼ -8.00%
- Reading proficiency
- 59% ▼ -3.00%
- Median HH income
- $59,379
- Composite
- 50.73/100
- National rank
- #1815
- State rank
- #14 of 73 in FL
Livability — Middleburg
- Score
- 65/100
- State rank
- #657
- US rank
- #13174
Category grades
Schools grade is shown separately in the Schools card above.
Census & demographics
- County
- Clay County · 208,450 people
- City population
- 58,983
- Metro
- Jacksonville, FL
- Population (ZIP)
- 58,983
- Household income
- $84,431
- Rent vs Own
- Severe rent burden
- 975.0
Population outlook (Clay County) Hauer SSP2
- Today (2025)
- 230,495 people
- By 2030
- 242,427 · +5.2%
- By 2040
- 262,244 · +13.8%
- By 2050
- 275,148 · +19.4%
- By 2075
- 295,397 · +28.2%
- By 2100
- 287,592 · +24.8%
Race, ethnicity, and origin ACS 2023
- Neighborhood character
- Predominantly White (74%)
- Race & ethnicity
- White 74% Hispanic / Latino 13% Two or more races 10% Black 7%
- Hispanic origin (detail)
- Mexican 2% Puerto Rican 5%
- Common ancestry
- Slovak 2% Romanian 2% Lithuanian 2%
- Foreign-born
- 7% · Canada, Jamaica
- Languages at home
- 87% English-only · Spanish 9% Arabic 1% German/W. Germanic 1%
Political lean MEDSL · Clay
- 2024 margin
- Solid R (+39.3) · D 29.9% · R 69.2%
- 2008→2024 swing
- +3.6pp toward D · 2008: -42.8pp · 2024: -39.3pp
- All cycles
- 2024: R+39.3 2020: R+37.1 2016: R+44.3 2012: R+45.8 2008: R+42.8
Not yet ingested
- Civics
- —
Market trends
- HPI YoY
- ▼ -115.99%
- Current HPI
- 305.2531
- Rent YoY
- ▲ 3.35%
- Metro
- Jacksonville, FL
- State GDP YoY
- ▲ 3.28%
- F500 in state
- 36
Industry mix (Fortune 500 HQ in FL)
| Industry | F500 HQs | Revenue |
|---|---|---|
| Industrial Technology | 2 | $29B |
|
||
| Insurance | 2 | $17B |
|
||
| Retail | 1 | $60B |
|
||
| Technology Distribution | 1 | $58B |
|
||
| Homebuilding | 1 | $35B |
|
||
| Technology Manufacturing | 1 | $35B |
|
||
Price history
+2898.3% since first listed7 events — show timeline
- 2026-05-18 Price Changed $179,900 realMLS
- 2026-05-18 Listed $599,000 realMLS
- 2022-11-25 Rental Removed — RENT.
- 2004-07-30 Sold (Public Records) $1,000 Public Records
- 2001-02-20 Sold (Public Records) $16,000 Public Records
- 1988-09-06 Sold (Public Records) $12,000 Public Records
- 1982-11-01 Sold (Public Records) $6,000 Public Records
Property tax history
+4.7%/yrLatest (2025): $734 · +3.0% YoY. Source: county tax records.
Cash-flow waterfall
monthlySold comps — $/sqft
last 12 mo · ≤1 miLoading sold comps…